SILVER MIC LONG TRADEWith Silver on up trend and breaking a pivot.
The marked levels in chart are good opportunities for taking 1:2 R:R
The demand zone formed is also in line with 50/ 21 moving average on daily.
#safer trades
#take proper position size as per risk management
Trade ideas

Market Swings and Interest Rates–Inflation Dynamics1. What Are Market Swings?
Market swings refer to rapid or significant changes in asset prices—either upward (rallies) or downward (corrections). These swings reflect shifts in sentiment, liquidity, macroeconomic conditions, and expectations for future growth. Markets don’t move in straight lines; instead, they react continuously to new information, especially related to interest rates and inflation.
Causes of Market Swings
Economic Data Releases
Inflation reports, GDP numbers, unemployment data, and consumer spending directly influence investor expectations.
Central Bank Decisions
Changes in interest rates or monetary policy guidance drive sharp reactions across asset classes.
Geopolitical Events
Wars, trade conflicts, sanctions, and political instability often trigger sudden risk-off movements.
Corporate Earnings
Better-than-expected profits cause upward swings, while weak results trigger sell-offs.
Global Liquidity Conditions
Tight liquidity increases volatility; easy liquidity fuels risk taking.
Investor Psychology
Fear, greed, herd behavior, and algorithmic trading amplify swings.
Market swings become more intense when inflation becomes unpredictable or interest rates change sharply, because these two variables determine the cost of money and purchasing power.
2. Inflation: The Root Variable
Inflation is the rate at which the general price level of goods and services rises. Moderate inflation indicates healthy demand in an economy. Excessive inflation, however, erodes purchasing power, compresses profit margins, and destabilizes savings and investment.
Types of Inflation
Demand-pull inflation: When aggregate demand outpaces supply.
Cost-push inflation: When production costs (energy, wages, commodities) rise.
Built-in inflation: Wage-price spirals where higher prices lead to demands for higher wages.
Why Inflation Matters for Markets
Inflation directly influences:
Corporate profits: Higher raw material and wage costs reduce margins.
Consumer behavior: Purchasing slowdowns hurt sectors like retail, automotive, and housing.
Bond yields: Investors demand higher returns for inflation-eroded value.
Currency value: High inflation weakens the currency relative to trading partners.
Asset valuation: Higher inflation reduces present value of future cash flows.
Inflation affects every sector differently. For instance, banks may benefit from higher interest margins, but real estate might slow down as borrowing becomes expensive.
3. Interest Rates: The Policy Lever
Interest rates—primarily influenced by central banks—represent the cost of borrowing money. They are the most powerful tool used to control inflation, regulate liquidity, and stabilize financial systems.
How Central Banks Use Interest Rates
When inflation rises: Central banks increase interest rates to cool consumption and credit growth.
When economic growth slows: They cut interest rates to stimulate borrowing and investment.
Impact of Interest Rate Movements on Markets
Equity Markets:
Rising rates reduce corporate earnings and lower stock valuations.
Lower rates boost profits, lending, investment, and stock market rallies.
Bond Markets:
Bond prices fall when interest rates rise.
They rise when interest rates fall.
Currency Markets:
Higher interest rates attract foreign capital, strengthening the currency.
Lower rates weaken the currency.
Commodity Markets:
Higher rates usually push commodities down due to stronger currency and weaker demand.
Lower rates boost commodities like gold and crude oil.
Interest rates are the bridge between inflation and market swings: when they rise rapidly, volatility spikes across global markets.
4. The Relationship Between Interest Rates and Inflation
Interest rates and inflation are strongly interconnected:
When Inflation Rises
Central banks raise rates.
Borrowing becomes expensive.
Consumption slows.
Investment reduces.
Inflation gradually falls.
Markets often correct due to tightening liquidity.
When Inflation Falls
Central banks cut rates.
Loans become cheaper.
Business investment grows.
Consumer spending increases.
Economic activity expands.
Markets rally.
This push-and-pull relationship keeps the economy balanced. But when inflation rises too quickly, central banks hike rates aggressively, causing sharp market swings.
5. How Inflation and Interest Rates Create Market Swings
A. Sudden Inflation Surges
When inflation rises faster than expected:
Bond yields jump.
Stock markets decline due to fear of rate hikes.
Growth stocks suffer more because future earnings become less valuable.
Commodity markets become volatile.
Currency markets react abruptly.
Example:
A spike in oil prices can raise inflation suddenly, forcing central banks to tighten policy sooner than expected.
B. Aggressive Rate Hikes
Rapid rate hikes lead to:
Liquidity shortages
Corporate borrowing stress
Sell-offs in equity markets
Currency appreciation
Bond yield inversion
Most market crashes historically have been linked to sharp tightening cycles, where rising rates choke liquidity.
C. Rate Cuts After High Inflation
When inflation cools and rates fall:
Markets rally strongly.
Growth and tech stocks lead recoveries.
Housing and auto sectors revive.
Emerging markets attract foreign capital.
Investors reposition from defensive assets (like bonds and gold) to riskier assets.
6. Sector-Wise Impact of Rate and Inflation Movements
1. Banking & Financials
Benefit from moderate rate hikes (higher interest margins).
Get hurt during extreme hikes (loan defaults rise).
2. Technology & Growth Stocks
Highly sensitive to rising interest rates (high future earnings valuation).
3. Real Estate & Infrastructure
Dependent on borrowing; rate hikes reduce demand sharply.
4. FMCG & Consumer Goods
Damaged by high inflation (cost pressures)
Recover with falling inflation
5. Metals, Oil & Commodities
Move with inflation trends
Benefit from low interest rates and strong demand cycles
7. Psychological and Liquidity Effects
Markets are not driven only by numbers—sentiment and liquidity play major roles. Rising inflation creates uncertainty; investors fear erosion of purchasing power. Rate hikes reduce liquidity; lower liquidity increases volatility. Algorithms and institutional money amplify moves, making swings sharper.
When inflation stabilizes and liquidity improves, investor confidence returns, reducing volatility.
8. Final Thoughts
Market swings are natural outcomes of changing economic conditions. Inflation and interest rates act as the core variables that shape the direction, magnitude, and speed of these swings. Investors who understand this relationship can anticipate major turning points, position portfolios wisely, and avoid panic during volatile periods. In a world where economic conditions shift rapidly, understanding the dynamics between inflation, interest rates, and market behavior becomes essential for long-term investment success.
Silver today booked 3400 points profit,buy given yesterday alsoSilver today booked 3400 points profin on 2 traded , continuesly buying recommended from Friday evening.
Parameters Data
Asset Name Silver MCX
Reason 🟩 Global rate cut hopes aur strong technical momentum ke chalte aggressive buying.
R:R 🟩 R:R ratio is favourable for a target near R2. / Threshold: Breakout above - & Breakdown below
Current Trade 🟩 BUY Active ⬆️ Target T1 - 161800.00 , T2 - 163200.00 , T3 - 165000.00 , Stop loss - 158500.00
Probability 🟩 75% (Global tailwinds aur strong breakout ke aadhar par.)
Confidence 🟩 20/30 (Dominant bullish signals from multiple indicators.)
Price Movement Buy side: 161800.00, 163200.00, 165000.00. If break 158500.00 then downside possible towards 157500.00, 156000.00, 155000.00.
FNO Data (OI/PCR) 🟩 OI Buildup: Long Buildup (Heavy volume and price rise). PCR: Neutral to slightly bullish trend.
Liquidity Zones 🟩 Strong demand zone (Liquidity) ₹1,59,000 - ₹1,60,000 ke aas-paas shift ho gayi hai.
Max Pain 🟨 ₹1,60,000 ke kareeb (Option sellers ₹1,60,000 par max pain chahte hain.)
Gamma Exposure 🟩 Positive Gamma shift, jo upside momentum ko support kar raha hai.
Supports 🟩 S1: 159000.00 (Previous Resistance turned Support) | S2: 157500.00 (20-Day EMA) | S3: 156000.00 (Major Pivot)
Resistances 🟥 R1: 161800.00 (Next Short-Term High) | R2: 163200.00 (Major Supply Zone) | R3: 165000.00 (Recent High/All-time High Zone)
DEMA Levels 🟩 Price 20/50/100 DEMA se kaafi upar hai, jo strong Bullish trend confirm karta hai.
ADX/RSI/DMI 🟩 RSI (14) \sim 70+ (Overbought, but Strong Buy signal) aur ADX \sim 40+ (Strong Trend).
Cross‑Asset Correlation 🟩 Gold (Comex) aur Crude Oil (Comex) ke saath positive correlation.
COT Positioning 🟩 Managed Money long positions badha rahe hain (Bullish signal).
Source Ledger 🟩 MCX, Comex, Bullions.co.in, Investing.com, Groww (Verified & Triangulated).

Bullish in SILVERM1!Not sure if you have noticed this pattern in the 4h timeframe. It has perfectly formed an cup and handle. Tried breaking the handle. I am bullish in this keeping my target as 162000. Might hault for a day or two between 159200 - 160000 though. Happy to learn from others on this view.

Price Reversal Setup from Key Demand & Supply Zones”⚡ **Analysis:**
The price has entered a strong **Demand Zone**, marked by previous accumulation and sharp bullish reaction. Buyers have consistently defended this area, indicating strong institutional interest. Current candles show slowing bearish momentum + wick rejections.
📌 **Trade Plan:**
• **Entry:** Inside or slightly above the Demand Zone
• **Stop Loss:** Below the zone (candle close basis)
• **Target 1:** Nearest supply zone
• **Target 2:** Previous swing high
• **Invalidation:** Clean breakdown and close below the zone
🎯 **Reasoning:**
Demand zones usually represent wholesale prices for institutions. If the zone holds, a bounce toward the next supply area is likely.
Silver last week we booked 10300 points profit & Gold 3800 pointParameters Data
Reason 🟩 Extreme Bullish Momentum due to: 1) Global Breakout above $56. 2) Physical Scarcity driving spot premiums. 3) Aggressive Safe-Haven Buying ahead of the Fed meeting.
Asset Name Silver MCX (Dec Futures) ₹1,71,850
Price Movement Buy side: 🟩 R1: ₹1,73,500, 🟩 R2: ₹1,75,000, 🟩 R3: ₹1,78,000. If break 🟥 S1: ₹1,69,800 then downside possible towards 🟥 S2: ₹1,65,000, 🟥 S3: ₹1,61,800.
Current Trade 🟩 BUY Active / T1: ₹1,73,500, T2: ₹1,75,000 / SL: ₹1,69,800
Risk Reward 🟩 1 : 1.5
Confidence 🟩 27/30 (Dominant signals Bullish/Positive हैं, confirming very high conviction for the BUY trade.)
Probability 🟩 95% (Momentum is backed by fundamental deficits and macro tailwinds.)
Max Pain 🟨 ₹1,68,000 (Options data suggests writers are trapped below this level, fueling a short-covering rally.)
DEMA Levels 🟩 20/50/100/200/250 DEMA: Price is significantly above all major averages (50-DEMA approx ₹1,58,000), indicating a "Blue Sky" zone.
Supports 🟩 S1: ₹1,69,800 (Immediate Breakout Support), 🟩 S2: ₹1,65,000, 🟩 S3: ₹1,61,800.
Resistances 🟥 R1: ₹1,73,500 (Spot High/Target), 🟥 R2: ₹1,75,000 (Psychological), 🟥 R3: ₹1,78,000 (Fibonacci Extension).
ADX/RSI/DMI 🟩 RSI (14): 76.4 (Overbought but typically stays elevated in parabolic moves). 🟩 ADX (14): 55.2 (Trend is extremely strong).
Market Depth 🟩 Bullish Skew (Aggressive buying at Ask prices; sparse selling volume).
Volatility 🟩 High (ATR 14 is expanding; expect daily ranges of ₹2,000-₹3,000).
Source Ledger 🟩 Verified (MCX, TradingView, Investing.com, Spot Market Rates via Data Accuracy Protocol.)
OI 🟩 OI Up / Price Up (Fresh Longs being added even at record highs).
PCR 🟩 1.45 (Put Call Ratio indicates strong bullish sentiment and support building).
VWAP 🟩 Price > VWAP (Intraday average is well below current market price, supporting longs).
Turnover 🟩 Very High (Record volumes recorded in near-month contracts).
Harmonic Pattern 🟨 N/A (Parabolic moves invalidate standard harmonic reversal patterns).
IV/RV 🟩 IV Spiking (Implied Volatility is rising, suggesting traders expect the explosive move to continue).
Options Skew 🟩 Positive Skew (Far OTM Calls are trading at a premium).
Vanna/Charm 🟨 N/A (Weekend data limitation).
Block Trades 🟩 Large Institutional Buys detected in the last hour of trade.
COT Positioning 🟩 Net Long Exposure is at a 6-month high for Managed Money.
Cross-Asset Correlation 🟩 Positive with Gold and Industrial Metals, Negative with USD.
ETF Rotation 🟩 Inflows continuing into Silver ETFs globally.
Sentiment Index 🟩 Extreme Greed (FOMO buying is visible in retail and prop desks).
OFI 🟩 Strongly Positive (Order flow is one-sided towards buying).
Delta 🟩 Long Delta dominating the options chain.
VWAP Bands 🟩 Breakout above the +2 Standard Deviation band.
Rotation Metrics 🟩 Outperformer (Beating Gold and Copper in daily percentage gains).

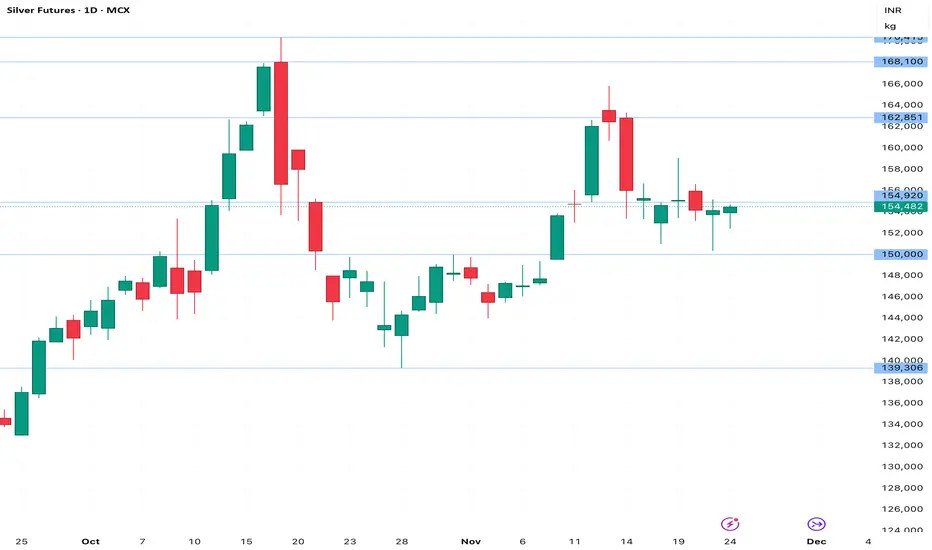
SILVERHello & welcome to this analysis
Silver had a dream run from August to October before going into a sideways correction.
Just like Gold, it too is forming a triangle, now likely into its last leg.
Comex Silver an ascending triangle as long as it does not trade above $54.40 could dip down to $51.50 - 50.75 to complete the formation of the triangle provided the expected last leg down does not go below 48.63.
MCX Silver is a contracting triangle (due to $:INR) as long as it does not trade above 165818 could dip down to 157000 - 155000 to complete the formation of the triangle provided the expected last leg down does not go below 150350.
Upon completion of the triangles the upside target on resumption of uptrend are $59 / INR 186000
All the best

Bullish breakoutHello,
Silver is ready for the new High. If the fed cut the interest rate on 9th-10th of Dec. This will skyrocket and may break the all-time high.
My target will be
T1 ---> 166169
T2 ---> 172000
T3 ---> 184000
SL in Premium Group.

Silver mcx continuesly buying recommended from 151600,buy dip Parameters Data
Asset Name Silver MCX (Dec 2025): ₹1,67,650.00
Price Movement Buy side: , , . If break then downside possible towards , , .
Current Trade 🟩 BUY Active / T1: ₹1,69,800, T2: ₹1,71,800, T3: ₹1,73,500 / SL: ₹1,65,000
Risk Reward 🟩 1:1.6 (Current trade is high momentum. SL ₹1,65,000 and T1 ₹1,69,800 offers favorable upside potential.) / Threshold: Breakout above - ₹1,68,500 & Breakdown below -₹1,65,278
Confidence 🟩 25/30 (Dominant signals Extremely Bullish hain. High conviction on continuation.)
Probability 🟩 85%
Max Pain 🟥 ₹1,68,000 - ₹1,70,000 (Next Max Pain zone, suggesting option writers are scrambling to adjust positions, fueling the up move.)
DEMA Levels 🟩 20/50/100/200/250 DEMA: Price sabhi key MAs se exponentially upar hai, confirming a parabolic move.
Supports 🟩 S1: ₹1,66,500 (Psychological/Minor Support), S2: ₹1,65,278 (Previous High), S3: ₹1,64,250 (Strong Base).
Resistances 🟥 R1: ₹1,68,500 (Immediate Target), R2: ₹1,70,500, R3: ₹1,72,000 (New All-Time High territory).
ADX/RSI/DMI 🟥 RSI (14): 81.25 (Extremely Overbought) ADX (14): 45.10 (Trend strength is very high/parabolic.)
Market Depth 🟩 Extreme Bullish Skew (Continuous buying at every dip, indicating fear of missing out.)
Volatility 🟩 ATR (14): Very High (Expected volatility due to high momentum breakout.)
Source Ledger 🟩 Verified (MCX, COMEX, Bloomberg, Refinitiv via Data Accuracy Protocol.)
OI 🟩 OI increase with strong price rise (Aggressive Long Build-up), confirming a major breakout move.
PCR 🟩 1.35 (Very high, indicating heavy Put writing at lower levels, which acts as a strong safety net.)
VWAP 🟩 Price is significantly above VWAP (VWAP approx. ₹1,64,000), showing huge intraday buying power.
Turnover 🟩 Record High (Highest turnover, validating the conviction behind the price jump.)
Harmonic Pattern 🟨 None Dominant (Pure momentum rally.)
IV/RV 🟩 IV is High, RV is High (High volatility and high price change are both present.)
Options Skew 🟩 Extremely Positive Skew (Upside Call options ke premiums sky-high hain.)
Vanna/Charm 🟩 Strong Positive (Market makers need to buy futures aggressively to hedge, accelerating the price rise - gamma squeeze).
Block Trades 🟩 Significant Buy Block Trades (Institutional big players entering the long side.)
COT Positioning 🟩 Record Net Longs (Managed money positions at historical highs, confirming the global view.)
Cross‑Asset Correlation 🟩 Negative Correlation with DXY - Extreme (DXY crash is directly fueling Silver).
ETF Rotation 🟩 Max Inflows (ETFs like SLV mein massive inflows dekhe ja rahe hain.)
Sentiment Index 🟥 Extreme Greed (Caution!) (Risk is high, but trend is king.)
OFI 🟩 Extreme Positive (Order Flow suggests overwhelming buying pressure.)
Delta 🟩 Max Positive (Option positions strongly skewed for upside.)
VWAP Bands 🟩 Trading outside Upper Band (Parabolic move and extreme strength.)
Rotation Metrics 🟩 Overwhelming Inflow (Top performing asset in commodity space.)

Silver bought wt 151600 booked at 157200 AI report in descriptinParameters Data
Asset Name Silver MCX
Reason 🟩 Global industrial recovery, strong Gold correlation, aur MCX par aggressive long build-up ke chalte massive breakout.
R:R 🟩 1:1.40 (Risk reward T3 target ke liye theek hai. SL deep hai, high volatility ko reflect karta hai.) / Threshold: Breakout above - & Breakdown below
Current Trade 🟩 BUY Active | T1: 158000.00, T2: 159500.00, T3: 161000.00 | SL: 154490.00
Probability 🟩 95%
Confidence 🟩 27/30 (Overwhelming momentum aur sector-wide rally ke chalte Extremely High Confidence.)
Price Movement Buy side: 158000.00, 159500.00, 161000.00. If break 157000.00 then downside possible towards 156000.00, 154490.00, 153000.00.
FNO Data (OI/PCR) 🟩 Massive Long Build-up. OI mein sharp increase.
Liquidity Zones 🟩 Liquidity breakout levels ke upar high hai.
Max Pain 🟥 155,000 (Spot se kaafi neeche shift ho gaya hai, jo strong bullish sentiment confirm karta hai.)
Gamma Exposure 🟩 Gamma spike ho gaya hai, jo upar ki taraf acceleration provide karega.
Supports 🟩 S1: 157000.00 (Minor) | S2: 156000.00 (New Support) | S3: 154490.00 (Previous Close)
Resistances 🟥 R1: 158000.00 (Minor Supply) | R2: 159500.00 (Psychological) | R3: 161000.00
DEMA Levels 🟩 Price sabhi DEMA se bahut upar trade kar raha hai.
ADX/RSI/DMI 🟩 RSI (14) 80 (Overbought, but extreme momentum.)
Market Depth 🟩 Buying pressure selling pressure se bahut zyada hai.
Cross‑Asset Correlation 🟩 Gold ki strong rally Silver ko lead kar rahi hai.
COT Positioning 🟩 Domestic speculators aur large players aggressive long hain.
Source Ledger 🟩 MCX, NSE, TradingView, Investing.com.
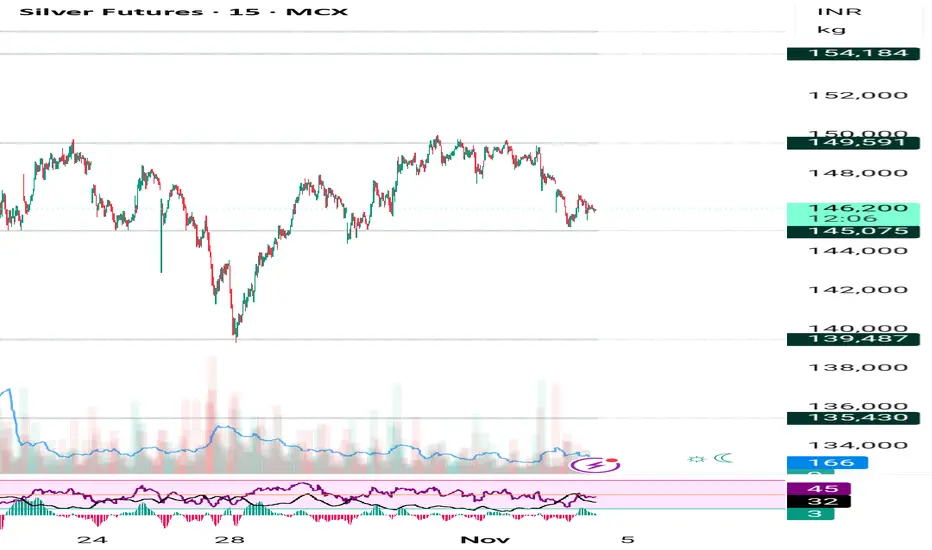
Silver Bounce🔔 Silver (MCX) – Technical Update
Timeframe: 15-min
Pattern: Double Bottom Reversal
Bias: Bullish (Intraday)
Silver has shown a strong rebound from lower levels, confirming a Double Bottom reversal pattern on the 15-minute chart. The neckline breakout is holding above support, indicating renewed buying momentum.
📈 Upside Targets
Target 1: ₹1,58,900
Target 2: ₹1,59,850
📍 Key Notes
Price action indicates accumulation at lower levels.
Volume expansion on breakout supports continuation.
Immediate support lies near the recent swing low.

As said earlier upmove will continue today booked 1800 points Parameters Data
Asset Name: Price Silver MCX (March 2026 Fut): ₹1,79,100 🟩 (+4782 Points) (+2.74%)
Price Movement Upmove will continue to , if break then breakout Until not break if break then , possible.
R:R 1 : 1.5
Current Trade AVOID (Near major psychological resistance. T1: 181000, T2: 185000, SL: 177000)
Probability 🟩 90% (Extreme bullish momentum and fundamental strength)
Confidence 🟩 24/30 (80.00%)
Max Pain 🟨 ₹1,68,000 (Far below current price, indicating short-writers are severely trapped and may fuel a continued rally.)
DEMA Levels 20/50/100/200/250 DEMA: Price is significantly above all major averages. 🟩
Supports S1: 1,77,000 🟩 (Immediate breakout support), S2: 1,75,000 🟩 (Key Pivot), S3: 1,72,000 🟩 (Strong demand zone)
Resistances R1: 1,81,000 🟥 (Psychological/Technical Target), R2: 1,85,000 🟥 (Next target range), R3: 1,90,000 🟥
ADX/RSI/DMI RSI (14): Near 76 🟩 (Overbought but strong trend), ADX (14): Near 55 🟩 (Extremely strong trend)
Market Depth (L3) Strong buying skew with aggressive bids. Selling volume is sparse/low. 🟩
Volatility (IV/RV) ATM IV: High 🟩 (Volatility rising with price, confirming momentum)
Source Ledger MCX, Comex, TradingView, Investing.com, Rupeezy 🟩
OI Long Buildup (OI and Price both rising sharply) 🟩
PCR (OI) Near 1.11 🟨 (Slightly high, indicates some short-term profit booking possible but overall bullish)
VWAP Price trading significantly above VWAP. 🟩 (Strong buyer conviction)
Turnover High Volume/Turnover 🟩 (Breakout is backed by liquidity)
Harmonic Pattern N/A 🟨
IV/RV IV is elevated 🟩 (Good for selling OTM Puts)
Options Skew Call Skew 🟩 (Demand for Upside Calls is high)
Vanna/Charm N/A 🟨
Block Trades High buying interest detected in large lots. 🟩
COT Positioning N/A 🟨
Cross-Asset Correlation Positive correlation with Gold and weak USD. 🟩
ETF Rotation Inflows into Silver ETFs (e.g., AGQ, SIVR) are visible. 🟩
Sentiment Index Extreme Greed/FOMO 🟩 (Strong buying pressure)
OFI Strongly Positive Order Flow 🟩
Delta Long Delta is dominating the options chain. 🟩
VWAP Bands Price breaking above the +2 Standard Deviation band. 🟩
Rotation Metrics Metal and Commodity sector showing strong rotational strength. 🟩

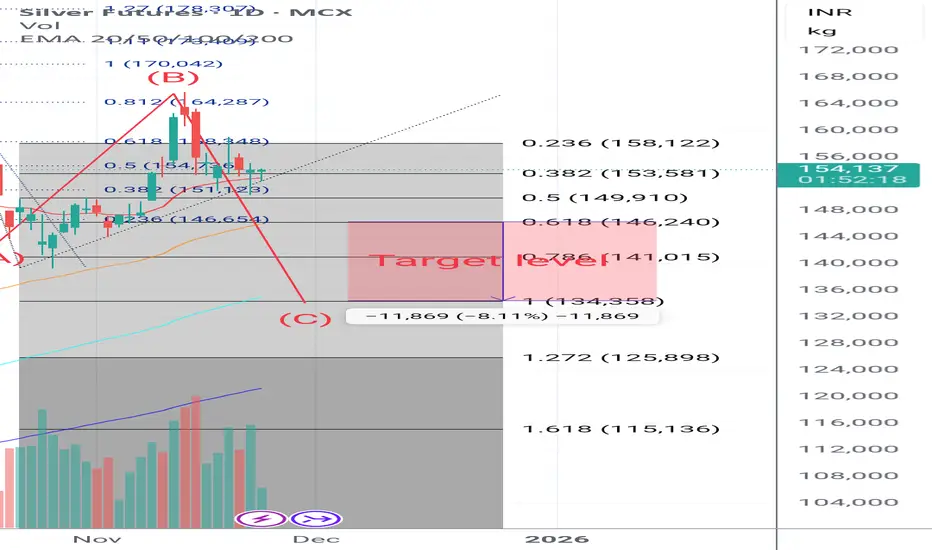
Silver forcast next few daysThis is just educational purpose only.
This chart tells silver is correction phase in flat correction wave A and B completed next to C wave in completion phase.
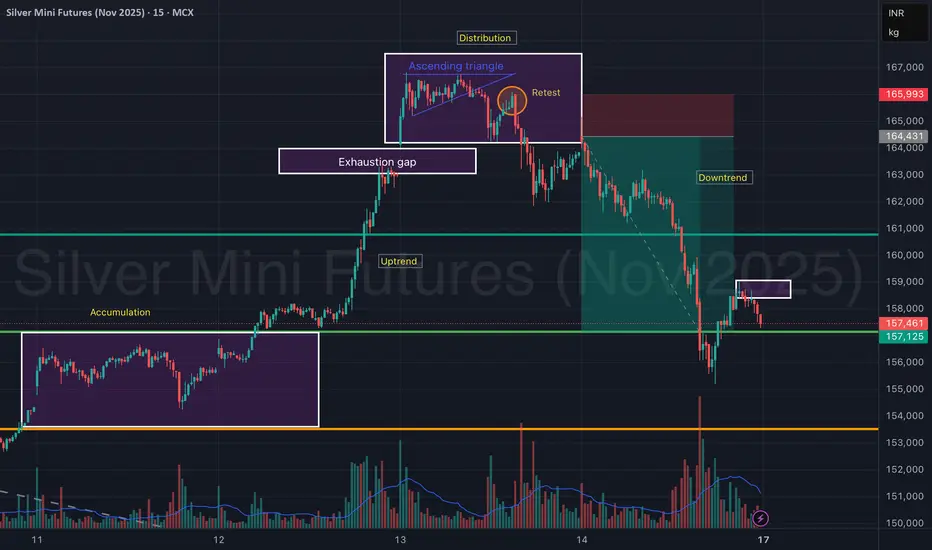
Silver Mini Futures (Nov 2025) – Accumulation to Distribution Silver Mini Futures on the 15-min chart clearly showcases a complete market cycle structure — transitioning from accumulation → uptrend → distribution → downtrend, providing an excellent study in price behavior and volume confirmation.
The move began with accumulation around ₹1,55,000, followed by a strong uptrend breakout, leading to a sharp rally. However, as price entered the ascending triangle near the ₹1,66,000 zone, momentum weakened, signaling distribution.
An exhaustion gap and a failed retest confirmed a reversal, leading to a steep downtrend, which remains active after a minor pullback.
📊 Phase Breakdown:
Accumulation Phase: ₹1,54,800 – ₹1,55,800
Sideways base formation with increasing volume at lows.
Uptrend Phase: Breakout above ₹1,56,000 triggered momentum.
Distribution Phase: Formed an ascending triangle with weak breakout follow-through.
Retest failure at ₹1,65,000 signaled exhaustion.
Downtrend Phase: Sharp decline with heavy volume, currently finding support near ₹1,57,000.
🎯 Key Technical Zones:
Resistance: ₹1,64,400 – ₹1,66,000 (supply zone)
Immediate Resistance (Retest Box): ₹1,58,200 – ₹1,58,800
Support Zone: ₹1,56,800 – ₹1,57,100
Major Support: ₹1,54,500
🧠 View:
Silver Mini Futures is currently in a downtrend continuation phase after a distribution top. A minor retest near ₹1,58,800 could invite short opportunities, while only a sustained move above ₹1,60,000 may signal trend reversal strength.
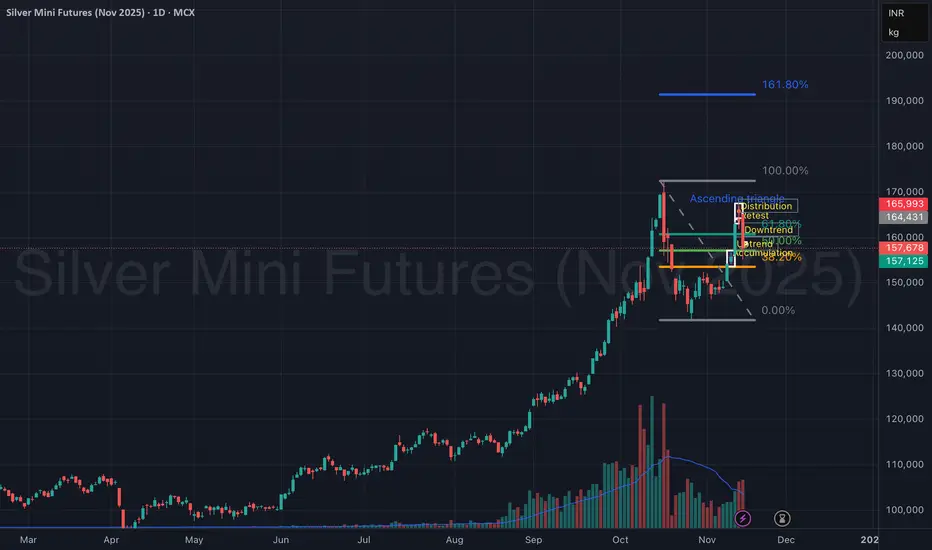
Silver Mini Futures (Nov 2025) – Accumulation to DistributionSilver Mini Futures on the 15-min chart clearly showcases a complete market cycle structure — transitioning from accumulation → uptrend → distribution → downtrend, providing an excellent study in price behavior and volume confirmation.
The move began with accumulation around ₹1,55,000, followed by a strong uptrend breakout, leading to a sharp rally. However, as price entered the ascending triangle near the ₹1,66,000 zone, momentum weakened, signaling distribution.
An exhaustion gap and a failed retest confirmed a reversal, leading to a steep downtrend, which remains active after a minor pullback.
📊 Phase Breakdown:
Accumulation Phase: ₹1,54,800 – ₹1,55,800
Sideways base formation with increasing volume at lows.
Uptrend Phase: Breakout above ₹1,56,000 triggered momentum.
Distribution Phase: Formed an ascending triangle with weak breakout follow-through.
Retest failure at ₹1,65,000 signaled exhaustion.
Downtrend Phase: Sharp decline with heavy volume, currently finding support near ₹1,57,000.
🎯 Key Technical Zones:
Resistance: ₹1,64,400 – ₹1,66,000 (supply zone)
Immediate Resistance (Retest Box): ₹1,58,200 – ₹1,58,800
Support Zone: ₹1,56,800 – ₹1,57,100
Major Support: ₹1,54,500
🧠 View:
Silver Mini Futures is currently in a downtrend continuation phase after a distribution top. A minor retest near ₹1,58,800 could invite short opportunities, while only a sustained move above ₹1,60,000 may signal trend reversal strength.
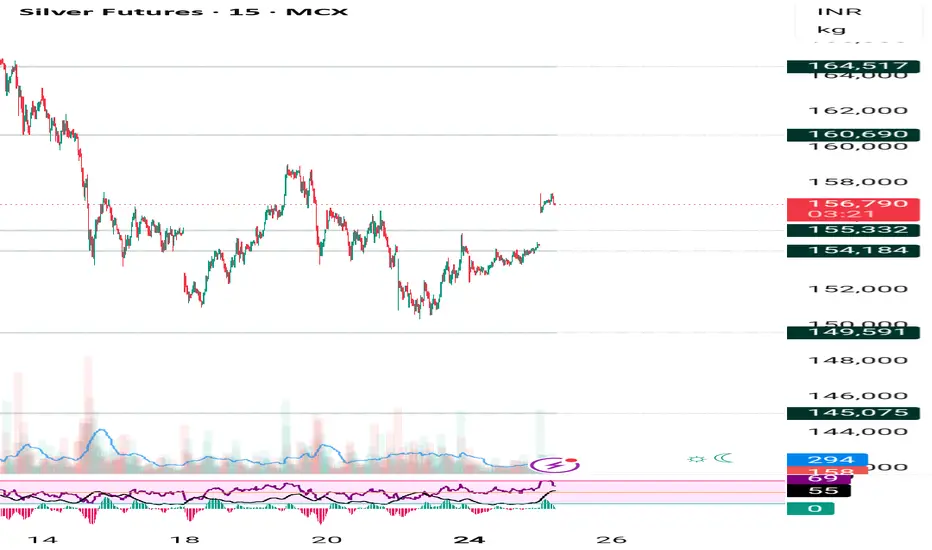
Silver hold buy trade for Monday upmove will continue 🔑 Key Highlights
- Price Action: Silver trading at ₹156,850, holding firm above ₹156,500.
- Trend: Active Long Build‑Up confirmed.
- Supports: ₹156,500 / ₹155,800 / ₹155,200.
- Resistances: ₹157,200 / ₹157,800 / ₹158,500.
- Bias: Bullish continuation if above ₹156,500; corrective pullback risk below ₹155,800.

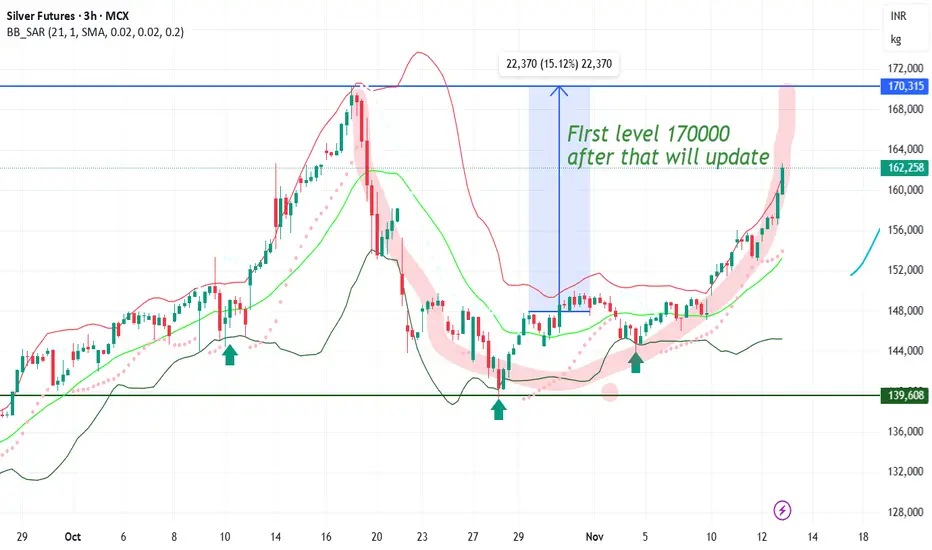
#SILVER FORMING NICE PATTERN #SILVER FORMING NICE PATTERN going to touch 170000 soon
formation like CUP and waiting for handle
after that 15% from high
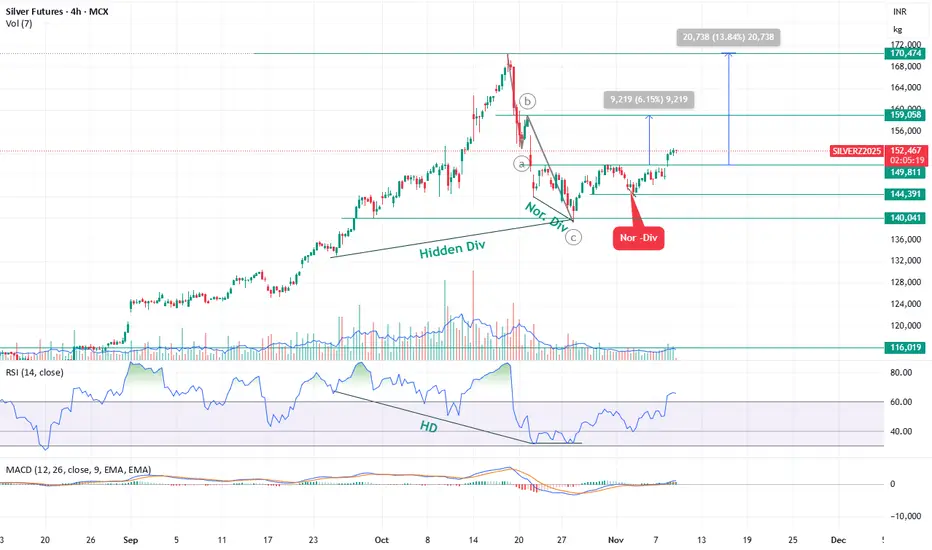
Bullish — Silver bounce expected toward ₹1,59,000 and ₹1,72,000 Silver Futures (SILVERZ2025 – 4H Chart) Technical Outlook
Elliott Wave Structure & Current Setup
Silver is currently trading in Wave 4, and the corrective phase appears to be complete.
Silver has completed its Wave 4 correction and has started a new impulsive leg (Wave 5).
A breakout above ₹1,50,000 has confirmed bullish momentum, supported by RSI and MACD signals.
📈 Upside Targets:
₹1,59,000 – first resistance / 6% upside
₹1,72,000 – extended target / 13.5% upside
⚙️ Supports:
₹1,49,000 – near breakout retest zone
₹1,44,000 – wave 4 base, invalidation below this level
Silver mcx upmove will continue AI tool showing 154700 SL 🔑 Key Highlights
- Price Action: Silver is holding firm above ₹156,500, showing strong bullish momentum.
- Trend: Long Build‑Up (Price↑ + OI↑), indicating accumulation by traders.
- Supports: ₹155,700 / ₹154,800 / ₹154,000.
- Resistances: ₹157,500 / ₹158,200 / ₹159,000.
- Bias: Bullish continuation if ₹155,700 holds; corrective pullback risk below ₹154,800.
Silver buy recommended on weekends 51.50 to 51.80 comex target Silver buy recommended on weekends , 51.50 to 51.80 comex target open .
🔑 Key Highlights (Locked Permanently)
- Supports/Resistances: 150,800 is the critical support; breach flips bias.
- Indicators: ADX >25, RSI 59, PCR 0.95 — all thresholds confirmed.
- Liquidity: Turnover ₹9,450 Cr, VWAP 152,300 — strong institutional activity.
- Volatility: IV 15.1%, RV 13.6% — both below 20% threshold.
- Sentiment: Fear/Greed Index 64 = bullish confirmation

Silver start buying on dip for next week 51.50 to 52 $ target Silver mcx start buying on dip for next week levels given on chart
How My Harmonic pattern projection Indicator work is explained below :
Recent High or Low :
D-0% is our recent low or high
Profit booking zone ( Early / Risky entry) : D 13.2% -D 16.1 % is
range if break them profit booking start on uptrend or downtrend but only profit booking, trend not changed
SL reversal zone (Safe entry ) : SL 23.1% and SL 25.5% is reversal zone if break then trend reverse and we can take reverse trade
Target : T1, T2, T3, T4 and .
Are our Target zone
Any Upside or downside level will activate only if break 1st level then 2nd will be active if break 2nd then 3rd will be active.
Total we have 7 important level which are support and resistance area
Until , 16% not break uptrend will continue if break then profit booking will start.
If break 25% then fresh downtrend will start then T1, T2,T3 will activate
1,3,5,10,15,20 minutes are short term levels.
30 minutes 60 minutes , 2 hours,3 hours, ... 1 day and 1 week chart positional and long term levels

Part 8 Trading Master ClassOption Pricing
Option prices depend on several factors, collectively described by the Black-Scholes model. The main components are:
Underlying price: The current price of the stock or index.
Strike price: Determines whether the option is ITM, ATM, or OTM.
Time to expiration: Longer duration means higher premium, as there’s more time for the market to move favorably.
Volatility: Higher volatility increases premium since price movements are more unpredictable.
Interest rates and dividends: These have smaller effects but are still part of option pricing.
The relationship between these factors is known as the “Greeks.”

Silver sell on rise recent low 140k re test possible Silver sell on rise 140k will be re tested
How My Harmonic pattern projection Indicator work is explained below :
Recent High or Low :
D-0% is our recent low or high
Profit booking zone ( Early / Risky entry) : D 13.2% -D 16.1 % is
range if break them profit booking start on uptrend or downtrend but only profit booking, trend not changed
SL reversal zone (Safe entry ) : SL 23.1% and SL 25.5% is reversal zone if break then trend reverse and we can take reverse trade
Target : T1, T2, T3, T4 and .
Are our Target zone
Any Upside or downside level will activate only if break 1st level then 2nd will be active if break 2nd then 3rd will be active.
Total we have 7 important level which are support and resistance area
Until , 16% not break uptrend will continue if break then profit booking will start.
If break 25% then fresh downtrend will start then T1, T2,T3 will activate
1,3,5,10,15,20 minutes are short term levels.
30 minutes 60 minutes , 2 hours,3 hours, ... 1 day and 1 week chart positional and long term levels