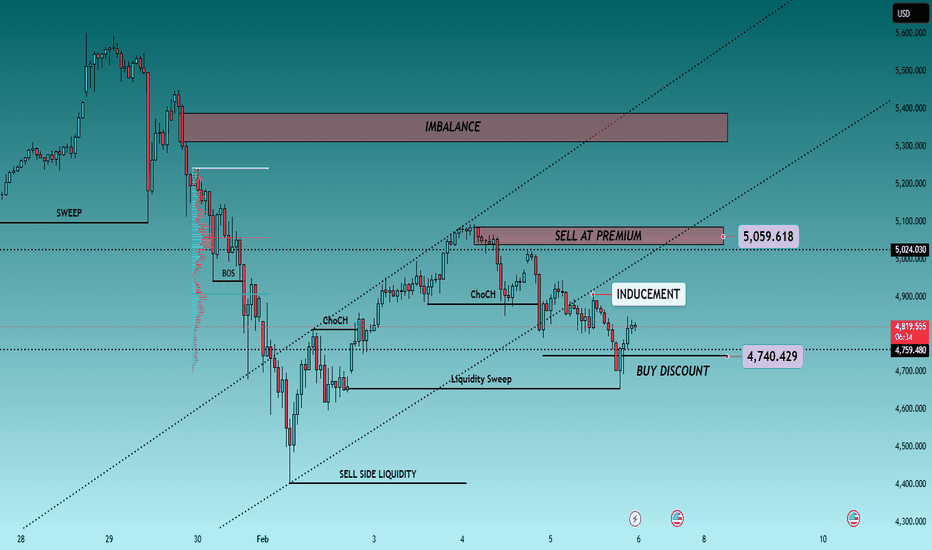
Gold Spot / U.S. Dollar
No trades
About Gold Spot / U.S. Dollar
Gold price is widely followed in financial markets around the world. Gold was the basis of economic capitalism for hundreds of years until the repeal of the Gold standard, which led to the expansion of a flat currency system in which paper money doesn't have an implied backing with any physical form of monetization. AU is the code for Gold on the Periodic table of elements, and the price above is Gold quoted in US Dollars, which is the common yardstick for measuring the value of Gold across the world.
XAUUSD/GOLD 1H SELL LIMIT PROJECTION 06.02.26XAUUSD – 1H Sell Limit Projection | 06.02.26
“In this one-hour XAUUSD analysis, gold is currently moving within a broader corrective structure after a strong bearish impulse.
Price is approaching a key descending trendline, where we can also observe a double top formation developing near the resis
Bearish Rejection From Supply, Targets Below
Market Structure
Price previously made a blow-off top (sharp impulsive high, marked by the red arrow), followed by a strong bearish reversal, breaking short-term structure.
The subsequent bounce formed a lower high, confirming a bearish market structure shift on the intraday timeframe.
Key Zones
Gold PA Scalping FrameworkScanning XAUUSD to filter high-quality trade setups. No trades are forced—only structure-based opportunities.
Note: There may be a delay in this video due to upload processing time.
Disclaimer: FX trading involves high leverage and substantial risk, and losses can exceed your initial investment. Th
XAUUSD / GOLD – 1H SELL PROJECTION (05-02-2026)
Gold was moving inside a rising channel, respecting the uptrend line.
However, price failed to sustain bullish momentum and clearly broke the uptrend, indicating a market structure shift.
After the breakdown:
Price retraced back into a Fair Value Gap (FVG)
The retracement got rejected near Resi
GOLD INTRADAY LEVELS 📉 PRIMARY SETUP: SELL ON RISE (preferred)
✅ Entry
Sell zone: 4830 – 4860
Or sell on rejection candle in this zone
🎯 Targets
T1: 4765
T2: 4700
T3: 4655 (recent low)
🛑 Stop Loss
SL: 4920 (15-min close)
🟢 ALTERNATE SETUP: BUY ONLY IF REVERSAL CONFIRMS
✅ Condition
15-min close above 4920
Follo
Gold Trades the Extremes as News Fuels Liquidity Games🟡 XAUUSD – Intraday Smart Money Plan (H1)
📈 Market Context
Gold remains highly sensitive today as markets react to President Trump’s announcement, keeping USD flows unstable and risk sentiment mixed. This environment favors liquidity engineering, not trend chasing. Institutions are exploiting news
XAUUSD (H2) – Liam ViewXAUUSD (H2) – Liam View
USD strength continues to limit gold | Sell-side structure still active
Quick summary
Gold remains under pressure on the H2 timeframe as a firm US Dollar keeps weighing on precious metals. The recent rebound looks corrective and lacks solid acceptance above supply. With mark
Gold at a Make-or-Break Harmonic ZoneGold is approaching a critical harmonic completion area, where price action, Fibonacci geometry, and momentum structure are converging. This setup demands attention.
🧠 Market Structure Snapshot
Price has completed a well-defined X–A–B–C structure
The market is currently progressing through
See all ideas
Summarizing what the indicators are suggesting.
Oscillators
Neutral
SellBuy
Strong sellStrong buy
Strong sellSellNeutralBuyStrong buy
Oscillators
Neutral
SellBuy
Strong sellStrong buy
Strong sellSellNeutralBuyStrong buy
Summary
Neutral
SellBuy
Strong sellStrong buy
Strong sellSellNeutralBuyStrong buy
Summary
Neutral
SellBuy
Strong sellStrong buy
Strong sellSellNeutralBuyStrong buy
Summary
Neutral
SellBuy
Strong sellStrong buy
Strong sellSellNeutralBuyStrong buy
Moving Averages
Neutral
SellBuy
Strong sellStrong buy
Strong sellSellNeutralBuyStrong buy
Moving Averages
Neutral
SellBuy
Strong sellStrong buy
Strong sellSellNeutralBuyStrong buy
Displays a symbol's price movements over previous years to identify recurring trends.


