DOGEUSDT Market Report – From Correction to ExpansionDOGEUSDT has completed an impulsive upward cycle, followed by a controlled corrective structure. The earlier surge reflected aggressive positioning from buyers, while the subsequent retracement highlights the market’s need to neutralize inefficiencies and rebalance liquidity.
Price action now refle

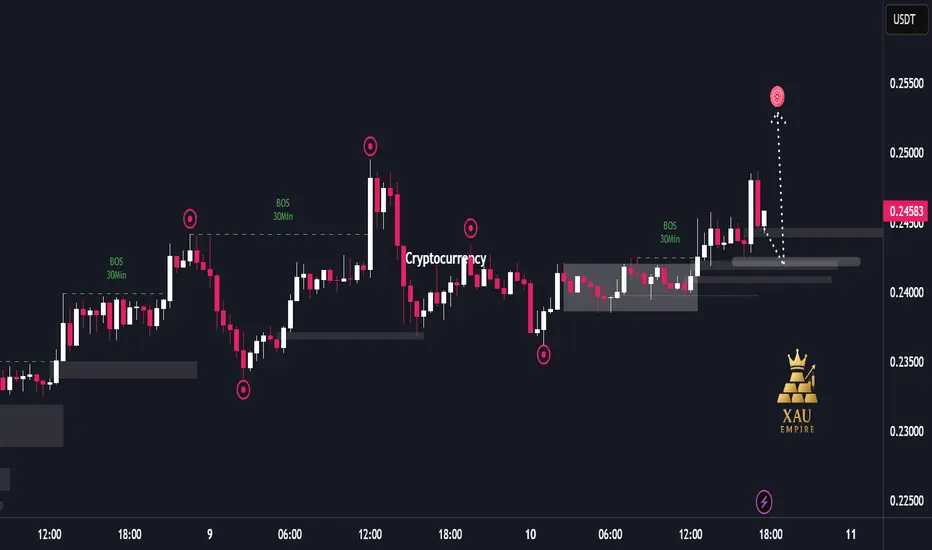
Institutional Flow Driving DOGE Upside Liquidity Hunt📊 Report-Based Analysis
Market Structure:
The chart shows multiple “Break of Structure (BOS)” events, indicating that institutional orders are driving the market direction. Frequent upside BOS suggests that the bullish trend is currently dominant.
Liquidity Movements:
Price has repeatedly hunted l
Will Dogecoin hit $2 in Coming rally ?DOGE/USDT – Technical Analysis Update
CRYPTOCAP:DOGE is maintaining a solid structural support above the $0.150 key demand zone, with price action showing consistent defense of this level. As long as this zone remains protected on higher timeframes, bullish market structure remains intact for the

Clear W Pattern in DogecoinDogecoin is making W Pattern in Weekly time frame💰💰
SL😓, Target🎯 and Entry😁 Points are Mentioned in chart.
After completion of W Pattern, the Coin is Likely to make a big Cup and Handle Pattern too😱😱
Note: This analysis is for Educational Purpose Only. Please invest after consulting a professiona

DOGE/USD NOT BEARSIH , ITS JUST RETESTING ,STILL BULLISHDOGE IS A VERY STRONG MEME COIN , AFTER A STRONG BULL RUN ITS JUST RE-TESTING HERE
SOME PREDICTIONS FOR NEXT WEEK :
Bull Case: Break above $0.29 THEN $0.4
Base Case: Consolidation around $0.25 – $0.29
Bear Case: Drop toward $0.22 – $0.23
this coin have just retested and now want to fly to m

DOGE Long Swing Setup – Institutional Narrative Heating UpThe Dogecoin narrative is back in focus! Bit Origin ( NASDAQ:BTOG ) is raising $500M to build one of the world’s largest DOGE treasuries—becoming the first U.S.-listed company to treat CRYPTOCAP:DOGE as a core asset. With institutional interest rising, DOGE could see renewed momentum. Our last tra

$DOGE 1Hr Elliott Wave Outlook
#DOGE is currently forming the 5th impulse wave on the hourly chart, indicating a potential bullish continuation.
Completed Waves (1), (2), (3), and (4).
Now Wave (5) is in progress.
Potential move towards -
1.0 Fib : $0.2246
1.618 Fib : $0.2448
Bullish Confirmation - Sustained breakout a

DTF H&S DOGE Ah, the classic Head and Shoulders—and I’m guessing you’re not talking about shampoo this time 😄
In trading, the Head and Shoulders pattern is a powerful reversal signal. It typically forms at the end of an uptrend and suggests a potential shift to a downtrend. Here's how it breaks down:
- Left Shou

DOGE COIN he double bottom is a classic bullish reversal pattern in technical analysis. It resembles the letter "W", forming after a downtrend when the price hits a support level twice before breaking out upwards.
Key Features:
- Two distinct lows at roughly the same price level.
- A peak (neckline) between t

130 UPSDIE MOVE $$$$It looks like you meant Fibonacci Retracement, a popular tool in technical analysis used to identify potential support and resistance levels based on the Fibonacci sequence. Traders use key retracement levels—23.6%, 38.2%, 50%, 61.8%, and 100%—to anticipate price corrections within a trend.

See all ideas
Summarizing what the indicators are suggesting.
Oscillators
Neutral
SellBuy
Strong sellStrong buy
Strong sellSellNeutralBuyStrong buy
Oscillators
Neutral
SellBuy
Strong sellStrong buy
Strong sellSellNeutralBuyStrong buy
Summary
Neutral
SellBuy
Strong sellStrong buy
Strong sellSellNeutralBuyStrong buy
Summary
Neutral
SellBuy
Strong sellStrong buy
Strong sellSellNeutralBuyStrong buy
Summary
Neutral
SellBuy
Strong sellStrong buy
Strong sellSellNeutralBuyStrong buy
Moving Averages
Neutral
SellBuy
Strong sellStrong buy
Strong sellSellNeutralBuyStrong buy
Moving Averages
Neutral
SellBuy
Strong sellStrong buy
Strong sellSellNeutralBuyStrong buy
Displays a symbol's price movements over previous years to identify recurring trends.