Is Polkadot (DOT) Dead or Ready for a Comeback? Full Update 2025Polkadot was one of the strongest performers of the last cycle. After launching near 2.70 dollars in August 2020, it rallied to an all-time high of $55 in November 2021. That marked a nearly 1,900% gain in just over a year.
However, fast forward to mid-2025, and CRYPTOCAP:DOT is now trading back
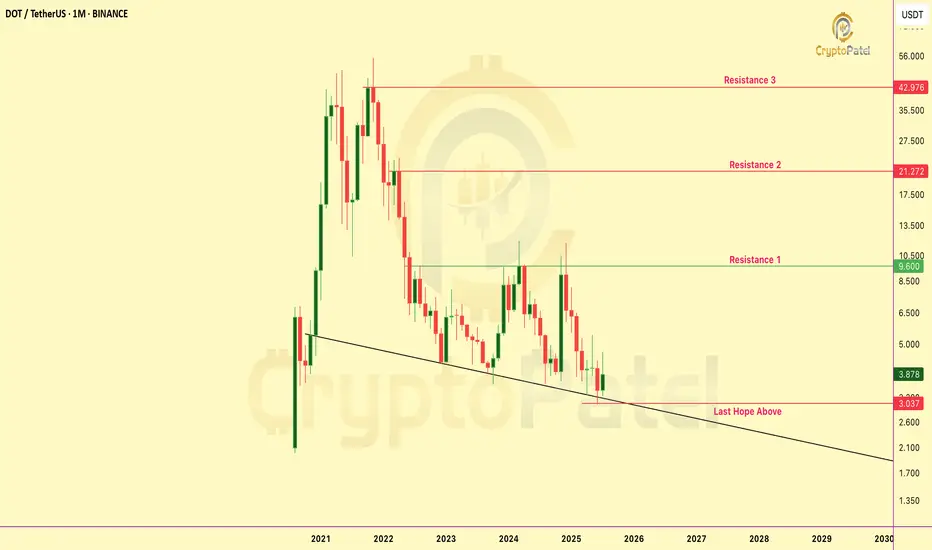
Will Polkadot Hit $50 Again ?Polkadot Looks Ready to Explode — $3 Might Be the Bottom, and $30+ Could Be Next
DOT is consolidating in the $4–$3 Accumulation Zone, right at the retest of a multi-year trendline breakout.
🔹 IMO: Best accumulation range = $4.00–$3.00
🔹 Holding this zone could trigger a macro reversal
🔹 HTF struct

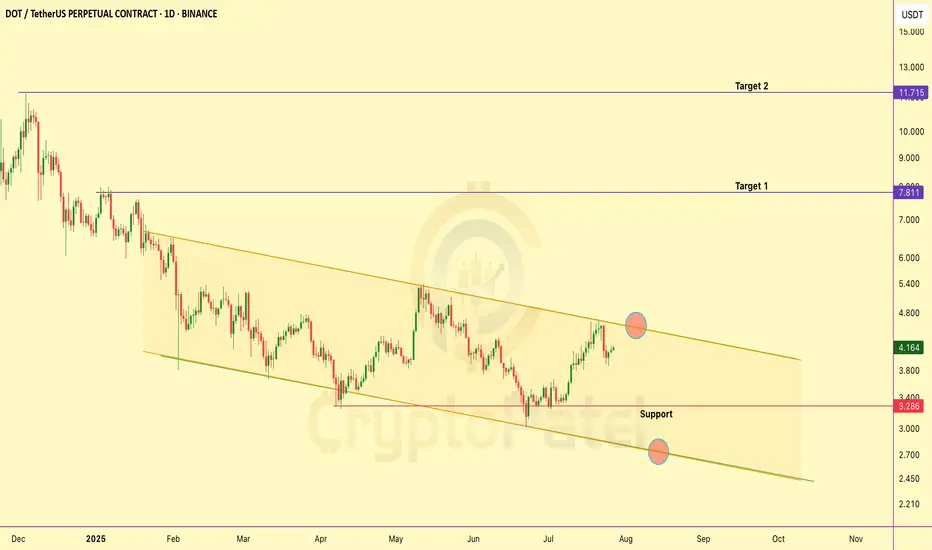
Polkadot is at $4.60 — breakout or last chance to buy?Polkadot is trading just under a key resistance at $4.60 — a level it’s failed to break several times in the past.
If it finally breaks above this, we could see a strong rally toward $8 and maybe even $12 in the coming weeks.
But if it gets rejected again, the price might drop back to the $3.30–$2
$DOT 4hr Chart – Elliott Wave & Fib Outlook
Wave count shows a clean 5-wave impulse completed at $4.196 (Wave 5 top), with current movement forming an ABC corrective structure. We are likely in Wave (a) of the correction, now eyeing a bounce for Wave (b).
🔹 Key Fib Levels for (b) Rebound:
0.382: $3.995
0.5: $4.033
0.618: $4.071
The

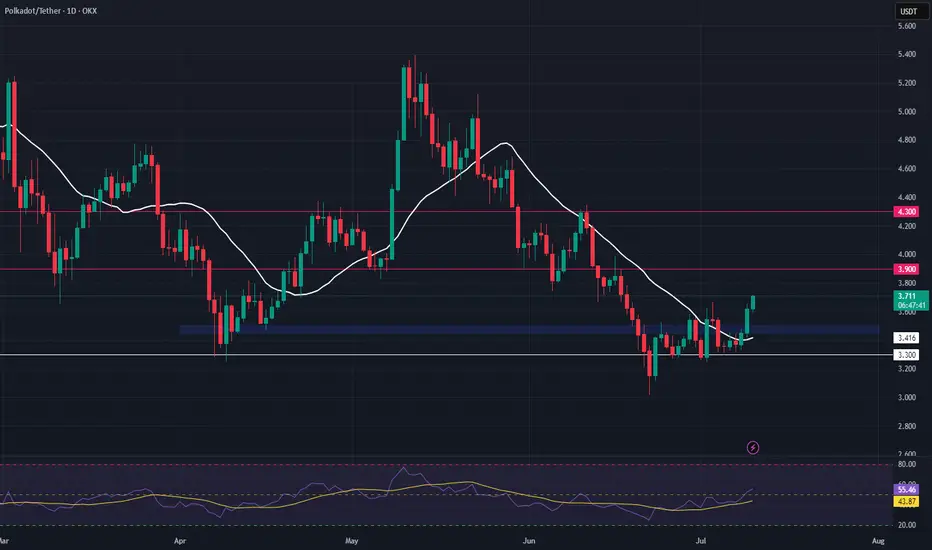
DOT Long Swing Setup – Structural Recovery with Support RetestDOT is showing early signs of recovery, reclaiming its 20-day SMA and flipping key horizontal resistance into support. We’re now watching for a retest of the $3.45–$3.50 zone to confirm the level and trigger a long entry.
📌 Trade Setup:
• Entry Zone: $3.45 – $3.50
• Take Profit Targets:
o 🥇 $3.90
Will PolkaDot Hit $50 in near Future?Where is the #POLKADOT Army?
CRYPTOCAP:DOT is in a key accumulation zone between $4.50–$3.50, a historic demand area before major moves.
➡️ Many lost patience, but smart money builds positions here.
➡️ If market cycles repeat, a return to $50 isn’t out of reach.

Polkadot (DOT) at Critical Support – What’s Next?Polkadot (DOT) at Critical Support – What’s Next?
📉 DOT is trading near strong support at $3.80–$3.60. If this level holds, we could see an upward move.
⚠️ Risk of liquidity grab: Price may dip below support to liquidate high-leverage positions before bouncing.
💡 Buy Strategy: Consider small entrie

Dot possible move Dot possible move to up side and one by one achieve target because btc dominance breaks down side

DOT/USDT 500% Potential: will it Hit New ATH ?#Polkadot ( CRYPTOCAP:DOT ) Bullish Chart Analysis
🔹 Performance: In just 25 days, DOT has surged 180%, showing strong bullish momentum.
🔹 Entry Strategy: Price is settling—look for the best entry zone for potential gains.
Best Entry Zone: $7.80 - $6.50 (Key FVG area).
Targets: $16 / $23 / $32 / $

DOTUSDT: Ready for a Big Breakout or Sudden Drop?Yello Paradisers! Is DOTUSDT about to make a breakout move that will catch traders by surprise? Let’s break down what the charts are saying right now 👇
💎DOTUSDT is shaping up an intriguing pattern with an inducement and the formation of a descending triangle, which suggests a potential bullish brea

See all ideas
Summarizing what the indicators are suggesting.
Oscillators
Neutral
SellBuy
Strong sellStrong buy
Strong sellSellNeutralBuyStrong buy
Oscillators
Neutral
SellBuy
Strong sellStrong buy
Strong sellSellNeutralBuyStrong buy
Summary
Neutral
SellBuy
Strong sellStrong buy
Strong sellSellNeutralBuyStrong buy
Summary
Neutral
SellBuy
Strong sellStrong buy
Strong sellSellNeutralBuyStrong buy
Summary
Neutral
SellBuy
Strong sellStrong buy
Strong sellSellNeutralBuyStrong buy
Moving Averages
Neutral
SellBuy
Strong sellStrong buy
Strong sellSellNeutralBuyStrong buy
Moving Averages
Neutral
SellBuy
Strong sellStrong buy
Strong sellSellNeutralBuyStrong buy
Displays a symbol's price movements over previous years to identify recurring trends.