DOT / USDT (1D Timeframe)Pattern: CHOCH Reversal + Demand Zone Rejection Setup
The chart shows DOT reacting strongly inside a major daily demand zone, where price has printed multiple long-wick rejections, indicating buyers stepping in aggressively. A clear CHOCH has formed, confirming early signs of a potential trend reve
Related pairs

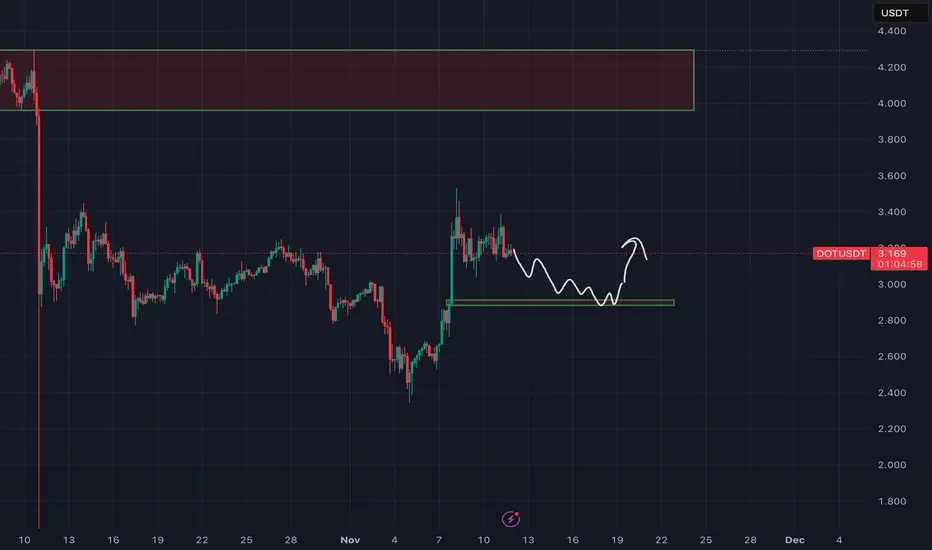
DOT usdt pair analysis here's my analysis for dot/usdt . I feel like bottom is near for now it will go for a retouch and then a bounce to a good level can be seen. probability is with the bulls so have a tight watch at the marked level.
DOTUSDT_Short Elliot WaveI'm anticipating DOT to move toward the $3 level, so a potential short position could be considered around $3.30. Make sure to do your own research before taking any trade.

Best area off value for selling ofter some selling price actionBest area off value for selling ofter some selling

Is Polkadot (DOT) Dead or Ready for a Comeback? Full Update 2025Polkadot was one of the strongest performers of the last cycle. After launching near 2.70 dollars in August 2020, it rallied to an all-time high of $55 in November 2021. That marked a nearly 1,900% gain in just over a year.
However, fast forward to mid-2025, and CRYPTOCAP:DOT is now trading back
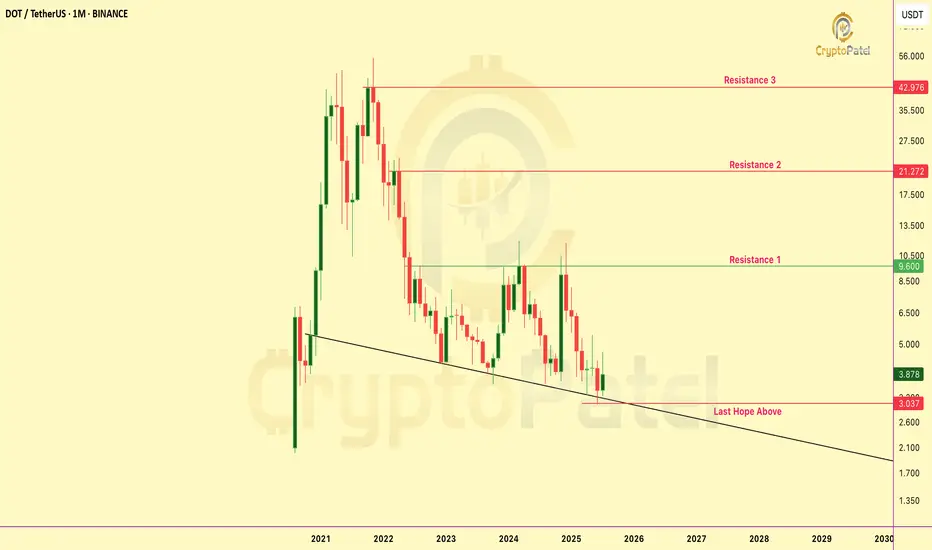
Will Polkadot Hit $50 Again ?Polkadot Looks Ready to Explode — $3 Might Be the Bottom, and $30+ Could Be Next
DOT is consolidating in the $4–$3 Accumulation Zone, right at the retest of a multi-year trendline breakout.
🔹 IMO: Best accumulation range = $4.00–$3.00
🔹 Holding this zone could trigger a macro reversal
🔹 HTF struct

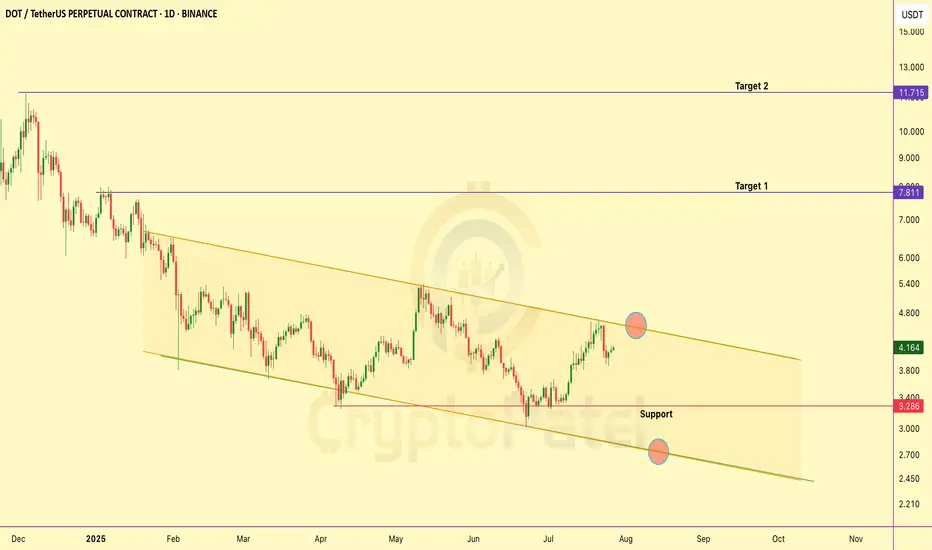
Polkadot is at $4.60 — breakout or last chance to buy?Polkadot is trading just under a key resistance at $4.60 — a level it’s failed to break several times in the past.
If it finally breaks above this, we could see a strong rally toward $8 and maybe even $12 in the coming weeks.
But if it gets rejected again, the price might drop back to the $3.30–$2
$DOT 4hr Chart – Elliott Wave & Fib Outlook
Wave count shows a clean 5-wave impulse completed at $4.196 (Wave 5 top), with current movement forming an ABC corrective structure. We are likely in Wave (a) of the correction, now eyeing a bounce for Wave (b).
🔹 Key Fib Levels for (b) Rebound:
0.382: $3.995
0.5: $4.033
0.618: $4.071
The

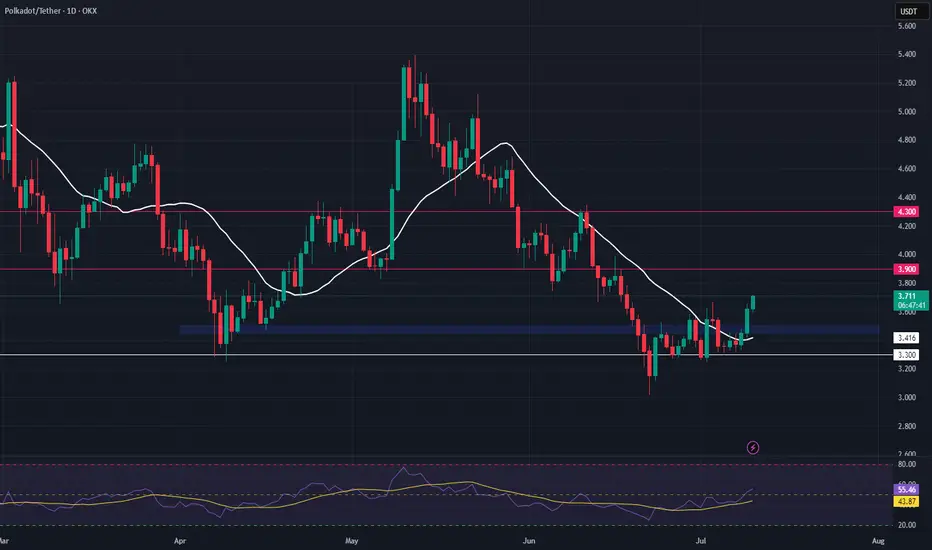
DOT Long Swing Setup – Structural Recovery with Support RetestDOT is showing early signs of recovery, reclaiming its 20-day SMA and flipping key horizontal resistance into support. We’re now watching for a retest of the $3.45–$3.50 zone to confirm the level and trigger a long entry.
📌 Trade Setup:
• Entry Zone: $3.45 – $3.50
• Take Profit Targets:
o 🥇 $3.90
Will PolkaDot Hit $50 in near Future?Where is the #POLKADOT Army?
CRYPTOCAP:DOT is in a key accumulation zone between $4.50–$3.50, a historic demand area before major moves.
➡️ Many lost patience, but smart money builds positions here.
➡️ If market cycles repeat, a return to $50 isn’t out of reach.

See all ideas
Summarizing what the indicators are suggesting.
Oscillators
Neutral
SellBuy
Strong sellStrong buy
Strong sellSellNeutralBuyStrong buy
Oscillators
Neutral
SellBuy
Strong sellStrong buy
Strong sellSellNeutralBuyStrong buy
Summary
Neutral
SellBuy
Strong sellStrong buy
Strong sellSellNeutralBuyStrong buy
Summary
Neutral
SellBuy
Strong sellStrong buy
Strong sellSellNeutralBuyStrong buy
Summary
Neutral
SellBuy
Strong sellStrong buy
Strong sellSellNeutralBuyStrong buy
Moving Averages
Neutral
SellBuy
Strong sellStrong buy
Strong sellSellNeutralBuyStrong buy
Moving Averages
Neutral
SellBuy
Strong sellStrong buy
Strong sellSellNeutralBuyStrong buy
Displays a symbol's price movements over previous years to identify recurring trends.
Frequently Asked Questions
The current price of DOT / UST (DOT) is 1.67890000 USDT — it has fallen −6.54% in the past 24 hours. Try placing this info into the context by checking out what coins are also gaining and losing at the moment and seeing DOT price chart.
DOT / UST price has fallen by −11.01% over the last week, its month performance shows a −4.71% decrease, and as for the last year, DOT / UST has decreased by −70.91%. See more dynamics on DOT price chart.
Keep track of coins' changes with our Crypto Coins Heatmap.
Keep track of coins' changes with our Crypto Coins Heatmap.
DOT / UST (DOT) reached its highest price on Aug 18, 2020 — it amounted to 349.00000000 USDT. Find more insights on the DOT price chart.
See the list of crypto gainers and choose what best fits your strategy.
See the list of crypto gainers and choose what best fits your strategy.
DOT / UST (DOT) reached the lowest price of 0.11000000 USDT on Oct 10, 2025. View more DOT / UST dynamics on the price chart.
See the list of crypto losers to find unexpected opportunities.
See the list of crypto losers to find unexpected opportunities.
The safest choice when buying DOT is to go to a well-known crypto exchange. Some of the popular names are Binance, Coinbase, Kraken. But you'll have to find a reliable broker and create an account first. You can trade DOT right from TradingView charts — just choose a broker and connect to your account.
Crypto markets are famous for their volatility, so one should study all the available stats before adding crypto assets to their portfolio. Very often it's technical analysis that comes in handy. We prepared technical ratings for DOT / UST (DOT): today its technical analysis shows the strong sell signal, and according to the 1 week rating DOT shows the strong sell signal. And you'd better dig deeper and study 1 month rating too — it's sell. Find inspiration in DOT / UST trading ideas and keep track of what's moving crypto markets with our crypto news feed.
DOT / UST (DOT) is just as reliable as any other crypto asset — this corner of the world market is highly volatile. Today, for instance, DOT / UST is estimated as 5.11% volatile. The only thing it means is that you must prepare and examine all available information before making a decision. And if you're not sure about DOT / UST, you can find more inspiration in our curated watchlists.
You can discuss DOT / UST (DOT) with other users in our public chats, Minds or in the comments to Ideas.