Turtle soupHere, it can be a classical turtle soup strategy. It was in a strong downtrend, then started retracing towards the 200 EMA. Now, as soon as it reached the 200 EMA, it gained high volumes, swept all past liquidity, and bounced downward from a bearish order block. After this liquidity sweep, we can en
Compare with ENA/USDT
$ENA Could Be Setting Up For A 20x Move… MIL:ENA Could Be Setting Up For A 20x Move… This One Level Changes Everything
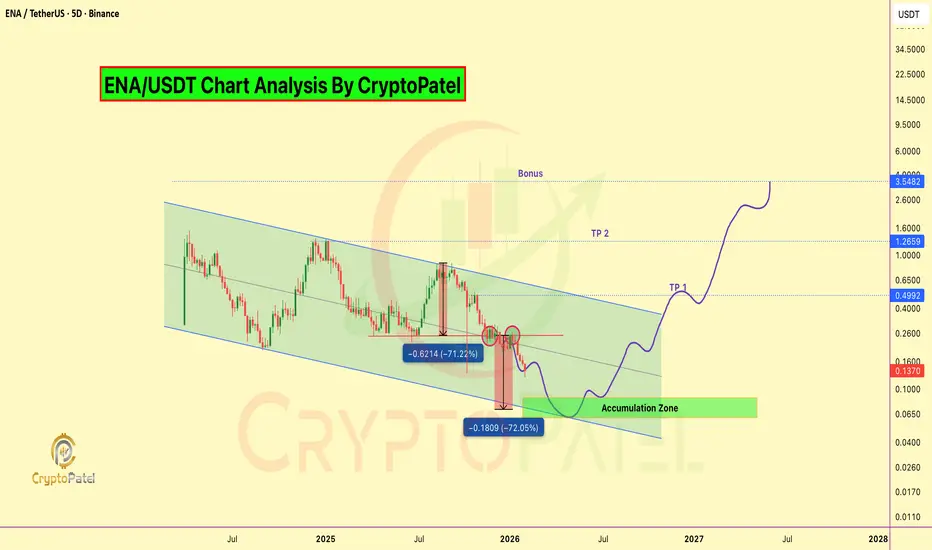
#ENA Has Completed Two Nearly Identical -73% Distribution Legs, Swept ATL Liquidity, And Built A 5-Month HTF Accumulation Base. Structure Is Improving, But Confirmation Is Still Needed.
Technical Structure
✅ 20-Month C
$ENA had a strong push toward 0.131, then faced heavy rejection MIL:ENA had a strong push toward 0.131, then faced heavy rejection and dropped into a consolidation box.
Now price has reacted three times around the 0.118–0.119 zone.
Support: 0.118–0.119
Resistance: 0.123–0.125
🔺 If 0.125 breaks and holds with volume:
• Quick move toward 0.128
• Then retest of
$ENA bounced hard from the 0.10 and is now consolidating in 1hrMIL:ENA bounced hard from the 0.10 base and is now consolidating inside a bullish flag on the 1H chart. This structure usually forms when sellers are exhausted and price pauses before the next leg. Importantly, this is price compression after expansion, not a weak sideways drift.
Within the flag,
From $6 to $0.10 – The $5 Comeback Story Nobody's Talking About MIL:ENA : From $6 to $0.10 – The $5 Comeback Story Nobody's Talking About Yet
As Predicted, Price dumped 60% after breaking down from $0.24 support, now sitting at $0.10.
Current Status:
✅ $0.08–$0.10 = Prime accumulation zone activated
⚠️ Still possible dip to $0.06 (best long-term entry if it hi
$ENA is currently trading inside a rising wedge on the 1H chart MIL:ENA is currently trading inside a rising wedge on the 1H chart after a sharp sell-off and V-shaped recovery from the 0.1215 low. Price has stabilized and is now printing higher lows, showing short-term buyer presence — but the structure itself demands caution.
A rising wedge after a strong dro
$100M Private Sale at $0.40... Now CMP Trading at $0.135$100M Private Sale at $0.40... Now Retail Can Buy at $0.135. First Time Retail Gets Better Entry Than VC
#ENA Is Trading Inside A Long-Term Descending Channel On The HTF Chart Since 2024.
Price Has Completed A Deep Multi-Leg Correction And Is Now Testing A Major Demand Zone At Channel Support.
Cu
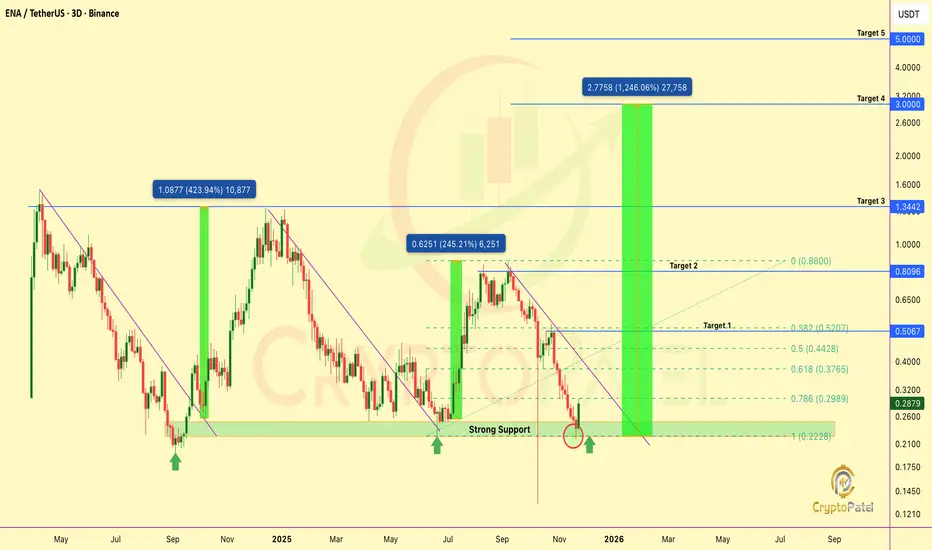
$ENA Technical Outlook: Major Reversal Signal TriggeredMIL:ENA Technical Outlook: Major Reversal Signal Triggered
ENA has cleanly rebounded from its structural support at $0.24–$0.22, a zone that has historically defined trend inflection. As long as price holds above this base, the bullish probability sharply increases, with a potential multi-fold exp
See all ideas
Summarizing what the indicators are suggesting.
Oscillators
Neutral
Oscillators
Neutral
Summary
Neutral
Summary
Neutral
Summary
Neutral
Moving Averages
Neutral
Moving Averages
Neutral
Displays a symbol's price movements over previous years to identify recurring trends.
Frequently asked questions
The current price of ENA / USDT Spot Trading Pair (ENA) is 0.2052 USDT — it has risen 1.99% in the past 24 hours. Try placing this info into the context by checking out what coins are also gaining and losing at the moment and seeing ENA price chart.
ENA / USDT Spot Trading Pair price has fallen by −11.86% over the last week, its month performance shows a 39.30% increase, and as for the last year, ENA / USDT Spot Trading Pair has decreased by −52.97%. See more dynamics on ENA price chart.
Keep track of coins' changes with our Crypto Coins Heatmap.
ENA / USDT Spot Trading Pair (ENA) reached its highest price on Apr 11, 2024 — it amounted to 1.5270 USDT. Find more insights on the ENA price chart.
See the list of crypto gainers and choose what best fits your strategy.
ENA / USDT Spot Trading Pair (ENA) reached the lowest price of 0.0702 USDT on Jun 10, 2026. View more ENA / USDT Spot Trading Pair dynamics on the price chart.
See the list of crypto losers to find unexpected opportunities.
The safest choice when buying ENA is to go to a well-known crypto exchange. Some of the popular names are Binance, Coinbase, Kraken. But you'll have to find a reliable broker and create an account first. You can trade ENA right from TradingView charts — just choose a broker and connect to your account.
Crypto markets are famous for their volatility, so one should study all the available stats before adding crypto assets to their portfolio. Very often it's technical analysis that comes in handy. We prepared technical ratings for ENA / USDT Spot Trading Pair (ENA): today its technical analysis shows the neutral signal, and according to the 1 week rating ENA shows the buy signal. And you'd better dig deeper and study 1 month rating too — it's sell. Find inspiration in ENA / USDT Spot Trading Pair trading ideas and keep track of what's moving crypto markets with our crypto news feed.
ENA / USDT Spot Trading Pair (ENA) is just as reliable as any other crypto asset — this corner of the world market is highly volatile. Today, for instance, ENA / USDT Spot Trading Pair is estimated as 13.53% volatile. The only thing it means is that you must prepare and examine all available information before making a decision.
You can discuss ENA / USDT Spot Trading Pair (ENA) with other users in our public chats, Minds or in the comments to Ideas.