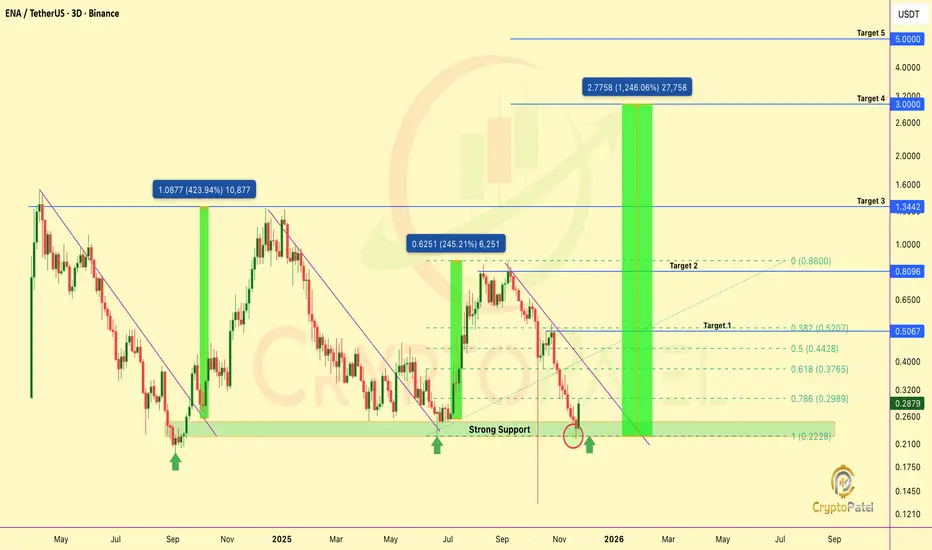
$ENA Technical Outlook: Major Reversal Signal TriggeredMIL:ENA Technical Outlook: Major Reversal Signal Triggered
ENA has cleanly rebounded from its structural support at $0.24–$0.22, a zone that has historically defined trend inflection. As long as price holds above this base, the bullish probability sharply increases, with a potential multi-fold exp
Related pairs
ENA - ShortENA ran almost 150% from the lows.
Now its turning bearish again on 4 Hr timeframe. price has broken below 200 period MA and on a retest of 21 MA and 200 MA a good short opportunity will arise. its a good RR. Lets see how price reacts after interact with 21 MA.

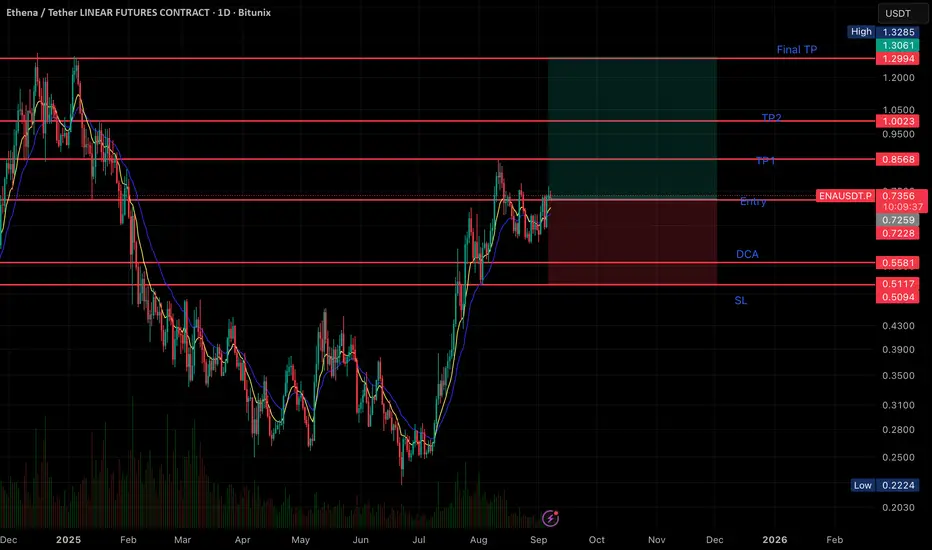
ENA Long Set Up swing or spot only🔹 Chart Setup
• Current Price: 0.7341 USDT
• Trend: Price has been recovering strongly after a bottom in June and is consolidating around the entry zone.
🔹 Key Levels
• Entry Zone: ~0.7341 USDT (current price is at entry).
• DCA (Dollar-Cost Average) Levels:
• 0.7229
• 0.6580
• 0.6082
• 0.5
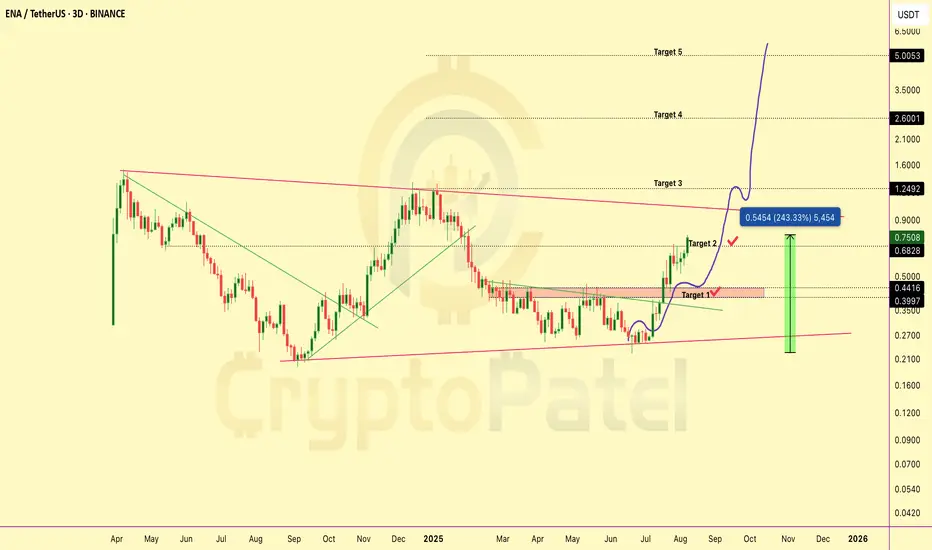
$ENA Up 243% From My $0.25 Entry And I’m Still BullishMIL:ENA Up 243% From My $0.25 Entry And I’m Still Bullish
Now MIL:ENA is trading at $0.75 and up 243% from our $0.25 entry ✅
TP1 and TP2 hit ✅ and I’m still super bullish, eyeing $1 / $2 / $5 next.
But remember, Greed has no limits.
Smart traders book partial profits and ride the rest with hous
ETHENA/USDT – 4H Long Setup📊 ETHENA/USDT – 4H Long Setup
Entry: 0.6520 (Current breakout level)
Stop Loss (SL): 0.5336 (Below 4H support)
Take Profit Targets:
• TP1: 0.6174 (previous 4H resistance retest)
• TP2: 0.6606 (major resistance level, dotted yellow)
• TP3 / Extended Target: 0.7000 – 0.7003 (major swing high)
📈

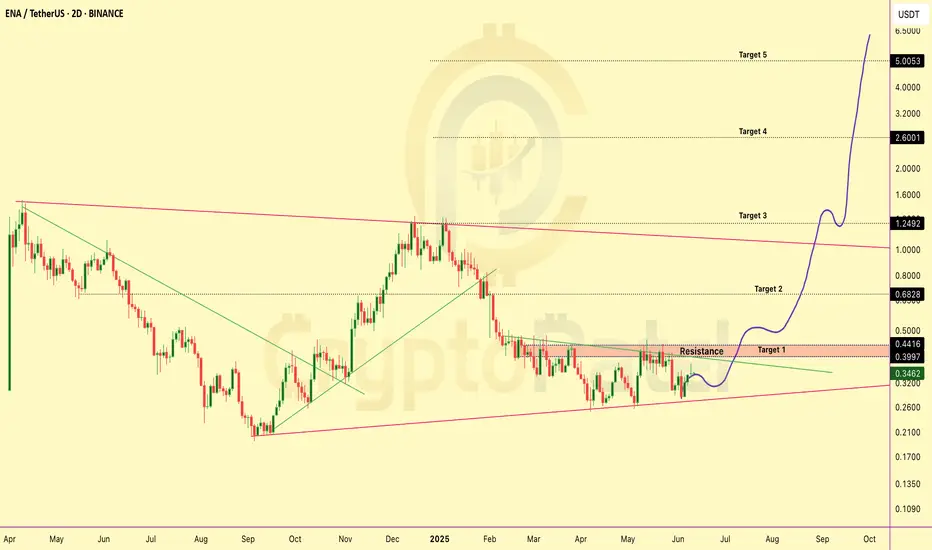
ENA/USDT Now 200% up from our EntryMIL:ENA Update: Strong Momentum in Just a Few Days
I shared an early entry below $0.25, and now MIL:ENA is trading above $0.67 that’s nearly 2.8x your capital from our entry.
Both Target 1 and Target 2 have already been hit.
I remain very bullish on MIL:ENA for the long term, with a potentia

To day we my plan is 📉 Bearish Breakdown Setup (If Support Breaks)
Entry (Short): Below $0.2520
Stop Loss (SL): Above $0.2580
Targets:
🎯 Target 1: $0.2450
🎯 Target 2: $0.2380
🎯 Target 3: $0.2300
Confirmation: Wait for a strong candle close below $0.2520 on volume for confirmation of breakdown.
---
📈 Bullish

ENA/USDT Chart Analysis — Is It the Right Time To Accumulate?ENA/USDT Chart Analysis — Is It the Right Time To Accumulate?
MIL:ENA is still trading nearly -77% below its all-time high (ATH) of $1.52, currently hovering around $0.34.
Right now, the price is sitting above a strong support zone near $0.27, making the current range of $0.34–$0.30 an attractiv
ENA LONGENA tends to rise when Ethereum rises because its base is directly backed by Ethereum Token Price. Forming Bullish W Pattern

ENAUSDT big target visible.ENA has very big target visible on the chart. very good accumulation zone. Keep adding in the trades. It can even blast upto 5 too.

See all ideas
Summarizing what the indicators are suggesting.
Oscillators
Neutral
SellBuy
Strong sellStrong buy
Strong sellSellNeutralBuyStrong buy
Oscillators
Neutral
SellBuy
Strong sellStrong buy
Strong sellSellNeutralBuyStrong buy
Summary
Neutral
SellBuy
Strong sellStrong buy
Strong sellSellNeutralBuyStrong buy
Summary
Neutral
SellBuy
Strong sellStrong buy
Strong sellSellNeutralBuyStrong buy
Summary
Neutral
SellBuy
Strong sellStrong buy
Strong sellSellNeutralBuyStrong buy
Moving Averages
Neutral
SellBuy
Strong sellStrong buy
Strong sellSellNeutralBuyStrong buy
Moving Averages
Neutral
SellBuy
Strong sellStrong buy
Strong sellSellNeutralBuyStrong buy
Displays a symbol's price movements over previous years to identify recurring trends.
Frequently Asked Questions
The current price of ENA / UST (ENA) is 0.24418000 USDT — it has fallen −5.89% in the past 24 hours. Try placing this info into the context by checking out what coins are also gaining and losing at the moment and seeing ENA price chart.
ENA / UST price has risen by 19.74% over the last week, its month performance shows a −9.69% decrease, and as for the last year, ENA / UST has decreased by −79.25%. See more dynamics on ENA price chart.
Keep track of coins' changes with our Crypto Coins Heatmap.
Keep track of coins' changes with our Crypto Coins Heatmap.
ENA / UST (ENA) reached its highest price on Dec 4, 2024 — it amounted to 885,580.00000000 USDT. Find more insights on the ENA price chart.
See the list of crypto gainers and choose what best fits your strategy.
See the list of crypto gainers and choose what best fits your strategy.
ENA / UST (ENA) reached the lowest price of 0.19355000 USDT on Dec 18, 2025. View more ENA / UST dynamics on the price chart.
See the list of crypto losers to find unexpected opportunities.
See the list of crypto losers to find unexpected opportunities.
The safest choice when buying ENA is to go to a well-known crypto exchange. Some of the popular names are Binance, Coinbase, Kraken. But you'll have to find a reliable broker and create an account first. You can trade ENA right from TradingView charts — just choose a broker and connect to your account.
Crypto markets are famous for their volatility, so one should study all the available stats before adding crypto assets to their portfolio. Very often it's technical analysis that comes in handy. We prepared technical ratings for ENA / UST (ENA): today its technical analysis shows the sell signal, and according to the 1 week rating ENA shows the sell signal. And you'd better dig deeper and study 1 month rating too — it's sell. Find inspiration in ENA / UST trading ideas and keep track of what's moving crypto markets with our crypto news feed.
ENA / UST (ENA) is just as reliable as any other crypto asset — this corner of the world market is highly volatile. Today, for instance, ENA / UST is estimated as 7.56% volatile. The only thing it means is that you must prepare and examine all available information before making a decision. And if you're not sure about ENA / UST, you can find more inspiration in our curated watchlists.
You can discuss ENA / UST (ENA) with other users in our public chats, Minds or in the comments to Ideas.