Option Trading 1. Option Pricing
Options are priced using models like Black-Scholes and Binomial Models, which consider:
Current stock price
Strike price
Time to expiration
Interest rates
Dividends
Volatility (most important factor)
The “Greeks” – Sensitivity Measures
Delta – Measures how much the option price changes with a ₹1 move in the stock.
Gamma – Measures how delta changes with stock movement.
Theta – Time decay; how much value the option loses daily as expiration nears.
Vega – Sensitivity to volatility.
Rho – Sensitivity to interest rates.
2. Options in Hedging
Professional investors and institutions use options for risk management:
A fund manager holding a large stock portfolio may buy put options to protect against a market crash.
Exporters and importers use currency options to hedge exchange rate risks.
Airlines may use oil options to hedge against fuel price rises.
Options in India and Global Markets
In India, options are traded on NSE (National Stock Exchange) with contracts based on Nifty, Bank Nifty, and individual stocks.
Lot sizes are fixed by exchanges.
Global markets like the U.S. (CBOE) have highly liquid options markets, with more flexibility and variety.
3. Psychology in Option Trading
Successful option traders combine technical analysis, market structure, and psychology:
Patience is crucial because options decay with time.
Discipline is key to managing leverage.
Emotional trading often leads to overtrading and big losses.
4. Practical Example
Suppose Reliance stock is trading at ₹2,500.
You buy a call option with a strike price of ₹2,600 for ₹50 premium.
If Reliance rises to ₹2,800:
Profit = ₹200 – ₹50 = ₹150 per share.
If Reliance stays below ₹2,600:
Loss = ₹50 (premium only).
On the flip side, if you sell this option and Reliance jumps, you may face unlimited losses.
ETHPROS_TPG8CJ.USD trade ideas

ETH/USDT Buy Setup – Rounding Bottom RetestEthereum is setting up a high-probability long entry after completing a 4H rounding bottom pattern with a clean retest. This structure often signals exhaustion of sellers and the start of a sustained bullish leg.
Trade Idea
Buy Entry: 4510
Stop Loss: 4400
Target: 1:1.5 RR (approx. 4810)
Why This Setup?
4H Rounding Bottom: Classic reversal + continuation structure.
Retest Confirmation: Price is reacting strongly after trapping late sellers.
Confluence: Trend momentum aligns with bullish bias, supported by higher timeframe structure.
Execution Notes
Risk small and stick to 1–2% max per trade.
If ETH breaks and holds above 4600, momentum could accelerate quickly.
Trail stops if strength builds toward $4800–$4900 zone.
Summary: ETH has trapped sellers at the lows and is retesting a bullish rounding bottom. With clean risk defined at 4400, this 1:1.5 setup offers both safety and upside potential.

ETHUSD SHOWING A GOOD UP MOVE WITH 1:8 RISK REWARD ETHUSD SHOWING A GOOD
UP MOVE WITH 1:8 RISK REWARD
DUE TO THESE REASON
A. its following a rectangle pattern that stocked the market
which preventing the market to move any one direction now it trying to break the strong resistant lable
B. after the break of this rectangle it will boost the market potential for break
C. also its resisting from a strong neckline the neckline also got weeker ald the price is ready to break in the outer region
all of these reason are indicating the same thing its ready for breakout BREAKOUT trading are follws good risk reward
please dont use more than one percentage of your capitalfollow risk reward and tradeing rules
that will help you to to become a bettertrader
thank you

What is Zero Day Options (0DTE) trading?1. Understanding 0DTE Options
Definition
Zero Day to Expiration options are options contracts that expire on the same trading day they are purchased. For example, if today is Friday, and a trader buys a call option on the S&P 500 index with 0DTE, the contract will expire at the close of the market on Friday. Essentially, the lifetime of these contracts is measured in hours rather than days or weeks.
2. Mechanics of 0DTE Trading
2.1 Option Types Used
Most 0DTE trading occurs in index options (like SPX, NDX, RUT) rather than single-stock options because index options:
Have higher liquidity.
Feature smaller bid-ask spreads.
Are cash-settled, reducing the risk of assignment.
Traders can use calls, puts, or combinations (spreads, straddles, strangles) depending on their market outlook.
2.2 Pricing Dynamics
0DTE options pricing is primarily influenced by:
Intrinsic Value – The difference between the strike price and the current price of the underlying asset.
Time Value – With 0DTE, the time value approaches zero rapidly.
Implied Volatility (IV) – Small changes in volatility can significantly impact 0DTE option prices.
Theta Decay – The most crucial factor. Since expiration is hours away, Theta can erode the premium of out-of-the-money options almost instantly.
Mathematically, options pricing can be expressed using the Black-Scholes model, though traders must account for extreme sensitivity to small inputs for 0DTE options.
3. Why Traders Use 0DTE Options
3.1 Opportunities for Profit
0DTE options offer several profit opportunities:
Leverage – Small movements in the underlying asset can produce outsized gains.
Short-Term Hedging – Traders can hedge intraday positions without tying up capital for days.
Volatility Plays – Sudden market swings, news events, or macroeconomic announcements can create rapid profits.
3.2 Psychological Appeal
Many traders are drawn to 0DTE options because:
Fast results: Unlike traditional trades, results are immediate, satisfying the demand for quick feedback.
Excitement: The high-risk, high-reward nature can feel like active gambling, attracting thrill-seekers.
Scalping: They allow multiple trades in a single day, exploiting short-term inefficiencies.
4. Strategies for 0DTE Options
Trading 0DTE options requires precision, discipline, and advanced strategies. Common strategies include:
4.1 Directional Trades
Long Calls/Puts: Buying a call if bullish or a put if bearish. High potential reward but high Theta decay.
Intraday Scalping: Entering and exiting multiple positions based on minute-to-minute market moves.
4.2 Non-Directional Trades
Iron Condors: Selling an out-of-the-money call and put while buying further out-of-the-money options to limit risk. Works well in low-volatility scenarios.
Straddles/Strangles: Buying or selling both calls and puts at the same or different strike prices to profit from expected volatility.
4.3 Gamma Scalping
0DTE options have extremely high Gamma, meaning the Delta changes rapidly as the underlying moves. Professional traders may use gamma scalping to adjust positions dynamically for small, incremental profits.
4.4 Hedging
Traders can use 0DTE options to hedge larger positions. For instance, a trader holding a stock index position may buy a 0DTE put to protect against an intraday downside move.
5. Risk and Reward
5.1 Reward Potential
0DTE options can produce explosive returns, often multiples of the initial investment if the trade moves in favor within hours. Traders are drawn to scenarios where a 1% move in the underlying asset can yield 50–100% gains in the option.
5.2 Risks Involved
Rapid Theta Decay: Out-of-the-money options can become worthless in hours.
Market Noise: Small, unpredictable price movements can trigger losses.
Liquidity Risk: Despite high volume in index options, wide spreads can impact execution.
Psychological Stress: Extreme volatility can result in emotional decision-making.
5.3 Risk Management Techniques
Defined-Risk Strategies: Use spreads or iron condors to cap potential losses.
Position Sizing: Limit exposure to a small percentage of trading capital per trade.
Stop-Loss Orders: Implement strict stop-loss levels for intraday trades.
Exit Discipline: Since expiration is imminent, knowing when to exit is critical.
6. Market Conditions Favoring 0DTE Trading
0DTE options thrive in certain market conditions:
High Volatility: News releases, earnings, FOMC meetings, and geopolitical events.
Intraday Trends: Strong directional trends provide opportunities for quick profits.
Range-Bound Markets: Strategies like iron condors or short straddles capitalize on minimal movement.
Low Liquidity Events: Sometimes, lower liquidity can widen spreads, but careful traders exploit temporary inefficiencies.
7. Tools and Platforms
Effective 0DTE trading requires:
Advanced Trading Platforms: Real-time charts, fast execution, and option-specific analytics.
Level II Data: For seeing order book depth and anticipating short-term price action.
Option Greeks Tracking: Monitor Delta, Gamma, Theta, and Vega in real-time.
Algorithmic Support: Many traders use scripts or bots for precise entries and exits.
8. 0DTE Trading for Retail vs. Institutional Traders
8.1 Retail Traders
Drawn to high-reward potential.
Often over-leverage due to excitement.
Use simplified strategies like buying calls/puts.
8.2 Institutional Traders
Use 0DTE to hedge or adjust broader portfolios.
Employ gamma scalping and other sophisticated strategies.
Monitor systemic risk exposure across multiple assets.
9. Regulatory and Tax Considerations
0DTE trading is legal and regulated in most markets where options trading is allowed.
Frequent trading may trigger short-term capital gains taxes, often at higher rates than long-term gains.
Brokers may require higher margin due to the extreme risk.
10. Psychological Aspects
0DTE trading can induce high stress:
Rapid wins and losses can trigger emotional decision-making.
Traders must maintain discipline, avoid revenge trading, and adhere strictly to risk limits.
Journaling and post-trade analysis are essential to improve strategy over time.
11. Advantages and Disadvantages
11.1 Advantages
High leverage.
Immediate results.
Multiple trading opportunities per day.
Ideal for hedging short-term risk.
11.2 Disadvantages
Extremely high risk of total loss.
Requires constant monitoring and fast execution.
Emotional and psychological strain.
Not suitable for beginners without proper education.
12. Case Study: SPX 0DTE Trading
Suppose the S&P 500 index is at 4,500. A trader buys a 4,510 call option expiring in 0DTE:
Premium Paid: $2 per contract.
Scenario 1: Index moves to 4,520 within hours → Option premium may jump to $12 → Profit: $1,000 per contract.
Scenario 2: Index moves down to 4,495 → Option expires worthless → Loss: $200 per contract.
This illustrates both the reward potential and risk inherent in 0DTE trading.
13. Best Practices
Trade liquid instruments like SPX, NDX, or RUT.
Stick to defined-risk strategies to avoid catastrophic losses.
Focus on short, disciplined trades, avoiding overexposure.
Use technical analysis for intraday patterns.
Stay aware of economic events that can cause sudden volatility.
Keep a trading journal to evaluate performance and refine strategies.
Conclusion
Zero Day to Expiration (0DTE) options trading represents the frontier of intraday derivatives trading. With extreme leverage, rapid time decay, and the ability to exploit minute-to-minute market movements, 0DTE options offer tremendous potential for profits—but equally, they carry formidable risks. Successful 0DTE trading demands knowledge, discipline, risk management, and psychological resilience.
While 0DTE trading is not suited for everyone, when approached methodically, it provides both retail and institutional traders with powerful tools for hedging, speculation, and tactical profit-making. In an era of fast-moving markets, 0DTE options have cemented their place as a central instrument for aggressive, high-frequency trading strategies.

ETH again in trap Zone ETH has fallen as expected in last analysis, but now it is stuck in no trade zone or trap Zone, if we plan long at fibonacci 50% retracement we can expect a short good move ,or it we only can go up after trendline breakout
Disclaimer. This idea is only for education purpose only not for trading loss and profit

Part 1 Support and ResistanceIntroduction to Options Trading
Options trading is a sophisticated segment of the financial markets that allows investors to speculate on the future price movement of an underlying asset without actually owning it. Unlike traditional stocks, where you buy and sell shares directly, options are derivative instruments — their value is derived from an underlying security, such as a stock, index, commodity, or currency. Options can provide unique advantages, including leverage, flexibility, and hedging opportunities, making them popular among traders and investors looking for strategic ways to manage risk and potentially enhance returns.
Basic Concepts of Options
At its core, an option is a contract that gives the holder the right, but not the obligation, to buy or sell an underlying asset at a predetermined price on or before a specific date. The two main types of options are:
Call Option: Grants the holder the right to buy an asset at a specific price, known as the strike price, within a defined period.
Put Option: Grants the holder the right to sell an asset at the strike price within a defined period.
The price paid to purchase an option is called the premium, and it represents the cost of acquiring the rights that the option provides. Sellers (or writers) of options receive this premium and are obligated to fulfill the contract if the buyer exercises the option.
Key Components of Options
Understanding options requires familiarity with their core components:
Underlying Asset: The financial instrument (stock, index, commodity, or currency) on which the option is based.
Strike Price (Exercise Price): The predetermined price at which the option can be exercised.
Expiry Date: The date on which the option contract expires. After this date, the option becomes worthless if not exercised.
Premium: The cost of purchasing the option. It is influenced by factors such as the underlying asset’s price, volatility, time to expiry, and interest rates.
Option Style: There are two primary styles:
American Option: Can be exercised any time before expiry.
European Option: Can only be exercised on the expiry date.

Ethereum 1 Week View📊 Weekly Timeframe Technical Overview
On the weekly chart, ETH has recently achieved its highest weekly close in four years, signaling strong bullish momentum.
🔄 Key Support and Resistance Levels
Support Levels: The primary support zone lies between $4,150 and $4,200, with additional support around $4,000.
Resistance Levels: Immediate resistance is observed around $4,500, with stronger resistance near $4,700–$4,760 .
📈 Technical Indicators
Relative Strength Index (RSI): The 14-day RSI is approximately 51.58, indicating neutral momentum
Moving Averages: Short-term moving averages (5-day, 10-day) are above the current price, suggesting potential resistance, while longer-term averages (50-day, 100-day, 200-day) are below, indicating support
MACD: The MACD is positive, supporting a bullish outlook
🧭 Market Sentiment
Analysts are closely monitoring the Federal Open Market Committee (FOMC) meeting this week, as a dovish stance could bolster risk assets like ETH, potentially driving prices toward the $4,700–$4,800 range
📅 Price Forecast
Analytical forecasts suggest that ETH may reach approximately $4,311.84 within a week and $4,520.26 within four weeks.

ETHUSD 2.5R sell side trade scenarioETHUSD is forming sell side trades as current bias and draw on liquidity both are at down side. Price has also left SIBIs to attract price upside for a while and then return back to target. In weekend price may have low volatility and trade possibly generate on Monday or later.
1. There is a daily time frame bearish FVG.
2. There is bearish FVG in 4H TF. Now price is approaching it slowly.
3. These FVGs are forming inside OTE zone.
4. Order flow is bearish. And draw on liquidity is also at downside.
5. Most probably price will take liquidity of FVGs and create MSS/CISD/TS/iFVG in LTF.
6. Price should show rejection/reversal in LTF (5m,1m) at FVG zone.
7. BTC is also forming similar scenario.
All these combinations are signalling a high probability and 2.5R trade scenario.
Note – if you liked this analysis, please boost the idea so that other can also get benefit of it. Also follow me for notification for incoming ideas.
Also Feel free to comment if you have any input to share.
Disclaimer – This analysis is just for education purpose not any trading suggestion. Please take the trade at your own risk and with the discussion with your financial advisor.

Understanding Fundamental Market Concepts1. Introduction to Financial Markets
Financial markets are platforms where buyers and sellers come together to trade financial instruments. They provide liquidity, transparency, and price discovery, ensuring efficient allocation of resources. Markets are not limited to stocks; they include bonds, commodities, currencies, and derivatives.
Purpose of Financial Markets
Capital formation: Businesses raise funds to expand operations or invest in projects.
Price discovery: Market prices reflect supply-demand dynamics and underlying value.
Liquidity: Investors can quickly buy or sell assets.
Risk transfer: Instruments like derivatives help shift or manage financial risk.
Economic growth: Efficient markets channel capital to productive sectors.
Types of Financial Markets
Stock markets: Trading of company shares.
Bond markets: Trading of debt securities.
Commodity markets: Trading raw materials like metals, energy, and agriculture.
Foreign exchange markets: Currency trading.
Derivatives markets: Trading contracts based on underlying assets.
2. Key Participants in Financial Markets
Understanding participants helps in analyzing market dynamics.
1. Retail Investors
Individuals trading their personal capital.
Motivated by wealth creation, savings growth, or speculation.
2. Institutional Investors
Mutual funds, hedge funds, insurance companies, and pension funds.
They control large capital pools and influence market trends.
3. Brokers and Market Makers
Brokers: Facilitate buying and selling for clients.
Market makers: Provide liquidity by quoting buy and sell prices.
4. Regulators
Ensure market transparency, fairness, and stability.
Examples: SEBI (India), SEC (USA), FCA (UK).
3. Stocks: Ownership in Companies
Stocks, also called equities, represent ownership in a company. Investing in stocks allows individuals to participate in company profits and growth.
Types of Stocks
Common stocks: Voting rights and dividends.
Preferred stocks: Fixed dividends, limited voting rights.
Stock Valuation Metrics
Market Capitalization: Stock price × total shares.
Price-Earnings (P/E) Ratio: Price per share ÷ earnings per share (EPS).
Book Value: Net asset value per share.
Dividend Yield: Annual dividend ÷ stock price.
Stock Indices
Represent performance of a group of stocks.
Examples: Nifty 50, S&P 500, Dow Jones Industrial Average.
Indices serve as benchmarks for investment performance.
Stock Trading Mechanisms
Conducted through stock exchanges like NSE, BSE, NYSE, or NASDAQ.
Primary market: Companies issue shares via IPOs to raise capital.
Secondary market: Existing shares are traded among investors.
4. Bonds and Fixed-Income Instruments
Bonds are debt instruments issued by governments or corporations to raise funds. Investors lend money to issuers and receive periodic interest payments.
Key Bond Concepts
Face value: Amount paid at maturity.
Coupon rate: Interest paid to bondholders.
Yield: Return on investment.
Credit rating: Risk assessment by agencies like Moody’s or S&P.
Types of Bonds
Government bonds (low risk).
Corporate bonds (higher returns, moderate risk).
Municipal bonds (tax advantages in some countries).
Advantages of Bonds
Lower risk than stocks.
Regular income through interest.
Diversification for a balanced portfolio.
5. Commodity Markets
Commodity markets trade raw materials critical for global industries.
Types of Commodities
Metals: Gold, silver, copper.
Energy: Oil, natural gas, coal.
Agricultural: Wheat, coffee, cotton.
Price Determinants
Supply-demand imbalance.
Weather and natural disasters.
Geopolitical events.
Currency fluctuations (especially USD).
Trading Mechanisms
Spot markets: Immediate delivery.
Futures markets: Agreements to buy/sell at future dates.
6. Foreign Exchange Markets
The forex market is the largest global financial market, facilitating currency exchange for trade, investment, and speculation.
Key Concepts
Exchange rate: Value of one currency in terms of another.
Currency pairs: e.g., EUR/USD, USD/INR.
Spot rate vs. forward rate: Immediate vs. future delivery.
Market Participants
Central banks (e.g., RBI, Fed) controlling monetary policy.
Commercial banks facilitating trade and hedging.
Retail and institutional traders speculating on currency movements.
7. Derivatives: Managing Risk
Derivatives are financial instruments whose value is derived from underlying assets (stocks, bonds, commodities, currencies).
Types of Derivatives
Futures: Obligatory contract to buy/sell at a future date.
Options: Right, but not obligation, to buy/sell at a predetermined price.
Swaps: Exchange of cash flows between parties (e.g., interest rate swaps).
Forwards: Customized contracts for future transactions.
Purpose of Derivatives
Hedging: Protect against price fluctuations.
Speculation: Profit from price movements.
Arbitrage: Exploit price differences between markets.
8. Market Analysis Techniques
Investors use multiple approaches to evaluate markets and select investments.
1. Fundamental Analysis
Evaluates intrinsic value based on economic, financial, and industry factors.
Key metrics: Earnings, revenue growth, P/E ratio, debt levels.
Macro factors: Inflation, GDP growth, interest rates, unemployment.
2. Technical Analysis
Studies historical price and volume patterns to predict future movements.
Tools: Candlestick charts, moving averages, RSI, MACD.
3. Sentiment Analysis
Gauges investor mood using news, surveys, and social media trends.
Important for predicting short-term market movements.
9. Risk and Money Management
Effective risk management ensures sustainable returns and protects capital.
Types of Market Risk
Market risk: Loss due to price movements.
Credit risk: Borrower fails to repay.
Liquidity risk: Inability to sell assets quickly.
Operational risk: Failures in systems or processes.
Risk Mitigation Techniques
Diversification: Spread investments across sectors and asset classes.
Position sizing: Invest proportionally to portfolio value.
Stop-loss orders: Limit potential losses on trades.
10. Global Market Awareness
Markets are increasingly interconnected, influenced by global economic and geopolitical developments.
Key Influencers
Global indices: S&P 500, FTSE 100, Nikkei 225 indicate economic trends.
Currency movements: Affect trade and multinational companies.
Central bank policies: Interest rate changes and quantitative easing impact markets.
Geopolitical events: Wars, elections, trade agreements affect market sentiment.
Importance
Investors must track international trends to make informed decisions.
Global awareness aids in risk diversification and long-term strategy planning.
11. Financial Products and Instruments
Investors have multiple options to gain exposure to markets:
Mutual funds: Pooled investment managed by professionals.
Exchange-Traded Funds (ETFs): Traded like stocks, tracking indices or commodities.
Real Estate Investment Trusts (REITs): Income from property portfolios.
SIP (Systematic Investment Plan): Periodic investment in mutual funds.
IPOs and FPOs: Opportunities to invest in companies at the primary market level.
These products help investors tailor risk-return profiles to their financial goals.
12. Building a Market Mindset
Successful investors develop a disciplined mindset:
Patience: Long-term wealth creation over short-term gains.
Continuous learning: Understanding evolving market trends.
Adaptability: Adjusting strategies based on economic changes.
Analytical thinking: Making decisions based on data, not emotions.
Conclusion
Mastering fundamental market concepts involves understanding market structures, instruments, participants, and analysis techniques. Investors equipped with this knowledge can navigate stocks, bonds, commodities, forex, and derivatives, balancing risk and return. Global awareness, disciplined risk management, and continuous learning are essential for sustainable market success.
The world of financial markets may appear complex initially, but breaking it down into structured learning—starting with basic concepts and progressing to global strategies—enables anyone to become a confident, informed market participant.
ETH long ETH may touch fib 618 level that is 4510 then it can bounce back to 4575 stoploss can be set at 4490

Technical Analysis (TA) and Fundamental Analysis (FA) in Trading1. Introduction to Market Analysis
Financial markets, whether stocks, forex, commodities, or cryptocurrencies, are highly dynamic. Prices fluctuate due to supply and demand, investor sentiment, macroeconomic factors, corporate performance, and global events. To navigate this volatility, traders and investors use analysis methods to predict future price movements and identify profitable opportunities.
The two main methods are:
Fundamental Analysis (FA): Focuses on the intrinsic value of an asset by evaluating economic, financial, and qualitative factors.
Technical Analysis (TA): Focuses on historical price and volume data to predict future price movements using charts and technical indicators.
While both have their strengths and weaknesses, many successful traders use a combination of both to make informed decisions.
2. Fundamental Analysis (FA)
2.1 Definition
Fundamental Analysis is the study of a company’s financial health, economic conditions, and other external factors to determine the intrinsic value of a stock or asset. The goal is to identify whether an asset is overvalued, undervalued, or fairly priced in the market.
2.2 Key Principles
Intrinsic Value: The true worth of a company or asset based on fundamentals, not just the market price.
Long-Term Perspective: FA is generally used by investors looking for long-term investments rather than short-term trading.
Economic Influence: Macroeconomic factors, industry trends, and geopolitical events influence the value of assets.
2.3 Components of Fundamental Analysis
Fundamental Analysis involves two main components:
2.3.1 Quantitative Analysis
This involves analyzing measurable data from financial statements and economic reports. Key metrics include:
Revenue and Earnings: Revenue indicates the total income generated, while earnings reflect the net profit.
Earnings Per Share (EPS): Shows profitability on a per-share basis.
Price-to-Earnings (P/E) Ratio: Compares the stock price to its earnings. A high P/E may indicate overvaluation.
Debt-to-Equity Ratio (D/E): Measures financial leverage and risk.
Return on Equity (ROE): Indicates how effectively a company uses shareholders’ equity to generate profit.
Cash Flow Analysis: Evaluates liquidity and the ability to meet obligations.
2.3.2 Qualitative Analysis
This involves assessing non-numerical factors that affect a company’s long-term performance, including:
Business Model: Understanding how a company makes money and its competitive advantage.
Management Quality: Leadership effectiveness impacts growth and profitability.
Industry Trends: Assessing the growth potential and competitive landscape.
Brand Strength and Market Position: Strong brands often command pricing power.
Regulatory Environment: Government policies can affect operations and profitability.
2.4 Steps in Fundamental Analysis
Macro Analysis: Examine global and national economic conditions.
Industry Analysis: Evaluate the sector or industry trends and competitors.
Company Analysis: Analyze financial statements, management, and business strategies.
Valuation: Use models like Discounted Cash Flow (DCF), Price-to-Earnings (P/E), or Price-to-Book (P/B) to estimate intrinsic value.
Decision Making: Compare intrinsic value to current market price to determine buy, hold, or sell.
2.5 Advantages of Fundamental Analysis
Provides a long-term perspective.
Helps investors make informed decisions based on real company performance.
Can identify undervalued opportunities for significant gains.
2.6 Limitations of Fundamental Analysis
Time-consuming and requires detailed research.
Market prices can remain irrational for extended periods.
Not suitable for short-term trading due to market volatility.
3. Technical Analysis (TA)
3.1 Definition
Technical Analysis is the study of past market data—primarily price and volume—to forecast future price movements. Unlike FA, it does not focus on a company’s intrinsic value but on market behavior and trends.
3.2 Key Principles
Technical Analysis is based on three core assumptions:
Price Discounts Everything: All available information (fundamentals, sentiment, news) is already reflected in the market price.
Prices Move in Trends: Markets follow trends (uptrend, downtrend, or sideways), and these trends can be identified and traded.
History Tends to Repeat Itself: Price patterns and market psychology often repeat due to human behavior.
3.3 Tools of Technical Analysis
Technical Analysis relies on charts, indicators, and patterns:
3.3.1 Price Charts
Line Chart: Connects closing prices over time.
Bar Chart: Shows open, high, low, and close prices (OHLC).
Candlestick Chart: Visual representation of OHLC with patterns indicating market sentiment.
3.3.2 Technical Indicators
Indicators are mathematical calculations based on price and volume to identify trends, momentum, and reversals.
Common Indicators:
Moving Averages (MA): Smooth out price data to identify trends.
Relative Strength Index (RSI): Measures overbought or oversold conditions.
Moving Average Convergence Divergence (MACD): Detects momentum and trend changes.
Bollinger Bands: Identify volatility and potential reversal points.
Volume Indicators (OBV, VWAP): Confirm price movements with volume activity.
3.3.3 Chart Patterns
Patterns indicate potential market movements:
Trend Continuation Patterns: Flags, pennants, and triangles suggest ongoing trends.
Reversal Patterns: Head and shoulders, double tops/bottoms signal trend changes.
Candlestick Patterns: Doji, hammer, engulfing, shooting star indicate short-term reversals.
3.3.4 Support and Resistance
Support: Price level where demand is strong enough to prevent further decline.
Resistance: Price level where selling pressure prevents price from rising.
Identifying these levels helps traders set entry, exit, and stop-loss points.
3.4 Steps in Technical Analysis
Select the Asset and Timeframe: Choose the market and timeframe (intraday, daily, weekly, monthly).
Analyze Trend: Determine if the market is in an uptrend, downtrend, or sideways.
Identify Key Levels: Locate support, resistance, and breakout zones.
Apply Indicators: Use momentum, volume, and trend indicators to confirm signals.
Plan Entry and Exit: Decide when to enter or exit trades based on risk management.
3.5 Advantages of Technical Analysis
Works in any market with historical data.
Suitable for short-term and intraday trading.
Helps identify precise entry and exit points.
Can be automated using algorithmic trading.
3.6 Limitations of Technical Analysis
Ignores underlying fundamentals.
Requires discipline and practice to interpret correctly.
May produce false signals in volatile markets.
4. Integrating FA and TA
Many successful market participants combine both methods to maximize profits:
FA to Choose the Asset: Identify fundamentally strong stocks for long-term investment.
TA to Time the Market: Use technical signals to decide when to buy or sell.
For example:
A stock may be fundamentally undervalued (FA).
TA can identify the right entry point when the price hits a key support level.
Similarly, FA can help avoid fundamentally weak stocks that may temporarily rise due to technical momentum.
5. Practical Tips for Traders and Investors
Know Your Style: Long-term investors benefit more from FA, while short-term traders rely on TA.
Risk Management: Always set stop-loss levels and manage trade size.
Stay Updated: Monitor economic news, earnings reports, and global events.
Combine Analysis: Using FA and TA together can reduce risk and improve accuracy.
Continuous Learning: Markets evolve, so stay updated on new tools and strategies.
6. Conclusion
Both Fundamental Analysis (FA) and Technical Analysis (TA) are essential tools for navigating financial markets. FA provides the foundation for understanding the true value of assets, while TA offers insights into price trends, momentum, and market psychology. While FA is best suited for long-term investments, TA is invaluable for timing trades and short-term opportunities. By understanding and integrating both approaches, traders and investors can make informed decisions, minimize risk, and increase their chances of consistent success in the dynamic world of financial markets.
ETH BIG HAMMERAfter good correction ETH has made a hammer at the previous liquidity zone (Support).
One can look for Buy on dip from here on in ETH.
SL- 4070
Target- 4300, 4370, 4400
Disclaimer- This is just for Education Purpose.
Follow for mor such content and learnings.
Jai Shree Ram.

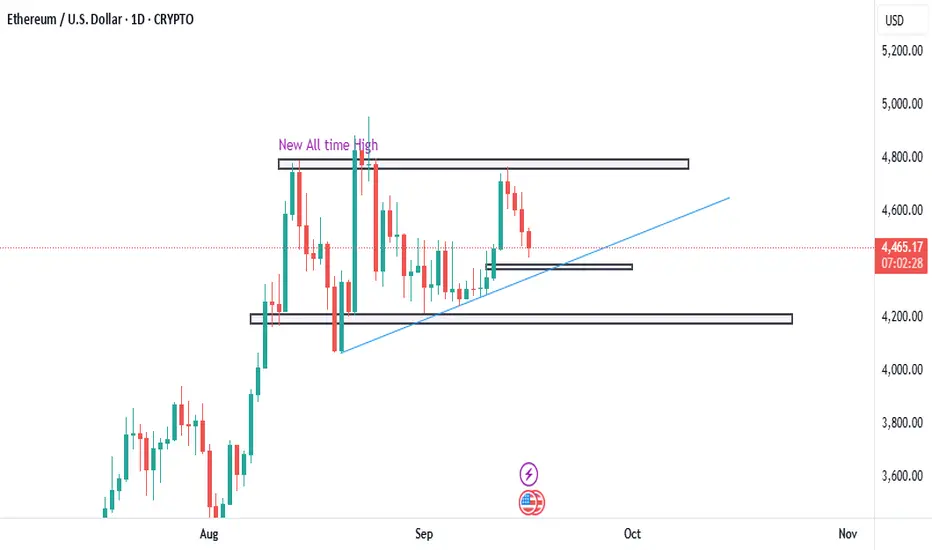
Consolidation and Potential BreakoutResistance: resistance zone is located between $4,700 and $4,800, it is all time high level there are some profit booking whic led to a short reversal,
Support:The primary support is the rising trendline, which has been guiding the price upwards since early September.
There's also a strong horizontal support zone between $4,100 and $4,200. A break below the rising trendline would likely test this lower support level.
An intermediate support level is visible around $4,300 to $4,400, which is where the price is currently hovering.
Ethereum is currently in a high-stakes waiting game. The price is consolidating, building energy for its next major move or all time high. The most prudent strategy is to remain patient and wait for a confirmed breakout or breakdown before entering a position. Waiting for a break of the key resistance at $4,700 or the key support at $4,100 provides a clear entry signal and allows for better risk management.
ETH Setup You Can't Ignore:4k FVG to 5k Seller Zone ⚠️ ETH Setup You Can’t Ignore: 4K FVG to 5K SELLER ZONE!
ETHUSD – Fair Value Gap & Liquidity Sweep Setup
Ethereum is trading within a critical range, presenting a potential ICT-style setup:
Fair Value Gap (4000–4200) – Key demand zone with a “Golden Line” midpoint; price may dip to fill this imbalance before reversing.
Seller Zone (~5000) – Major supply zone where profit-taking or distribution could trigger.
Bias – Expect a sweep of downside liquidity, a reaction within the FVG, and a possible rally toward the 5000 zone if higher timeframe confluence supports it.
⚠️ Always wait for confirmation and manage risk before execution.

ETH/USD 4H ANALYSIS
Ethereum continues to respect the ascending trendline from July lows. Price recently tested the $4,600 zone and is now pulling back slightly.
Trendline Support: Price remains above the rising trendline, showing buyers are still in control of the mid-term trend.
RSI (14): Currently at 56, holding above the 50 level → signals bullish momentum remains intact despite the pullback.
Short-Term Outlook: A retest of the trendline could provide a potential higher-low setup for continuation towards $4,800–$5,000.
Invalidation: A break and close below the trendline would weaken the bullish structure and open downside risk toward $4,200–$4,300.
🔑 Trading Plan
Bullish Bias: Look for long setups on successful retest of trendline + RSI staying above 50.
Bearish Scenario: If price closes below the trendline with RSI < 50, shift bias to short-term downside.

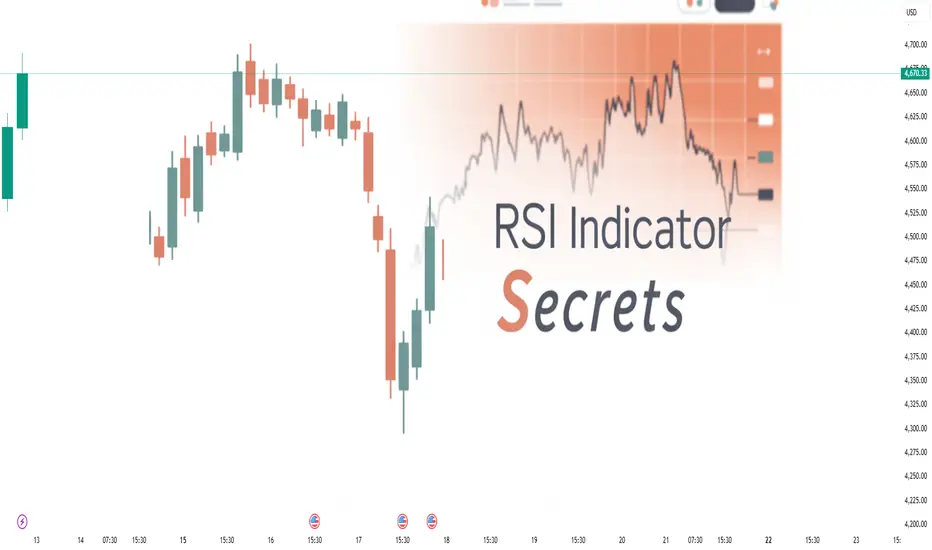
Relative Strength Index (RSI) in Trading1. Introduction to RSI
The financial markets operate on the constant tug-of-war between buyers and sellers. Traders have long sought tools to identify when markets are likely to reverse or continue trending. Among the most widely used technical indicators is the Relative Strength Index (RSI), a momentum oscillator developed to measure the speed and magnitude of recent price movements.
The RSI is not just a number; it’s a psychological mirror of the market, showing when traders may be overenthusiastic (overbought) or overly fearful (oversold). Since its introduction in 1978 by J. Welles Wilder Jr., RSI has become a cornerstone of technical analysis, used by retail traders, institutional investors, and even algorithmic systems across stocks, forex, commodities, and crypto.
2. History & Origin of RSI
RSI was introduced in Wilder’s famous book “New Concepts in Technical Trading Systems” (1978), alongside other indicators like the Average True Range (ATR) and Parabolic SAR. Wilder, a mechanical engineer turned trader, believed in quantifying market psychology.
Before RSI, momentum indicators existed, but they lacked a standardized scale. Wilder’s breakthrough was normalizing momentum into a range between 0 and 100, making it universally applicable and easier to interpret. Over time, RSI’s simplicity and adaptability allowed it to transcend asset classes, from Dow Jones stocks in the 80s to Bitcoin and Ethereum today.
3. Mathematical Formula & Calculation
The RSI formula is:
𝑅
𝑆
𝐼
=
100
−
(
100
1
+
𝑅
𝑆
)
RSI=100−(
1+RS
100
)
Where:
RS (Relative Strength) = Average Gain / Average Loss (over a set period, usually 14)
Steps:
Calculate the average of “up closes” and “down closes” for 14 periods.
Divide average gain by average loss = RS.
Plug RS into the RSI formula to scale between 0–100.
Example:
Average Gain = 1.5%
Average Loss = 0.75%
RS = 1.5 / 0.75 = 2
RSI = 100 – = 66.6
Thus, RSI = 67 indicates bullish momentum but not yet overbought.
4. Understanding RSI Levels
Above 70 → Overbought (possible correction)
Below 30 → Oversold (possible rebound)
Around 50 → Neutral (balance between buyers & sellers)
Some traders adjust:
80/20 levels for stronger trends
60/40 levels in trending markets (RSI may not touch extremes often)
RSI levels act as zones of probability, not absolute buy/sell signals.
5. RSI in Different Market Conditions
Trending Markets: RSI can remain overbought (>70) or oversold (<30) for extended periods. For example, in strong bull runs, RSI may hover around 70–80.
Ranging Markets: RSI oscillates smoothly between 30 and 70, making it excellent for mean-reversion strategies.
Volatile Markets: RSI signals can be whipsawed, requiring filters like moving averages or multiple timeframe confirmations.
6. RSI Trading Strategies
a) Overbought & Oversold Strategy
Buy when RSI < 30 (oversold) and price shows reversal.
Sell when RSI > 70 (overbought) and reversal signs appear.
Works best in sideways markets.
b) Divergence Strategy
Bullish Divergence: Price makes lower lows, RSI makes higher lows → reversal likely upward.
Bearish Divergence: Price makes higher highs, RSI makes lower highs → reversal likely downward.
c) RSI Swing Rejections
A method Wilder emphasized:
Bullish: RSI goes below 30, bounces back, rejects a second drop, then crosses above previous high.
Bearish: RSI goes above 70, falls, rejects second rise, then breaks lower.
d) RSI Trendlines & Breakouts
Traders draw trendlines on RSI itself, treating it like a price chart. Breakouts often lead price action.
e) RSI + Moving Averages
Use RSI to confirm MA crossovers. Example: RSI > 50 when 50-day MA crosses above 200-day MA strengthens bullish trend.
7. RSI for Different Timeframes
Intraday/Scalping (1–5 min): RSI is very sensitive. Traders use shorter settings (7-period RSI).
Swing Trading (1D–1W): Classic 14-period RSI works well. Divergences are powerful.
Long-Term Investing (1M): RSI identifies market cycles; buying when RSI < 30 on monthly charts often captures generational opportunities.
8. Combining RSI with Other Indicators
a) RSI + MACD
MACD confirms trend direction; RSI signals entry/exit.
Example: MACD bullish crossover + RSI near 40–50 = strong buy signal.
b) RSI + Bollinger Bands
RSI overbought + price at upper band → higher reversal probability.
RSI oversold + price at lower band → bounce likely.
c) RSI + Volume Profile
High volume at RSI extremes confirms stronger reversals.
d) RSI + Moving Averages
RSI trending above 50 while price is above MA = bullish confirmation.
Conclusion
The Relative Strength Index (RSI) remains one of the most effective momentum oscillators in trading history. From J. Welles Wilder’s manual calculations in the 70s to modern-day algorithmic applications, RSI has proven its adaptability.
Its power lies not in blindly buying at 30 or selling at 70, but in understanding context, divergences, swing rejections, and market psychology. While it has limitations in trending markets, when combined with other tools, RSI becomes a formidable ally.
For traders, RSI is more than a number. It’s a window into collective human behavior, showing how emotion, momentum, and probability interact to move markets. Whether you’re day-trading forex, swing-trading stocks, or investing in crypto, RSI remains a timeless guide to navigating uncertainty.
Ethereum Liquidity Sweep Setup for Bullish Continuation📊 Market Analysis Report – ETHUSD
The market has been consolidating within a range after a strong impulsive move down, followed by a period of liquidity sweeps and corrective structure. Price action shows signs of engineered liquidity grabs both above and below recent highs and lows, which indicates smart money activity.
Currently, ETH is transitioning from a compression phase into expansion. The accumulation zone formed in recent sessions suggests a build-up for a larger move. The market appears to be setting up a liquidity sweep to the downside before a potential continuation upward, aligning with the projected path on the chart.
From a structural perspective, the overall cycle points towards bullish continuation after this corrective phase. The projected liquidity sweep is designed to trap early sellers before price accelerates towards higher objectives.

Part 1 Support and Resistance1. Introduction to Options Trading
Options are financial derivatives that give traders the right, but not the obligation, to buy (Call Option) or sell (Put Option) an underlying asset at a pre-decided price (strike price) within a specific time frame. Unlike shares where you own the asset, options provide flexibility to speculate, hedge, or generate income. Options derive their value from underlying assets like stocks, indices, commodities, or currencies, making them versatile but also complex.
2. The Nature of an Option Contract
Each option contract has four key elements:
Underlying Asset (e.g., Reliance stock, Nifty index).
Strike Price (predetermined buy/sell level).
Premium (price paid to buy the option).
Expiration Date (last valid trading day).
This structure allows traders to choose different risk/reward setups, unlike shares where profit and loss move linearly with price.
3. Call Options Explained
A Call Option gives the buyer the right to purchase the underlying asset at the strike price. For example, buying a Nifty 20,000 Call at ₹100 means you expect Nifty to rise above 20,100 (strike + premium). If it rises, profit potential is unlimited, but loss is capped at ₹100 (the premium paid). This asymmetry makes calls powerful for bullish strategies.
4. Put Options Explained
A Put Option gives the buyer the right to sell the underlying asset at the strike price. Example: buying a TCS ₹3500 Put at ₹80 means you profit if TCS falls below ₹3420 (strike – premium). Put buyers use it for bearish bets or hedging existing long positions. Loss is capped to premium, profit grows as price declines.
5. The Role of Option Writers (Sellers)
Every option has two sides: the buyer and the seller (writer). Writers receive the premium but take on significant obligations. A call writer must sell at strike price if exercised; a put writer must buy. Sellers have limited profit (premium received) but potentially unlimited losses (especially in calls). Option writers dominate because most options expire worthless, but the risk is substantial.
6. Intrinsic Value and Time Value
An option’s premium has two parts:
Intrinsic Value (IV): Actual profit if exercised now. Example: Reliance at ₹2600, Call strike at ₹2500 → IV = ₹100.
Time Value (TV): Extra premium due to potential future price movement. Near expiry, TV decays (time decay).
Understanding IV and TV is crucial for identifying overvalued/undervalued options.
7. Option Expiry and Settlements
Options in India (like Nifty, Bank Nifty) have weekly and monthly expiries. Stock options have monthly expiries. On expiry, in-the-money (ITM) options settle in cash (difference between spot and strike). Out-of-the-money (OTM) expire worthless. Expiry days often see volatile moves as traders adjust positions.
8. The Concept of Moneyness
Options are classified by their relation to the spot price:
In the Money (ITM): Strike favorable (e.g., Call strike below spot).
At the Money (ATM): Strike = spot.
Out of the Money (OTM): Strike unfavorable (e.g., Call above spot).
Moneyness influences premium, risk, and probability of profit.
9. Option Premium Pricing Factors
Option premium is influenced by:
Spot Price of the underlying.
Strike Price.
Time to Expiry.
Volatility (Implied & Historical).
Interest Rates and Dividends.
The Black-Scholes model and other pricing models quantify these variables, but in practice, demand-supply and implied volatility dominate.
10. The Greeks – Risk Management Tools
Option traders use Greeks to measure risk:
Delta: Sensitivity to underlying price.
Gamma: Rate of change of Delta.
Theta: Time decay impact.
Vega: Sensitivity to volatility changes.
Rho: Sensitivity to interest rates.
Greeks help traders build and manage complex strategies.

ETH LONG ETH long, buy at 4200 SL IS 4100 TARGET WILL BE 4500
ALL OFF THE NUMBERS ARE IN ROUND Figure
Don't avoid, it is a technical and phycological trade
Let's see guys ,how ETH will perform

What Are Trading Orders? A Beginner’s Guide1. Introduction to Trading Orders
A trading order is essentially an instruction from a trader to a broker or trading platform to buy or sell a financial instrument. Trading orders tell the broker:
What to trade (stock, commodity, currency, etc.)
How much to trade (quantity or lots)
When to trade (immediately or under certain conditions)
At what price (market price or specific price level)
Without an order, no trade can occur. Orders are the bridge between your trading strategy and execution in the market.
1.1 Why Trading Orders Matter
Trading orders are not just procedural—they affect your trading results. Correct order selection can:
Improve execution speed
Reduce slippage (difference between expected and actual price)
Control risk (through stop losses or limit orders)
Allow automation of trades for efficiency
Traders who understand how to use orders effectively can manage trades systematically rather than relying on guesswork or emotion.
1.2 Key Components of a Trading Order
Every trading order typically includes the following:
Type of Order: Market, limit, stop, etc.
Quantity/Size: How many shares, lots, or contracts to buy/sell.
Price Specification: At what price the order should be executed.
Duration/Validity: How long the order remains active (e.g., day order, GTC).
Special Instructions: Optional features like “all or none” (AON) or “immediate or cancel” (IOC).
Understanding these components ensures traders can communicate their intentions clearly to the market.
2. Types of Trading Orders
Trading orders can be broadly divided into market orders, limit orders, stop orders, and advanced orders. Each has distinct characteristics and uses.
2.1 Market Orders
A market order is an instruction to buy or sell immediately at the current market price. Market orders prioritize speed of execution over price.
Advantages:
Fast execution
Guaranteed to fill if liquidity exists
Disadvantages:
Price uncertainty, especially in volatile markets
Potential for slippage
Example:
You want to buy 100 shares of XYZ Corp, currently trading at ₹500. Placing a market order will buy shares at the next available price, which could be slightly higher or lower than ₹500.
2.2 Limit Orders
A limit order specifies the maximum price to buy or minimum price to sell. The trade executes only if the market reaches that price.
Advantages:
Controls execution price
Useful in volatile markets
Disadvantages:
May not execute if price is not reached
Missed opportunities if price moves away
Example:
You want to buy XYZ Corp at ₹495. A limit order at ₹495 will only execute if the price drops to ₹495 or below.
2.3 Stop Orders
Stop orders become market orders once a specific price is reached. They are primarily used to limit losses or lock in profits.
Stop-Loss Order: Sells automatically to prevent further loss.
Stop-Buy Order: Used in breakout strategies to buy when a price crosses a threshold.
Example:
You hold shares of XYZ Corp bought at ₹500. To prevent large losses, you place a stop-loss at ₹480. If the price falls to ₹480, your shares are sold automatically.
2.4 Stop-Limit Orders
A stop-limit order is a combination of stop and limit orders. Once the stop price is triggered, the order becomes a limit order instead of a market order.
Advantages:
Provides price control while using stops
Reduces risk of selling too low in volatile markets
Disadvantages:
Risk of not executing if price moves quickly beyond limit
Example:
Stop price: ₹480, Limit price: ₹478. If XYZ Corp drops to ₹480, the order becomes a limit order to sell at ₹478 or better.
2.5 Trailing Stop Orders
A trailing stop is dynamic, moving with the market price to lock in profits while limiting losses.
Useful for locking gains in trending markets
Automatically adjusts stop price as market moves favorably
Example:
You buy shares at ₹500 and set a trailing stop at ₹10. If the stock rises to ₹550, the stop automatically moves to ₹540. If the price then falls, the trailing stop triggers at ₹540.
2.6 Other Advanced Orders
One-Cancels-Other (OCO) Orders: Executes one order and cancels the other automatically. Useful for breakout or range trades.
Good Till Cancelled (GTC) Orders: Remain active until manually canceled.
Immediate or Cancel (IOC): Executes immediately, cancels unfilled portion.
Fill or Kill (FOK): Executes entire order immediately or cancels it completely.
These advanced orders allow traders to automate strategies and manage risk efficiently.
3. Order Duration and Validity
Trading orders are not indefinite. Traders must choose a duration for each order:
Day Order: Expires at market close if not executed.
Good Till Cancelled (GTC): Stays active until filled or manually canceled.
Good Till Date (GTD): Active until a specified date.
Immediate or Cancel (IOC): Executes immediately or cancels unfilled portion.
Choosing the right duration affects execution probability and risk management.
4. Choosing the Right Order Type
Choosing the appropriate order type depends on trading goals, market conditions, and risk tolerance.
For beginners: Market and limit orders are easiest to use.
For risk management: Stop-loss and trailing stops are essential.
For advanced strategies: OCO, FOK, and GTC orders help automate trades.
Key Considerations:
Market volatility
Liquidity of the asset
Time available to monitor trades
Risk tolerance
5. Practical Examples of Trading Orders
Let’s examine some real-life trading scenarios:
Buying at Market Price: You want instant execution for 50 shares of Infosys. Place a market order; shares execute at the best available price.
Buying at a Discount: You want to buy 50 shares of Infosys if the price falls to ₹1500. Place a limit order at ₹1500; the order executes only if the price drops.
Protecting Profits: You bought shares at ₹1500. To lock gains, you place a trailing stop at ₹50. If the price rises to ₹1600, the stop moves to ₹1550, securing profits if the price falls.
Breakout Strategy: You expect Infosys to rise above ₹1600. Place a stop-buy order at ₹1600. If the price crosses ₹1600, the order triggers and you enter the trade.
6. Risks and Considerations
Trading orders are powerful but not foolproof. Common risks include:
Slippage: Execution at a worse price than expected.
Partial fills: Only part of the order executes.
Liquidity risk: Low trading volume can prevent execution.
Overuse of stops: Placing stops too close may trigger premature exits.
Emotional trading: Avoid constantly changing orders based on fear or greed.
Mitigating these risks involves planning, strategy, and disciplined execution.
7. Technology and Trading Orders
Modern trading platforms have transformed order execution:
Electronic trading: Fast, accurate, with minimal human error.
Algorithmic trading: Automates orders based on pre-defined criteria.
Mobile trading apps: Allow order management on the go.
APIs: Enable advanced traders to execute complex strategies programmatically.
Technology makes trading more efficient but requires understanding to avoid mistakes.
8. Tips for Beginners
Start with market and limit orders.
Use stop-loss orders to manage risk.
Understand order duration and use GTC orders cautiously.
Avoid overcomplicating trades with too many advanced orders initially.
Practice on demo accounts before real capital.
Keep a trade journal to track order types, outcomes, and lessons.
Conclusion
Trading orders are the foundation of every trade. They bridge your strategy and market execution, determine price, timing, and risk control. Understanding the different types—market, limit, stop, stop-limit, trailing stops, and advanced orders—allows traders to execute strategies systematically. Combining the right order types with risk management, technology, and discipline empowers beginners to trade confidently and efficiently.
In essence, mastering trading orders is mastering the mechanics of trading. Without it, even the best strategies may fail. With it, even a novice trader can navigate financial markets with clarity and purpose.
Option Chain AnalysisChapter 1: Basics Refresher
1.1 What is an Option Chain?
An option chain (or option matrix) is a tabular display of all option contracts for a particular stock or index. It is split into two halves:
Left side → Call Options (CE)
Right side → Put Options (PE)
Middle → Strike Prices
For each strike, the chain shows data such as Open Interest (OI), Volume, Last Traded Price (LTP), Bid/Ask, Change in OI, and Implied Volatility (IV).
1.2 Why Do We Analyze It?
Option chain analysis provides traders with:
Market sentiment (bullish, bearish, or neutral).
Probable support and resistance levels.
Identification of fresh positions vs unwinding.
Volatility expectations.
Clues for strategy selection (directional or non-directional).
Chapter 2: Core Components in Option Chain Analysis
2.1 Open Interest (OI)
Represents outstanding contracts not yet squared off.
High OI at a strike → strong trader interest.
Change in OI indicates new positions or unwinding.
👉 Key use in analysis:
Highest Put OI → Likely support.
Highest Call OI → Likely resistance.
2.2 Volume
Shows contracts traded during the current session.
High Volume + Rising OI → New positions building up.
High Volume + Falling OI → Unwinding/covering.
2.3 Implied Volatility (IV)
Reflects expected volatility of the underlying.
High IV → Options expensive; suitable for option writing.
Low IV → Options cheaper; suitable for buying strategies.
2.4 Price (Premium) Movement
If premiums rise with OI → trend continuation.
If premiums fall with OI → trend weakening.
2.5 Put Call Ratio (PCR)
Formula: Total Put OI ÷ Total Call OI.
PCR > 1 → More puts → bullish bias.
PCR < 1 → More calls → bearish bias.
Chapter 3: Interpreting Option Chain Data
3.1 Support & Resistance Identification
Support: Strikes with highest Put OI (buyers willing to defend).
Resistance: Strikes with highest Call OI (sellers capping upside).
Example:
If NIFTY is at 20,000:
19,800 Put has highest OI → Support.
20,200 Call has highest OI → Resistance.
3.2 OI and Price Analysis
Price ↑ + OI ↑ → Long Build-up.
Price ↓ + OI ↑ → Short Build-up.
Price ↑ + OI ↓ → Short Covering.
Price ↓ + OI ↓ → Long Unwinding.
This is one of the most powerful interpretations for intraday and positional trading.
3.3 IV Analysis
Rising IV + Rising Premiums → Traders expect big moves.
Falling IV + Rising Premiums → Unusual demand-driven move.
Chapter 4: Techniques of Option Chain Analysis
4.1 Strike-Wise Analysis
Look at individual strikes for OI and volume changes.
Identify where traders are adding fresh bets.
4.2 ATM (At-the-Money) Analysis
ATM strikes reflect the most balanced and sensitive positions.
Changes in ATM OI provide clear sentiment direction.
4.3 OTM (Out-of-the-Money) Analysis
Helps identify speculation and event-based positioning.
Example: Traders buying far OTM Calls before results → Bullish bets.
4.4 PCR Interpretation
Overall PCR for market view.
Strike-wise PCR for specific zones.
Chapter 5: Option Chain Analysis for Strategies
5.1 Directional Strategies
Bullish sentiment → Buy Calls, Sell Puts, Bull Call Spread.
Bearish sentiment → Buy Puts, Sell Calls, Bear Put Spread.
5.2 Neutral / Range-Bound Strategies
If highest Put OI and Call OI are close → sideways view.
Strategies: Iron Condor, Short Straddle, Short Strangle.
5.3 Volatility-Based Strategies
High IV → Option writing (Iron Fly, Short Straddle).
Low IV → Option buying (Long Straddle, Long Strangle).
Chapter 6: Practical Example (NSE NIFTY)
Imagine NIFTY trading at 20,000.
Highest Put OI at 19,800 → Support.
Highest Call OI at 20,200 → Resistance.
PCR = 1.3 → Slightly bullish.
Interpretation:
NIFTY likely to trade between 19,800–20,200 for now.
Strategy: Iron Condor within the range.
Chapter 7: Institutional vs Retail Approach
Retail traders: Focus on LTP, volume, ATM strikes.
Institutions: Focus on OI buildup, hedging positions, volatility skew.
Market makers: Use Greeks + IV to balance exposures.
Chapter 8: Advanced Insights
8.1 Option Chain + Technical Analysis
Combining chart support/resistance with OI data makes levels stronger.
8.2 Option Chain Before Events
Earnings, Fed meetings, budget → OI shifts + IV spikes.
Typically, IV crashes after event (“IV crush”).
8.3 Skew Analysis
Sometimes far OTM puts have higher IV than calls → sign of bearish protection demand.
Chapter 9: Mistakes Traders Make
Blindly following “highest OI” without context.
Ignoring IV while analyzing premiums.
Trading illiquid strikes (low OI/volume).
Misinterpreting PCR extremes (can signal contrarian trades).
Over-relying on option chain without considering news/technical charts.
Chapter 10: Step-by-Step Guide for Beginners
Open NSE Option Chain for the underlying.
Note the spot price.
Identify ATM strike.
Look at highest Put OI (support).
Look at highest Call OI (resistance).
Check PCR for sentiment.
Track OI + Price changes intraday for direction.
Select a strategy (buy/sell options, spreads, or non-directional).
Chapter 11: Benefits of Option Chain Analysis
Provides real-time market sentiment.
Identifies key support/resistance zones.
Helps in strategy selection.
Useful for hedging positions.
Assists in intraday, swing, and positional trading.
Chapter 12: Limitations
Works best in liquid instruments (NIFTY, BANKNIFTY).
Can give false signals during low volume sessions.
Sudden news/events can override OI patterns.
Requires constant monitoring (dynamic data).
Conclusion
Option Chain Analysis is a trader’s X-ray machine—it reveals what the surface charts don’t show. By analyzing open interest, volume, IV, and PCR, traders can spot where the market is placing its bets. This helps identify support/resistance levels, predict short-term trends, and craft strategies suited for directional, range-bound, or volatile markets.
For beginners, the option chain may initially look complex. But with practice, patterns emerge, and it becomes one of the most reliable tools for decision-making. For professionals, it’s an indispensable part of daily trading.
In the end, option chain analysis is not just about numbers—it’s about reading the collective psychology of market participants and positioning oneself accordingly.

Part 1 Ride The Big MovesIntroduction to Options Trading
Options trading is a sophisticated financial practice that allows investors to speculate on the future price movements of underlying assets or to hedge existing positions. Unlike direct stock trading, options provide the right—but not the obligation—to buy or sell an asset at a predetermined price within a specified time frame. This flexibility makes options a powerful tool in modern financial markets, used by retail traders, institutional investors, and hedge funds alike.
Options fall under the category of derivatives, financial instruments whose value is derived from an underlying asset, which can be stocks, indices, commodities, currencies, or ETFs. The two fundamental types of options are call options and put options.
1. Call and Put Options
Call Option: A call option gives the buyer the right to buy the underlying asset at a specific price (known as the strike price) before or on the option’s expiration date. Traders purchase calls when they expect the asset’s price to rise. For example, if a stock is trading at ₹100, and you buy a call option with a strike price of ₹105, you will profit if the stock price exceeds ₹105 plus the premium paid.
Put Option: A put option gives the buyer the right to sell the underlying asset at the strike price. Traders buy puts when they anticipate a decline in the asset’s price. For instance, if the same stock is at ₹100, a put option with a strike price of ₹95 becomes valuable if the stock price falls below ₹95 minus the premium paid.
The option seller (writer), on the other hand, assumes the obligation to fulfill the contract if the buyer exercises the option. Sellers earn the option premium upfront but take on potentially unlimited risk, especially in the case of uncovered calls.
2. Key Terms in Options Trading
Understanding options requires familiarity with several technical terms:
Strike Price: The predetermined price at which the underlying asset can be bought (call) or sold (put).
Expiration Date: The last date on which the option can be exercised. Options lose value after this date.
Premium: The price paid to purchase the option, influenced by intrinsic value and time value.
Intrinsic Value: The difference between the underlying asset’s price and the strike price if favorable to the option holder.
Time Value: The portion of the premium reflecting the probability of the option becoming profitable before expiration.
In-the-Money (ITM): A call is ITM if the underlying price > strike price; a put is ITM if the underlying price < strike price.
Out-of-the-Money (OTM): A call is OTM if the underlying price < strike price; a put is OTM if the underlying price > strike price.
At-the-Money (ATM): When the underlying price ≈ strike price.

Volatility Index (India VIX) Trading1. Introduction to Volatility and VIX
Volatility is the statistical measure of the dispersion of returns for a given security or market index. In simpler terms, it indicates how much the price of an asset swings, either up or down, over a period of time. Volatility can be driven by market sentiment, economic data, geopolitical events, or unexpected corporate announcements.
The India VIX, or the Volatility Index of India, is a real-time market index that represents the expected volatility of the Nifty 50 index over the next 30 calendar days. It is often referred to as the "fear gauge" because it tends to rise sharply when the market anticipates turbulence or uncertainty.
High VIX Value: Indicates high market uncertainty or expected large swings in Nifty.
Low VIX Value: Indicates low expected volatility, reflecting a stable market environment.
India VIX is calculated using the Black–Scholes option pricing model, taking into account the price of Nifty options with near-term and next-term expiry. This makes it a forward-looking indicator rather than a retrospective measure.
2. Significance of India VIX in Trading
India VIX is not a tradeable index itself but a crucial sentiment and risk gauge for traders. Its applications in trading include:
Market Sentiment Analysis:
Rising VIX indicates fear and uncertainty. Traders may reduce equity exposure or hedge portfolios.
Falling VIX suggests calm markets and often coincides with bullish trends in equity indices.
Risk Management:
Portfolio managers and traders use VIX levels to determine stop-loss levels, hedge sizes, and option strategies.
Predictive Insights:
Historical data shows that extreme spikes in VIX often precede market bottoms, and extremely low VIX levels may indicate complacency, often preceding corrections.
Derivative Strategies:
India VIX futures and options are actively traded, providing opportunities for hedging and speculative strategies.
3. How India VIX is Calculated
Understanding the calculation of VIX is essential for professional trading. India VIX uses a methodology similar to the CBOE VIX in the U.S., which focuses on expected volatility derived from option prices:
Step 1: Option Selection
Nifty call and put options with near-term and next-term expiries are chosen, typically out-of-the-money (OTM).
Step 2: Compute Implied Volatility
Using the prices of these options, the market’s expectation of volatility is derived through a modified Black–Scholes formula.
Step 3: Weighting and Smoothing
The implied volatilities of different strike prices are combined and weighted to produce a single expected volatility for the next 30 days.
Step 4: Annualization
The resulting number is annualized to reflect volatility in percentage terms, expressed as annualized standard deviation.
Key Point: India VIX does not predict the direction of the market; it only predicts the magnitude of expected moves.
4. Factors Influencing India VIX
India VIX moves based on a variety of market, economic, and geopolitical factors:
Market Events:
Sudden crashes or rallies in Nifty significantly affect VIX.
For example, a 2–3% overnight fall in Nifty can spike VIX by 10–15%.
Economic Data:
GDP growth announcements, inflation data, interest rate decisions, and corporate earnings influence volatility expectations.
Global Events:
US Fed decisions, crude oil volatility, geopolitical tensions (e.g., wars, sanctions) impact India VIX.
Market Liquidity:
During thin trading sessions or holidays in global markets, implied volatility in options rises, increasing VIX.
Investor Behavior:
Panic selling, FII flows, and retail sentiment shifts can drive VIX up sharply.
5. Trading Instruments Related to India VIX
While you cannot directly trade India VIX like a stock, several instruments allow traders to gain exposure to volatility:
5.1. India VIX Futures
Traded on NSE, futures contracts allow traders to speculate or hedge against volatility.
Futures are settled in cash based on the final India VIX value at expiry.
Contract months are usually current month and next two months, allowing short- to medium-term strategies.
5.2. India VIX Options
Like futures, VIX options are European-style options, cash-settled at expiry.
Traders can use calls and puts to bet on rising or falling volatility.
Options provide leveraged exposure, but risk is high due to volatility’s non-directional nature.
5.3. Equity Hedging via VIX
VIX can be used to structure protective strategies like buying Nifty puts or using collars.
When VIX is low, hedging costs are cheaper; when high, it is expensive.
6. Types of India VIX Trading Strategies
6.1. Directional Volatility Trading
Buy VIX Futures/Options when anticipating a sharp market drop or increased uncertainty.
Sell VIX Futures/Options when expecting market stability or a decrease in fear.
6.2. Hedging Equity Portfolios
Traders holding Nifty positions may buy VIX calls or futures to protect against sudden drops.
Example: If you hold long Nifty positions and expect a 1-week correction, buying VIX futures acts as an insurance.
6.3. Spread Trading
Calendar Spreads: Buy near-month VIX futures and sell next-month futures to profit from volatility curve changes.
Option Spreads: Buying a call spread or put spread on VIX options reduces risk while maintaining exposure to expected volatility moves.
6.4. Arbitrage Opportunities
Occasionally, disparities between VIX and realized volatility in Nifty options create arbitrage opportunities.
Advanced traders monitor mispricing to exploit short-term inefficiencies.
6.5. Mean Reversion Strategy
India VIX is historically mean-reverting. Extreme highs (>30) often come down, while extreme lows (<10) eventually rise.
Traders can adopt counter-trend strategies to capitalize on reversion toward the mean.
7. Risk Factors in VIX Trading
High Volatility:
While VIX measures volatility, the instrument itself is volatile. Sharp reversals can occur without warning.
Complex Pricing:
Futures and options on VIX depend on implied volatility, making pricing sensitive to market dynamics.
Liquidity Risk:
VIX options and futures have lower liquidity than Nifty, potentially leading to wider spreads.
Non-Directional Nature:
VIX measures magnitude, not direction. A rising market can spike VIX if the potential for sharp swings exists.
Event Risk:
Unexpected macroeconomic or geopolitical events can lead to sudden spikes.
8. Conclusion
India VIX trading is a highly specialized, nuanced field combining market sentiment analysis, technical skills, and risk management acumen. While it offers opportunities to profit from volatility and hedge equity exposure, it also carries substantial risks due to its non-linear, non-directional, and highly sensitive nature.
To succeed in India VIX trading, one must:
Understand the underlying calculation and drivers of volatility.
Combine VIX insights with market structure and macroeconomic analysis.
Adopt disciplined risk management practices, including stop-losses and position sizing.
Stay updated with global and domestic events impacting market sentiment.
For traders and investors, India VIX is more than a “fear gauge.” It is a strategic tool that provides a unique window into market psychology, enabling better-informed decisions in both trading and portfolio management.