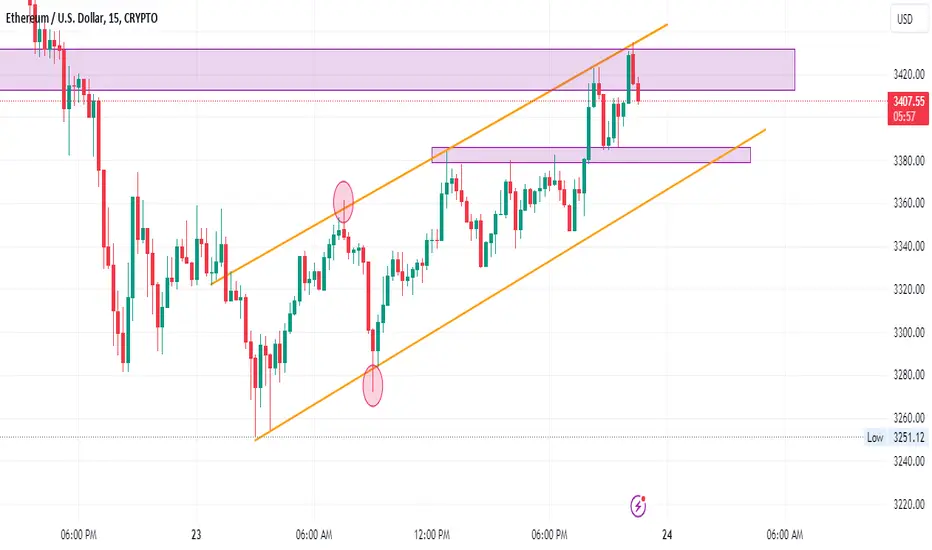
Ethereum is Critical levelEthereum Critical level, Ethereum is at important level and Forming a Channel Pattern Let's see this sustain or not. what is your view please comment it down. We are NISM Certified. All views shared on this channel are my personal opinion and is shared for educational purpose and should not be considered advise of any nature.
ETHUSD.P trade ideas

ETHUSD IMPORTANT LEVELETHUSD Which is showing a great opportunity ETHUSD is at important level and showing weakness. what is your view please comment it down. We are NISM Certified. All views shared on this channel are my personal opinion and is shared for educational purpose and should not be considered advise of any nature.

Ethereum Shorting CMP 4068$ Target 4000- 3960- 3920-3900-3880-3Ethereum Shorting CMP 4068$
Target 4000- 3960- 3920-3900-3880-3850-3820+
Sl above 4100 - 15 min candle closing basis

ETHUSD at Critical LevelETHUSD Which is showing a great opportunity ETHUSD is at make it or break it Level. what is your view please comment it down. We are NISM Certified. All views shared on this channel are my personal opinion and is shared for educational purpose and should not be considered advise of any nature.

The Ethereum crypto appears to be geared to keep on going upwardThe Ethereum on Tuesday 12th shows a pause in price after a splendid long run in the northward direction. As of Wednesday 13th, the current market price (CMP) is $4036.3, representing a 1.45% intraday increase, and is showing bullish traits for more growth in future sessions. It has demonstrated good performance in the past week by 13.54%, month by 61.09%, and three months by 78.70%, indicating a reliable upward trend.
Since the ETH crypto has displayed a prime price rally from a critical level of around $2900 on the chart and showing sustenance signs at another critical level at a $4000 price level. This price structure on the daily chart shows that Ethereum has the potential to surpass its all-time-high level, similar to Bitcoin.
The Ethereum crypto appears to be geared to keep on going upwards on this remarkable price rally after it recently paused at the $4000 level on Tuesday. Now, it seems mobilizing its buying force again to overcome the resistance level of the next supply zone around $4600 and ascend to new.
Moreover, the crypto asset has shown a bullish strength already by giving a bullish rally so far, and more rising potential lurking on the ETH chart as it stays above major 20, and 50-day EMA's.
Therefore, the Ethereum price prediction highlights that, if the price manages to thrust above by carrying solid buying volume, then the next possible targets could be $4400 and $4600, respectively.
However, if the crypto price fails to stay above $4000, it could decline to $3800, starting a downtrend. The next support would then be $3400.

ETHUSD 30MEthusdt 🤑 momentum trend
Uptrend buy signal
Focus trade 30 min upside trade 1/7 ratio trade

a qquick sclap tread in ethirium a quick scalp trad can be placed in eth in smaller timefrem 5 min
take a entry at 3920 and targeet will be 3950 first target and after that trail according to your riskappetite
sl willbe 3912.5

ETH Technical Analysis! Analyzing the ETH charts and expecting a breakout once the price crosses the $4951 resistance zone!

ETH BEARISH DIVERGENCE ETH is rejecting from this point becoz huge funding rate and bearish divergence and clearly needs correction to move more upwards.

ETHUSD is set for a new ATHPole and flag chart pattern breakout in ETHUSD. If the pattern succeeds than we can see a new upward rally.

Ethereum Long Term Analysis!Ethereum Long Term Analysis!
Ethereum Monthly Analysis!
Bearish Pennant PAttern formation in Ethereum on Monthy Timeframe!
If price breaks and closes below trendline support we can see further downmove in Ethereum
Ethereum is forming Bearish Pennant pattern. We can see a sharp downmove in Ethereum from 1 dec 2021 after that price is moving in that way like it is forming a Triangle. So the pattern is established. Many of us won't believe for a Ethereum to move this much downward upto 456.75USD. But it's all about Technical Analysis and Pattern identification. I have identified this pattern on Monthly Timeframe. This is how we identify pattern on various timeframe. Greater the timeframe more reliable it would be, So i have done my analysis on Monthly timeframe to predict long term move of an Ethereum. Crypto is very uncertain instrument so we can't imagine how it will move, right? But this is how we perform technical analysis! That's all i have to say!
The downward possible target for an Ethereum is 456.75 USD!

1 Day Time Frame ETH/USD Trend Analysis1 Day Time Frame ETH/USD Trend Analysis. Currently after hitting 3000 Levels on 20th Feb, ETH has been witnessing some profit booking and some correction. If the correction continues we may see levels of 2700 post which Bulls may again take charge back and try to test the 3000 levels again in ETH/USD

BUY ETH with 2 point take profitBuy ETH now
PP:
Trap price
Stoploss and TP in this picture
Good luck!

ETH FORMED HEAD AND SHOULDER PATTERN Eth formed head and sholders along with bearish divergence, so next levels are 2795 level, if breaks further down side also.

USDT.D FORMED INVERSE H & SUSDT.D clearly shows bullish view with inverse head and shoulder and triple bottom which makes movie til 5.35% causes crypto and btc to bleed for sometime.

ETH DOUBLE TOP Eth bearish :
1. Double top
2. Bearish divergence
Next support 2350 breaks will leads to 1950

ETH BEARISH SHARK AND BEARISH DIVERGENCE ETH BEARISH :
1. Bearish shark pattern
2. Bearish divergence
3. Trend line Support lost
Support: 2325 , 2275, 2175, 1950, 1875 and 1750 levels

ETH Long. As per upward trend and Support At Trend Line.Ethrium long position. As seeing current trend and Support At trend line , the technical analysis
Signals Direct towards Long Position.

Ethereum Ready for Another Dump till $1700 ?Ethereum Chart Technical Analysis CRYPTOCAP:ETH
Currently #ETHUSDT Trading at 4H Support Level.
1️⃣ If $2160 level breaks, ETH could drop to $1,750 (Scenario 1)
2️⃣ But if price bounces off $2,160, we could see a 5-10% relief rally. ( Scenario 2 )
My view:
- Bearish below $2,240
- SUPER bearish if $2,160 breaks!
Overall, #ETH is standing on thin ice at a very crucial support zone.
One break could lead to a cascade of selling.
Trade safe!

Movement to the downsideEthereum is looking for short after firing ascending channel & has a corrective formation for a clear move to the downside.


Ethereum (ETH) in a channel breakout Channel breakout
RSI above 70 and rising
Trading above EMA50
Volume increasing
