ETHEREUM TRADE IDEAS Hello friends here I am sharing the chart of Ethereum, so here I took the time frame of 4 hour as you can see the three different zone are there mentioned on chart (Resistance Zone, Breakout retest Zone, Demand Zone) So I am explaining my trading ideas for it below
IDEA 1-:
It will reach to breakout retest zone and will give a bounce from there to the resistance zone.
IDEA 2-:
If it will break support ( Breakout retest zone) and will got to next support mentioned as support 2 on chart and can go up for above levels after bounce.
-:Levels Price Are Mentioned Below
-:Breakout Retest & Support Zone ( Price 1916)
-:Resistance zone If Bounce From Support ( Price 2070)
-:Support 2 Zone ( Price 1833)
ETHUSD.P trade ideas

ETH WILL RISE TILL 2400 OR 2900ETH WILL touch 38.5% or 50% fib level after that we can expect correction from mid june to sep then will expect bull till halving like rocket move.
#Bitcoin #nft #bnb #eth #btc #BSC #Binance #trading #altcoins #cryptocurrency #crypto


Ethereum/USD Uptrend movement potential with RISK:REWARD 2.46Ethereum/USD Uptrend movement potential with RISK:REWARD 2.46
Symbol Ethereum/US dollar
Time frame :4 hours
Analysis :There is a break out from the symmetrical Triangle and the price is rallying on the up side .So, We will check the condition for Uptrend movement .Moving average ,MACD and PIVOT point condition is checked for uptrend movement. BUy call above 2025 which stop loss 1856 and we can expect a target of 2433.
HOPE our analysis is adding value to your Trading Journey.
NOTE: Published Ideas are for ‘’EDUCATIONAL PURPOSE ONLY’’ trade at your own risk.
NOTE: RESPECT The risk. SL should not be more than 2% of the capital.
Happy Trading

#Ethereum/USD downtrend movement potential with risk:reward 1.9#Ethereum/USD downtrend movement potential with risk:reward 1.9
Symbol :Ethereum / US dollar
Time frame :30 minutes
Analysis : Breakout from the support line and rallying on a down side.
Moving average 20 is below Moving average 40 and Macd is below zero.So, we can expect a down trend movement with risk:reward =1.9
Its a SELL call . SELL at 1825 with Stop-loss 1880 and the Target 1718 .
HOPE our analysis is adding value to your trading Journey.
NOTE: Published Ideas are for ‘’EDUCATIONAL PURPOSE ONLY’’ trade at your own risk.
NOTE: RESPECT The risk. SL should not be more than 2% of the capital.
Happy Trading

ETH BEARISHETH clearly loosing volume , so mostly we are going to see bleeding till 166 to 1550.
#Bitcoin #nft #bnb #eth #btc #BSC #Binance #trading #altcoins #cryptocurrency #crypto #sol

ETHUSDprice move to area of value and correlated to BITCOIN once get clear rejection focus for short

ETH Looks Clean for LONGETHUSD in day time frame with good volatility contraction, looking good for a long setup with tight stop. Risk Reward of at least 1:2 before trailing stops.

ETH FORMED SYMMETRICAL TRIANGLE Btc move will help eth to go upwards or downwards but eth fundamentally have strong indicator to go upside.
#Bitcoin #nft #bnb #eth #btc #BSC #Binance #trading #altcoins #cryptocurrency #crypto #sol


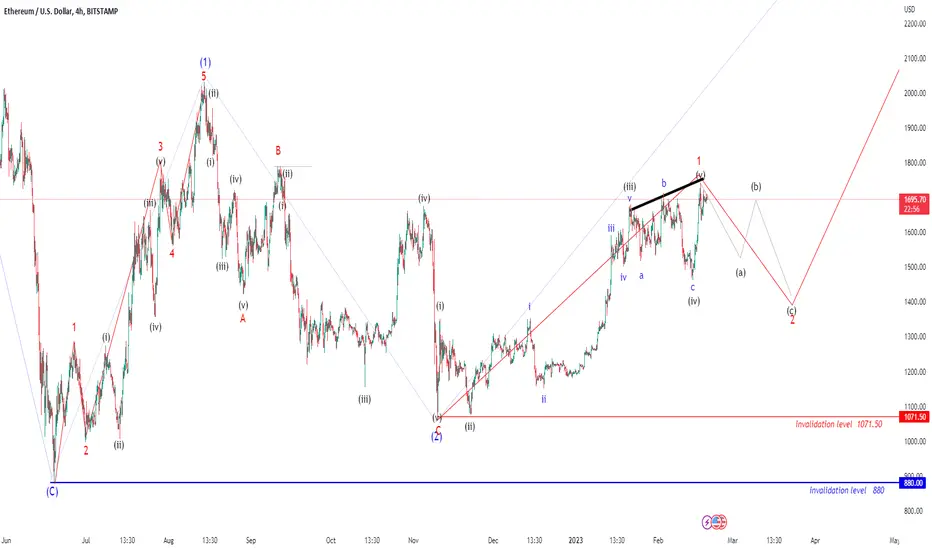
Ethereum possible Elliot wave counts Here we have shared possible Elliot wave counts of ETHUSD (for educational purpose only) which are suggesting correction for very short term and this correction can be used as good opportunity to go long for further trend which is expected post this correction, the invalidation level of further up move can be low of previous wave 1 which is pegged at 1071.50, if it breaks below this level then we can assume that our counting is missing something and we may invalidate this structure, Overall we are unfolding some impulse in which we had completed wave (1) and now possibly we are heading to unfold wave (2) and then, post correction we can start wave (3). wave (2) can unfold in three subdivisions like ABC and ABC can unfold in 5-3-5 structure or 3-3-5 structure. Lets see what happens next.
My studies are for educational purpose only.
Please Consult your financial advisor before trading or investing.
I am not responsible for any kinds of your profits and your losses.
Overall wave structure is shared below
Most investors treat trading as a hobby because they have a full-time job doing something else.
However, If you treat trading like a business, it will pay you like a business. If you treat like a hobby, hobbies don't pay, they cost you...!
Disclaimer.
I am not sebi registered analyst.
My studies are for educational purpose only.
Please Consult your financial advisor before trading or investing.
I am not responsible for any kinds of your profits and your losses.
Ethereum looks really bullish wooowHELLO dear Treaders :
After a very long time, ETH has reached the declining trend line that you can see in the chart and looks strongly bullish.
Since Nov 2021, when the bear market began and the price of bitcoin and others alt-coins started to drop from their all-time high, ETH price has hit this trend line, twice (as you can see in chart).
The first time, the price hit the decreasing trend line was at USD 3570, in Apr 2022 and the second time happened today at USD 1700.
In my opinion, ETH can reach higher prices after this bear market and in my point of view, there is a great opportunity to buy ETH at USD 1700 in spot (You can consider this buy position for your future trading but do not over leverage your positon!)
In daily time frame, ETH can break USD 1700 and start a new bull run.
The first ETH strong resistance line is around 2630/2650 and therefor until we reach that price point, do not over leverage your positions and be careful about future trading.

Ethereum ETH monthly line five wavesEthereum ETH monthly line five waves, logarithmic coordinates monthly line large-scale five wave model

ETHUSD - Time to go up?If you look at the monthly chart of ETHUSD, you will notice that the price is at discount zone and has hit an important Discount Array (FVG). It has reached the 50% of the FVG and reacted in a positive way.
Now we need to look at lower timeframes (1 Week and 1 Day) to see if price is willing to go higher.
Now this would be the right time to Invest if we see signs of price wanting to go higher.
This is just my personal view on ETHUSD. Please do your own research before taking any decisions.

Ethereum ready to break resistance near $1680.Ethereum has broken and sustained above the resistance of $1620. There was a stiff resistance at $1680, which failed to break on Feb 02, 2023, and Feb 04, 2023. It has crossed that level just now, but the chances of a false breakout are high now. Any move above $1685 today will clearly indicate a new uptrend.

Ethereum bullish trade Ethereum stands at a make or break level of resistance on daily time frame . It will either give a massive breakout and break the resistance or it will make a double top and start to collapse . This crucial level is to be tracked as we can get good targets on either side .
Hope this analysis will help you :)

ETHEREUM - Elliott Wave ViewThe idea is based on the Elliott Wave Theory. It suggests that the correction cycle may be over and the next bullish cycle could begin from here.


Ethereum Large Level Parallel ChannelEthereum ETH large level parallel channel, red circle top, green circle bottom.

ETH-USD Monkey IdeaSeriously. Although the man in the yellow hat seemed to do pretty well, his financial situation didn't fill the hole in his heart that he had for Maggie.
Find a monkey, beat the market.

BTC WILL BLEED FOR SOMETIME Btc again moving to its imp liquidity area 16500 zone then we can see the direction path as of now little bearesh

$FOLD drop potential$FOLD token could go lower
11.4 must hold but taking into account the counts on the way down, I don't think it will
