Part 2 Intraday Trading Master ClassWhy Do People Trade Options?
Option trading is popular for four major reasons:
1. Hedging
Investors use options to protect their portfolio against downside risk.
Example: Buying a put acts like insurance against a crash.
2. Leverage
Options allow you to control large positions with small capital.
A ₹1 lakh equity position may require only ₹2,000–₹5,000 in option premiums.
3. Income Generation
Option sellers earn premium income in range-bound markets.
4. Speculation
Traders profit from directional moves (up or down), volatility changes, or time decay.
Trade ideas

Crypto Asset Secrets: Fundamental Dynamics, Structural Realities1. Liquidity Is the Real Power in Crypto
The biggest secret in crypto markets is that price is controlled by liquidity, not popularity.
Most newcomers focus on:
News
Social media hype
Project fundamentals
Influencers
But markets move when large buyers or sellers enter low-liquidity environments. Liquidity gaps can produce:
Rapid pumps
Flash crashes
Stop-loss hunts
“Wick” volatility that destroys leveraged positions
A coin with a $500 million market cap can still move violently if daily trading volume is thin. In crypto, the book depth (available orders) matters far more than market cap.
Key point:
Low liquidity = high manipulation potential.
2. Whales Shape Most Major Market Moves
In stock markets, institutions dominate. In crypto, large holders—“whales”—play an even bigger role.
Whales can:
Move prices by placing large buy/sell walls
Trigger liquidation cascades
Create fear or euphoria with timed transactions
Exploit precise liquidity zones around funding cycles
Their strategies include:
Spoofing (placing fake orders to influence sentiment)
Wash trading (creating artificial volume)
Accumulation/distribution cycles
Stop-hunting via sudden volatility
Blockchain transparency exposes whale movements, but interpreting them correctly is an art.
Secret:
Following whale wallets often reveals market direction before retail sees it.
3. Market Makers Quietly Control the Order Flow
Market makers (MMs) provide liquidity to exchanges, but they also shape price behaviour.
Their influence includes:
Maintaining spreads
Absorbing buy/sell pressure
Moving price to areas with highest liquidity (liquidation zones)
Hedging risk across spot, futures, and options
In crypto, many market makers act with more flexibility than traditional finance because regulation is looser.
MMs often engineer:
Range-bound price action
Breakouts toward liquidity pools
Sudden volatility to rebalance exposures
Secret:
If you watch where liquidity pools form (using heatmaps or liquidation charts), you can anticipate MM moves.
4. Most Altcoins Inflate Through Token Unlocks
The majority of altcoin investors don’t know that token unlocking schedules dilute price over time.
Even strong projects follow emission schedules:
Team vesting
Private sale unlocks
Ecosystem incentives
Liquidity injections
These can release millions of tokens into circulation—sometimes monthly or even weekly.
This creates constant sell pressure.
Secret:
You must study tokenomics before touching an altcoin. Fully diluted valuation (FDV) is often more important than current price.
5. Centralized Exchanges Have Enormous Hidden Power
Crypto is marketed as decentralized, but trading is 90% dependent on centralized exchanges (CEXs).
Exchanges control:
Order books
Liquidation engines
Funding rates
Front-end data feeds
Risk management algorithms
Sometimes, exchanges:
Adjust leverage availability
Close off withdrawals during volatility
Run maintenance at “mysterious” times
Remain opaque about reserves
Some even act as market makers for their own platforms.
Secret:
Understanding exchange mechanics is essential. The exchange is always the house—and the house rarely loses.
6. Liquidation Cascades Move the Market More Than News
Crypto futures markets have massive leverage (up to 100x), causing forced buying and selling when prices hit certain levels.
The hidden force: liquidation engines.
When many traders are long with high leverage:
Price drop → forced sell orders
Forced sell orders push price down more
More traders get liquidated
A cascade forms
This also happens with shorts during squeezes.
This explains why crypto often moves:
10% in minutes
Without any news
At perfectly predictable liquidity levels
Secret:
Liquidation maps show where cascades may occur. Price often hunts these zones.
7. On-Chain Data Reveals the Truth Behind the Charts
Traditional markets hide data. Crypto exposes everything on-chain:
Wallet holdings
Exchange inflows/outflows
Long-term holder behaviour
Staking metrics
Miner activity
Smart contract interactions
If you know how to read:
NVT ratio
MVRV
Exchange reserves
Realized price bands
Whale accumulation patterns
…you can detect real momentum before price reacts.
Secret:
Charts lie. On-chain data doesn’t.
8. Narrative Cycles Drive Altcoin Seasons
Every major rally has a narrative:
DeFi Summer
NFT Boom
Layer-1 Wars
Meme coin mania
AI tokens
Real-world assets (RWA)
Liquid Staking Tokens (LST)
Investors rotate money from one narrative to the next. These narratives often appear months before the public notices.
Smart investors track:
Developer activity
Ecosystem funding
Partnerships
VC trends
Secret:
Narratives drive capital flows. Capital flows drive price.
9. Most Crypto Gains Happen in Short Bursts
Studies show that less than 10 trading days per year often produce the majority of bitcoin’s returns.
Reasons:
Halving-driven supply shocks
Macro cycles
FOMO waves
Short squeezes
Liquidity gaps
Missing just a few days can mean missing the entire bull run.
Secret:
The market rewards patience and punishes overtrading.
10. Security Is the Most Overlooked Crypto Secret
Most people focus on price, not protection. Yet the fastest way to lose everything is through:
Phishing attacks
Private key leaks
Smart contract exploits
Rug pulls
Exchange hacks
Proper security includes:
Hardware wallets
Multi-sig accounts
Avoiding suspicious sites
Using separate wallets for risky assets
Secret:
In crypto, custody = control. If you don’t own your keys, you don’t own your coins.
11. Macroeconomic Cycles Still Control Crypto
Despite its futuristic image, crypto reacts strongly to:
Interest rates
Liquidity conditions
Bond yields
Dollar strength
Risk-on/risk-off cycles
Bitcoin behaves like a high-beta macro asset.
When global liquidity expands, crypto thrives.
When liquidity contracts, crypto bleeds.
Secret:
Crypto is free-spirited, but not independent from global finance.
12. The Halving Cycle Is Not Magic—It’s Economics
Bitcoin halvings reduce new supply by 50%.
This supply shock:
Reduces miner selling pressure
Alters long-term market psychology
Triggers new speculative phases
This creates 4-year boom-bust cycles.
It’s not magic—it’s simple scarcity economics mixed with human behaviour.
Secret:
Halving cycles still matter because supply psychology still matters.
Conclusion
The real “secrets” of crypto assets are not mystical or hidden behind paywalls. They are the deeper forces—liquidity mechanics, whale behaviour, on-chain transparency, tokenomics, exchange power, and macro cycles—that quietly dictate market structure.
Understanding these truths transforms how you see the market:
You stop chasing hype.
You learn to track liquidity.
You interpret whale moves.
You anticipate volatility.
You understand risk.
Crypto is still evolving, still volatile, and still experimental. But with knowledge of its inner workings, you gain clarity in a market where most remain confused.
Warning: $ETH Is About to Hit Its Most Critical Zone of 2025!Warning: CRYPTOCAP:ETH Is About to Hit Its Most Critical Zone of 2025!
Macro Structure
ETH remains macro bullish, currently in a healthy correction after rejecting the premium zone near $4,960.
The strong displacement from $1,577 (0.618 Fib) confirmed bullish structure, but price is now retracing into discount levels.
Key Fibonacci Levels
Measured from $879 → $4,960, ETH is deeply entering ICT discount territory:
0.382 – $3,048 (Tested)
0.500 – $2,622
0.618 – $2,256 ← Top probability zone
0.786 – $1,821
FVG & OB Zones (Major Decision Area)
1️⃣ Unfilled FVG → $2,875
👉 This is the most important decision point right now.
👉 High probability that ETH will fill this FVG.
👉 If price holds above this FVG, bullish continuation becomes very strong.
👉 If ETH fails to hold $2,875, expect the correction to deepen.
2️⃣ Next Major Support
Bullish OB: $2,622 – $2,256
→ Perfect confluence of Order Block + 0.5/0.618 Fib.
👉 This is the strongest demand zone on the entire chart and a top accumulation area.
Expectations
Most likely:
ETH fills the $2,875 FVG, then either bounces → resumes uptrend
or
breaks down → moves into $2,250–$2,620 OB to accumulate before the next macro leg.
Targets After Correction: $4,058 / $4,960 / $5,800 / $7,200 (1.618 extension)
Conclusion
ETH remains strongly bullish on HTF.
Watch $2,875 FVG as the key decision level.
If lost → $2,250–$2,620 OB becomes the premium accumulation zone before ETH heads toward new ATH.
NFA. DYOR.


Ethereum Short term recovery From NowBINANCE:ETHUSDT looks towrads short term long and going back to tap order Block have eye on Crypto assests after few Weeks looking forword for major correction.

ETH - 2 hour chart - Trend based Fibonacci Retracement Price took strong support from the green demand zone and bounced, starting a fresh upward move. This rally reached the Fibonacci 0.618–0.786 zone, where price faced resistance and started a pullback. During this pullback, a falling trendline formed, showing short-term selling pressure. Now price is moving between the 0.236 and 0.382 Fibonacci levels and is again testing the trendline from below. If price gives a clean breakout above this falling trendline and holds, it can continue its upward move toward higher Fibonacci levels. If the breakout fails, price may retest lower Fibonacci areas or even move back toward the support zone.
Entry: Buy on trendline breakout and retest around 3530–3550
Stop Loss: Below recent swing and Fibonacci 0.236 zone around 3450–3470
Targets:
• First target near 0.382 zone around 3600
• Second target near 0.5 zone around 3680
• Final target near 0.618–0.786 zone around 3750–3850
Disclaimer: This analysis is for educational purposes only and not financial advice. Always do your own research before trading or investing.

ETH - 1 Hour chart - LongPrice touched the trendline multiple times at points 1, 2, 3 and 4 and got rejected each time, showing that sellers were active on every move up. After this, the price took strong support from the green demand zone and bounced. Once the bounce came, price broke a small resistance and returned for a clean retest. The long entry was taken on this retest around 3505–3515, with the stop loss placed below the support zone near 3460–3470. The next major resistance around 3660–3670 was kept as the target. The idea behind the trade is simple: support held well, breakout happened, and the retest gave a low-risk buying opportunity.
Disclaimer: This analysis is for educational purposes only and not financial advice. Always do your own research before trading or investing.*

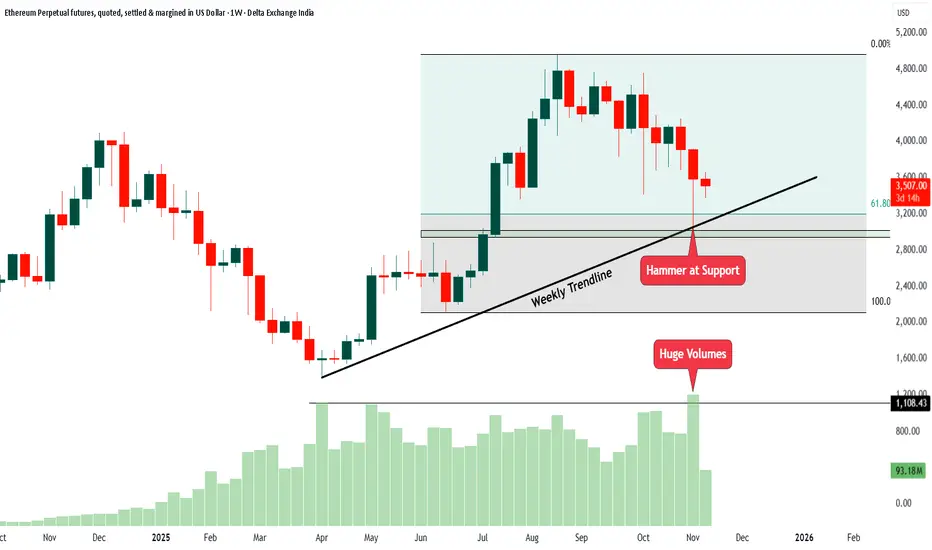
ETH Weekly Chart Analysis1. The price has been respecting a weekly trendline for many months. This trendline acts like a support line where buyers usually come in.
2. Recently, the price fell towards this same trendline and created a hammer candle. A hammer at support often shows that sellers pushed the price down, but buyers stepped in strongly and pulled it back up. This is usually a sign of buying interest.
3. The hammer candle formed exactly near the support zone and the Fibonacci 61.8 percent area. This area often works as a strong reversal point.
4. When the hammer candle formed, the volume was very high. Huge volume at support means big players were actively buying at lower levels.
5. The price is still inside a wide range between recent highs and lows. It has not broken out yet, but the support reaction is positive.
In simple words, the chart is showing a strong bounce setup from support with a hammer candle and high volume. This is a sign that buyers may try to take control again as long as the price stays above the trendline and support area.
“ETH Correction Path: Fall → Trap → Collapse → Rebirth”
🧠 ETH Big Picture Analysis | Multi-Leg Correction Ahead
Current Price: ~$3400
Ethereum appears to be setting up for a deeper corrective structure. From the current levels around $3400, I expect ETH to drop toward $2200, completing the first major leg down.
After that, a strong relief bounce could push the price back up to around $4100, trapping late bulls before the final capitulation phase.
Eventually, I expect ETH to bottom near the $1000 zone, aligning with a long-term accumulation area and potential macro reversal zone.
---
Key Levels to Watch:
🔻 Support: $2200 → $1000
🔺 Resistance: $4100
⚠️ Major Reversal Zone: $1000 - $1200
Summary:
Short-term bearish → Mid-term bullish bounce → Long-term deep correction before next bull cycle.
---
Headline Suggestion:
> “ETH Correction Roadmap: $3400 → $2200 → $4100 → $1000 | The Final Shakeout”
-

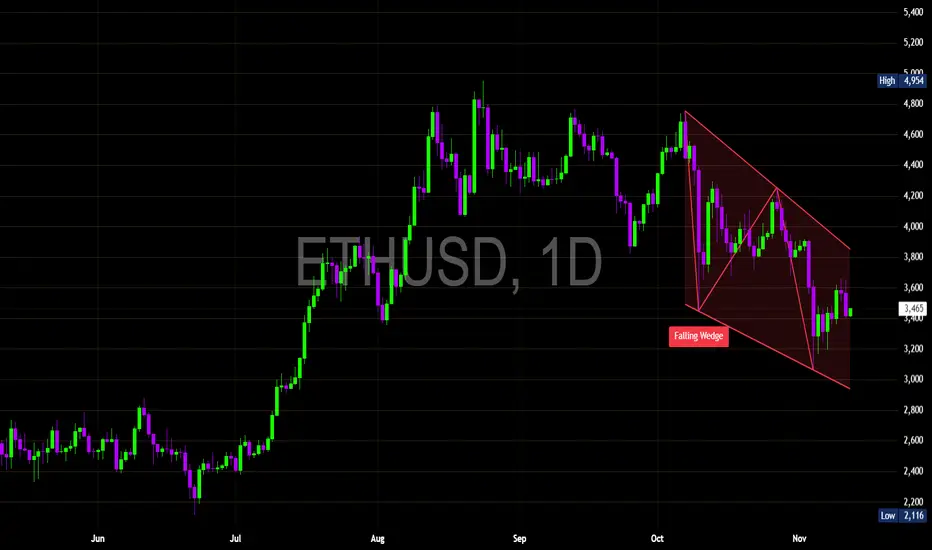
$ETH — Falling Wedge Forming on the Daily Chart ! CRYPTOCAP:ETH — Falling Wedge Forming on the Daily Chart !
#Ethereum has been consolidating within a Falling Wedge pattern since early October — a structure that often precedes a bullish reversal when confirmed with volume.
The wedge is tightening between $3,200 support and $3,700 resistance, forming lower highs and higher lows within a descending channel.
Historically, such formations break to the upside once selling pressure exhausts.
🔸️Support Zone: $3,200 → $3,000
🔹️Resistance Zone: $3,700 → $3,850
🔸️Breakout Confirmation: Daily close above $3,850 with rising volume may trigger a push toward $4,200 – $4,600, aligning with the top of the previous consolidation range.
🔹️Invalidation: Breakdown below $3,000 would signal extended downside toward $2,800.
#ETH is coiling inside a Falling Wedge, with bulls preparing to reclaim momentum if resistance breaks. A successful breakout could ignite a mid-term rally — but failure to hold $3,200 could extend the correction.
ETH/USD - Fair Value Gap Retracement with Historical Reactions📈 ETH/USD – Fair Value Gap Retracement and Support Line Interaction
Ethereum’s daily chart showcases a clear bearish market structure, marked by a consistent series of lower highs and lower lows.
Throughout this decline, multiple Fair Value Gaps (FVGs) have emerged, each reflecting price inefficiencies created by strong institutional sell-side displacement.
These historical FVGs — now visible above the current price — reveal how ETH has repeatedly retraced to fill prior imbalances before resuming its downward trajectory.
The latest setup forms yet another bearish FVG, potentially acting as a retracement zone before continuation.
⸻⸻⸻⸻⸻⸻⸻⸻⸻⸻
📊 Key Observations
1️⃣ Historic FVG Reaction – The previous FVG (around the mid-October region) acted as a powerful supply zone. Price retraced deeply into that imbalance, filled it almost completely, and then reversed sharply — validating the concept of FVG-based rebalancing before continuation.
2️⃣ Current FVG Setup – A new bearish Fair Value Gap has now formed following another strong sell-side impulse. This zone represents a fresh inefficiency that may attract retracement before the next move down.
3️⃣ Optimal Confirmation Depth – The best confirmation typically occurs when price retraces toward the high of the FVG.
Reaching the upper boundary indicates that buy-side liquidity has been tapped and unfilled institutional sell orders have likely been triggered, often preceding a sharp rejection.
4️⃣ Descending Support Line – The trendline below price continues to act as a liquidity attractor. Stops often accumulate beneath it, making it a potential sweep zone before reversal.
5️⃣ Structural Context – The broader structure remains bearish. As long as price trades below the most recent FVG, sellers maintain full control.
⸻⸻⸻⸻⸻⸻⸻⸻⸻⸻
📊 Chart Explanation
Symbol → BINANCE:ETHUSD
Timeframe → 1D
This chart highlights the continuity of Fair Value Gap behavior throughout Ethereum’s bearish cycle.
The earlier FVGs (visible above current price) acted as magnets for retracement and then rejection — clear evidence of institutional rebalancing in action.
Each time ETH filled a previous FVG, the market found equilibrium before continuing downward.
Now, a fresh bearish FVG has formed, marking the next potential reaction area.
If price retraces deeper — ideally up to the high of this new FVG — it would offer the most reliable confirmation of a likely rejection. A shallower retracement, on the other hand, could signal weaker corrective intent.
Below current price, the descending support line identifies a possible liquidity pool. Price may sweep below this line to collect liquidity before any larger reversal attempt.
This confluence of historic and active FVGs, combined with the trendline structure, perfectly captures Smart Money’s rebalancing logic — inefficiency, retracement, rejection, and continuation.
The chart structure clearly displays a sequence of Lower Highs (LH) and Lower Lows (LL), confirming the ongoing bearish trend. This repeating HH–HL–LH–LL rhythm reflects controlled market structure and institutional rebalancing behavior.
⸻⸻⸻⸻⸻⸻⸻⸻⸻⸻
✅ Summary
• Ethereum continues to form lower highs and lower lows, maintaining its bearish structure.
• Historic FVGs show how price repeatedly retraced, filled inefficiencies, and reversed lower.
• A deeper retracement toward the high of the current FVG provides stronger confirmation for a rejection setup.
• The descending support line may act as a liquidity sweep zone before reversal.
• The overall sentiment remains bearish unless price closes above the FVG zone.
⸻⸻⸻⸻⸻⸻⸻⸻⸻⸻
⚠️ Disclaimer
📘 For educational purposes only.
🙅 Not SEBI registered.
❌ Not a buy/sell recommendation.
🧠 Purely a learning resource.
📊 Not Financial Advice.


Part 10 Trade Like InstitutionsAdvanced Option Strategies
a) Butterfly Spread
Market View: Very Neutral (Expecting Minimal Movement)
Action: Buy 1 lower strike call + Sell 2 middle strike calls + Buy 1 higher strike call.
It profits if the market remains near the middle strike.
Risk: Limited.
Reward: Limited but high probability of success.
b) Calendar Spread
Market View: Expecting Low Short-Term Volatility but High Long-Term Movement
Action: Sell near-month option + Buy next-month option of same strike.
Used by professional traders to take advantage of time decay differences between expiries.

ETHUSD SHOWING A GOOD UP MOVE WITH 1:10 RISK REWARDETHUSD SHOWING A GOOD
UP MOVE WITH 1:10 RISK REWARD
DUE TO THESE REASON
A. its following a rectangle pattern that stocked the market
which preventing the market to move any one direction now it trying to break the strong resistant lable
B. after the break of this rectangle it will boost the market potential for break
C. also its resisting from a strong neckline the neckline also got weeker ald the price is ready to break in the outer region
all of these reason are indicating the same thing its ready for breakout BREAKOUT trading are follws good risk reward
please dont use more than one percentage of your capitalfollow risk reward and tradeing rules
that will help you to to become a bettertrader
thank you

Ethereum stat buying on dip 4140-4200 upside target open Ethereum start buying on dip, levels given on chart 4140-4200 upside target
How My Harmonic pattern projection Indicator work is explained below :
Recent High or Low :
D-0% is our recent low or high
Profit booking zone ( Early / Risky entry) : D 13.2% -D 16.1 % is
range if break them profit booking start on uptrend or downtrend but only profit booking, trend not changed
SL reversal zone (Safe entry ) : SL 23.1% and SL 25.5% is reversal zone if break then trend reverse and we can take reverse trade
Target : T1, T2, T3, T4 and .
Are our Target zone
Any Upside or downside level will activate only if break 1st level then 2nd will be active if break 2nd then 3rd will be active.
Total we have 7 important level which are support and resistance area
Until , 16% not break uptrend will continue if break then profit booking will start.
If break 25% then fresh downtrend will start then T1, T2,T3 will activate
1,3,5,10,15,20 minutes are short term levels.
30 minutes 60 minutes , 2 hours,3 hours, ... 1 day and 1 week chart positional and long term levels

Eth path should be this for next few daysIn my mind the 1st scenerio could work if sudden fall may be scenerio 2 is work lets see guyz
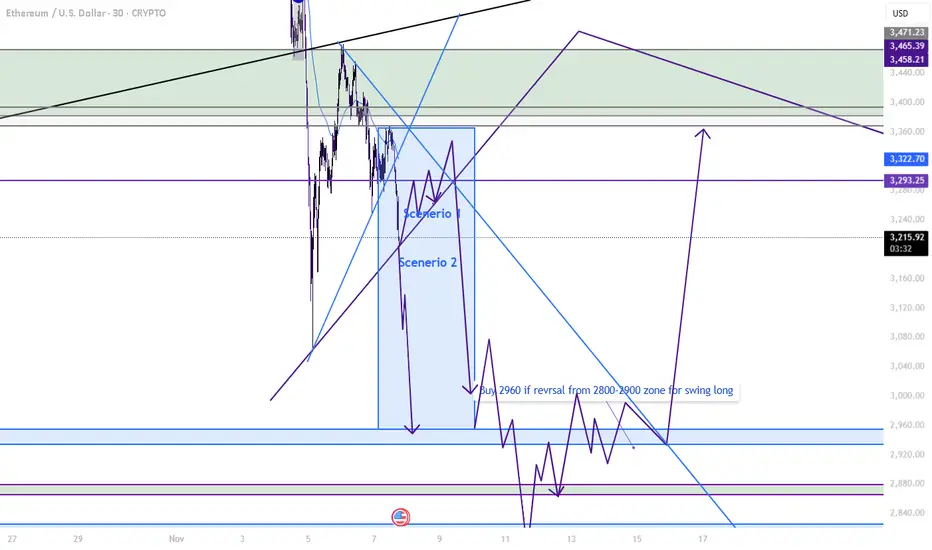
(ETH/USD, 3-hour imeframe...(ETH/USD, 3-hour timeframe, Bitstamp):
The chart clearly shows a descending channel with price breaking below the lower boundary, confirming strong bearish momentum.
The Ichimoku Cloud is fully bearish, and price action is below all major cloud levels — confirming continuation to the downside.
My chart already shows a target point marker at the lower projection level.
📉 Target analysis (based on my chart + structure):
Current Price: ≈ $3,511
Immediate Target (TP1): Around $3,400 (shown near the “target point” on my chart)
Next Target (TP2): Around $3,300 — previous horizontal support & channel extension
Extended Target (TP3): Around $3,180 – $3,200, if bearish momentum accelerates
🔒 Stop-loss (for short trades):
Above $3,650 – $3,700 (upper boundary of current consolidation zone / channel midline)
📈 Summary:
Trend: Bearish continuation
TP1: $3,400
TP2: $3,300
TP3: $3,180
SL: $3,650 – $3,700

Fundamental Analysis for Long-Term Investors1. Understanding the Concept of Fundamental Analysis
At its core, fundamental analysis (FA) seeks to answer one key question: What is the true value of this company?
By comparing the intrinsic value (calculated through analysis) with the current market price, investors can decide whether to buy, hold, or sell a stock.
If Intrinsic Value > Market Price, the stock is undervalued — a potential buying opportunity.
If Intrinsic Value < Market Price, the stock is overvalued — a signal to avoid or sell.
This method assumes that, in the long run, the market will correct any mispricing and reflect the company’s actual worth.
2. Components of Fundamental Analysis
Fundamental analysis can be divided into two main parts:
a) Qualitative Analysis
This part deals with the non-numerical aspects of a company, such as:
Business Model – How the company earns revenue and its sustainability.
Management Quality – Leadership capability and corporate governance.
Competitive Advantage (Moat) – Unique strengths like brand value, patents, or cost advantages.
Industry Outlook – Growth potential, regulatory environment, and barriers to entry.
Economic Factors – Interest rates, inflation, fiscal policy, and global market trends.
b) Quantitative Analysis
This involves examining measurable data like financial statements, ratios, and cash flows to determine a company’s financial health.
3. Key Financial Statements in Fundamental Analysis
A company’s financial statements form the backbone of fundamental analysis. Long-term investors should focus on three primary statements:
a) Income Statement
It shows the company’s profitability over a period, detailing revenue, expenses, and net income.
Key metrics:
Revenue Growth – Indicates whether the company’s sales are increasing consistently.
Operating Margin – Reflects operational efficiency.
Net Profit Margin – Shows how much profit remains after all expenses.
b) Balance Sheet
This statement provides a snapshot of the company’s financial position — assets, liabilities, and shareholders’ equity.
Important metrics include:
Debt-to-Equity Ratio (D/E) – Measures financial leverage; lower ratios imply less risk.
Current Ratio – Indicates liquidity; a ratio above 1 shows good short-term financial health.
Book Value per Share – Helps assess whether the stock is trading above or below its book value.
c) Cash Flow Statement
This shows the actual cash generated or used by the company.
Focus areas:
Operating Cash Flow (OCF) – Cash generated from core business operations.
Free Cash Flow (FCF) – Cash left after capital expenditures; indicates ability to reinvest or reward shareholders.
4. Key Financial Ratios for Long-Term Investors
Ratios simplify the evaluation of a company’s performance. Some of the most important ones are:
a) Valuation Ratios
Price-to-Earnings (P/E) Ratio – Indicates how much investors are willing to pay for each rupee of earnings. A lower P/E could suggest undervaluation.
Price-to-Book (P/B) Ratio – Compares market value to book value; useful for asset-heavy industries.
Price-to-Sales (P/S) Ratio – Ideal for companies with negative earnings but growing sales.
b) Profitability Ratios
Return on Equity (ROE) – Measures how efficiently equity is used to generate profit.
Return on Assets (ROA) – Shows how effectively the company uses its assets.
Gross and Net Margins – Indicate profitability at different stages of the income statement.
c) Liquidity and Solvency Ratios
Current Ratio & Quick Ratio – Assess short-term liquidity.
Interest Coverage Ratio – Measures ability to pay interest on debt.
d) Growth Ratios
Earnings Per Share (EPS) Growth – Consistent EPS growth indicates strong performance.
Revenue Growth Rate – Reflects expansion potential and demand.
5. Intrinsic Value and Valuation Methods
The goal of fundamental analysis is to determine intrinsic value — an estimate of what a company is truly worth. Some popular valuation methods include:
a) Discounted Cash Flow (DCF) Model
This method projects the company’s future cash flows and discounts them to present value using a required rate of return.
It’s one of the most reliable methods for estimating intrinsic value, though it requires accurate assumptions.
b) Dividend Discount Model (DDM)
Used for dividend-paying companies; it values a stock based on future dividend payments discounted to the present.
c) Relative Valuation
Compares the company’s valuation ratios (like P/E or EV/EBITDA) with peers or industry averages to assess whether it’s under or overvalued.
6. Economic and Industry Analysis
Fundamental analysis is not limited to company-level study. A top-down approach starts with understanding the broader economy and narrows down to sectors and companies.
a) Economic Analysis
Factors like GDP growth, interest rates, inflation, and fiscal policy impact company earnings and valuations. For example:
Rising interest rates can hurt highly leveraged firms.
Inflation affects input costs and consumer demand.
b) Industry Analysis
Identifying industries with favorable long-term prospects (such as renewable energy, technology, or healthcare) can improve investment success. Tools like Porter’s Five Forces help analyze industry competitiveness and profitability.
7. Qualitative Factors and Management Assessment
A company’s management team plays a vital role in long-term success. Investors should assess:
Leadership Track Record – Vision, integrity, and experience of the management team.
Corporate Governance – Transparency, accountability, and alignment with shareholder interests.
Innovation Capability – Ability to adapt to changing technology or consumer behavior.
Brand Reputation – Strength of brand loyalty and market position.
8. The Margin of Safety Principle
Coined by Benjamin Graham, the margin of safety is the difference between a stock’s intrinsic value and its market price.
For example, if a stock’s intrinsic value is ₹500 and it’s trading at ₹350, the 30% gap is the margin of safety — a cushion against analytical errors or unforeseen events.
This principle ensures that even if some assumptions go wrong, the investment remains relatively safe for the long term.
9. Long-Term Perspective and Patience
Fundamental analysis rewards patience. Stock prices can remain undervalued or overvalued for extended periods due to market sentiment or short-term volatility. However, over time, prices tend to align with intrinsic value.
Long-term investors must focus on business fundamentals, not market noise.
Compounding works best when investments are held for years in fundamentally strong companies with consistent growth, low debt, and sustainable advantages.
10. Limitations of Fundamental Analysis
While powerful, FA has its challenges:
Time-Consuming – Requires deep research and analysis.
Subjectivity – Valuation depends on assumptions that may not always be accurate.
Market Irrationality – Prices can deviate from fundamentals for long periods.
Changing Macroeconomics – Economic shocks can alter intrinsic value projections.
Thus, blending FA with periodic reviews and awareness of market cycles enhances decision-making.
Conclusion
Fundamental analysis is the foundation of successful long-term investing. It equips investors with the knowledge to differentiate between temporary market noise and genuine value. By analyzing a company’s financial health, competitive position, management quality, and future prospects, investors can make informed decisions that compound wealth over time.

Option Trading StrategiesFactors Affecting Option Prices (The Greeks)
Options are influenced by multiple variables, often referred to as Option Greeks. These measure the sensitivity of option prices to different factors:
Delta (Δ): Measures how much the option’s price changes with a ₹1 change in the underlying.
Gamma (Γ): Measures the rate of change of Delta; it indicates stability.
Theta (Θ): Represents time decay; how much the option loses in value per day.
Vega (ν): Measures sensitivity to volatility; higher volatility increases premium.
Rho (ρ): Measures sensitivity to changes in interest rates (less relevant for short-term options).
Understanding Greeks helps traders manage risk and hedging more effectively.

totally bearishI think market bearish till 3500 zone if eth survive 3500 zone and give an upside direction we can see new hisgh

ETH to make its ATH>Current Price: ~$3,880
Trendline Support: Rising from ~$2,700 → currently near ~$3,750
Major Support Zone: ~$2,800 (horizontal base)
RSI (14): ~45 → neutral, but slightly weak momentum(waiting for liquidity sweep).
Currently at bars touches trendline of 1D support Zone as we can see but we have to wait for liquidity sweep( hammer at 1D time frame) and go for long.
Disclaimer- This analysis is for educational and informational purposes only. It does not constitute financial or investment advice. Cryptocurrency markets are highly volatile and speculative.
