Part 2 Intraday Trading Masterclass Key Terminologies in Option Trading
Before diving deeper, it’s important to understand some fundamental terms used in option trading:
Strike Price (Exercise Price): The price at which the holder can buy or sell the underlying asset.
Expiry Date: The date on which the option contract expires.
Premium: The cost of buying an option.
In-the-Money (ITM): When exercising the option would be profitable.
At-the-Money (ATM): When the underlying price equals the strike price.
Out-of-the-Money (OTM): When exercising the option would not be profitable.
For example, if a trader buys a call option with a strike price of ₹200 and the stock trades at ₹250, the call option is in-the-money.
Trade ideas

High-Frequency Trading (HFT) in the Indian MarketIntroduction
High-Frequency Trading (HFT) represents one of the most advanced and technology-driven forms of trading in modern financial markets. It relies on powerful algorithms, lightning-fast computers, and low-latency connections to execute a large number of orders within microseconds. In India, HFT has gradually become an integral part of the trading ecosystem, especially after the introduction of sophisticated trading infrastructure by exchanges like the National Stock Exchange (NSE) and the Bombay Stock Exchange (BSE). Though often controversial, HFT contributes significantly to liquidity, efficiency, and price discovery in Indian capital markets.
Understanding High-Frequency Trading (HFT)
HFT is a subset of algorithmic trading where computers make decisions to buy or sell securities based on pre-programmed instructions. The key distinction lies in speed — trades are executed in microseconds, a fraction of the time it takes a human to blink.
HFT algorithms analyze multiple market conditions such as order book depth, price trends, and volatility to identify fleeting profit opportunities. These opportunities often exist for mere milliseconds, so the ability to react faster than competitors determines success.
The backbone of HFT includes:
Colocation services – where trading firms place their servers close to exchange data centers to minimize latency.
Ultra-low latency networks – to ensure rapid data transmission and order execution.
High-speed data feeds – providing real-time updates on prices and market depth.
Evolution of HFT in India
HFT made its first appearance in India in the late 2000s, when the NSE introduced colocation services in 2010. This allowed institutional traders and brokers to place their servers within exchange premises, significantly reducing order execution times.
By 2012, the share of HFT and algorithmic trades in total market volume had reached approximately 30–40%, primarily led by institutional investors and proprietary trading firms.
Over the years, the Indian market has witnessed:
Growth of technology infrastructure – The NSE and BSE adopted advanced trading systems and low-latency networks.
Entry of domestic and global algorithmic trading firms – Many firms specializing in market making and statistical arbitrage began operating in India.
Regulatory oversight – The Securities and Exchange Board of India (SEBI) introduced several guidelines to ensure fairness and transparency, including mandatory audits, approval processes, and controls against manipulative practices.
Today, estimates suggest that over 50% of trades in Indian equity and derivatives markets involve some form of algorithmic or high-frequency trading activity.
How HFT Works
HFT firms rely on a combination of mathematics, computer science, and finance. The typical HFT process involves several stages:
Market Data Collection
HFT systems continuously collect tick-by-tick data from multiple sources – stock exchanges, news feeds, and global markets.
Signal Generation
Algorithms process this data using statistical models and machine learning techniques to identify potential trading opportunities, such as arbitrage or momentum signals.
Order Execution
Once a signal is generated, orders are executed automatically. HFT systems use smart order routing to send orders to the exchange with the best available price and liquidity.
Risk Management
Real-time risk monitoring ensures that exposure limits are not breached and that orders conform to regulatory and internal compliance standards.
Post-Trade Analysis
After trades are completed, systems analyze performance metrics to refine future strategies.
The entire cycle – from data analysis to trade execution – can occur within microseconds.
Popular HFT Strategies in the Indian Market
HFT encompasses various strategies, each designed to exploit short-term inefficiencies:
Market Making
Market makers continuously quote buy and sell prices to provide liquidity. They profit from the bid-ask spread and help reduce market volatility. Many Indian brokers engage in HFT-based market making on NSE’s derivatives and currency segments.
Statistical Arbitrage
This involves identifying mispricings between correlated assets or instruments. For example, if two stocks historically move together but temporarily diverge, HFT algorithms can exploit the spread before it converges again.
Index Arbitrage
HFT systems arbitrage between an index and its constituent stocks. For instance, if the Nifty 50 futures deviate from its underlying basket’s fair value, algorithms execute trades to capture the difference.
Latency Arbitrage
This strategy leverages speed advantages to exploit price discrepancies that exist for milliseconds between exchanges or instruments.
Event-Based Trading
HFT systems respond instantly to news events, economic data releases, or corporate announcements by analyzing sentiment and trading accordingly.
Liquidity Detection (Sniffing)
Some algorithms attempt to detect large hidden orders (iceberg orders) placed by institutional investors and trade strategically around them.
Infrastructure Enabling HFT in India
The success of HFT heavily depends on the trading infrastructure. Indian exchanges have developed world-class facilities to support low-latency trading:
Colocation Services: NSE and BSE offer colocation racks where brokers can install their trading servers next to the exchange’s systems.
Dedicated Leased Lines and Microwave Networks: For ultra-fast data transfer, firms use optical fiber or microwave links that minimize latency.
Advanced Matching Engines: Exchange engines are optimized to match orders in microseconds.
Smart Order Routers: These ensure that trades are executed at the best available price across multiple exchanges.
Regulatory Framework by SEBI
The Securities and Exchange Board of India (SEBI) has been proactive in regulating HFT to ensure fair and transparent markets. Some key guidelines include:
Colocation Access Norms (2010)
Exchanges were directed to ensure equal access to colocation facilities without favoritism.
Algorithmic Trading Approval (2012)
Brokers using algos must get each strategy approved by the exchange.
Order-to-Trade Ratio Limits (2015)
To discourage excessive order cancellations, SEBI set limits on the ratio of orders placed to trades executed.
Randomization of Order Processing (2017)
To reduce latency advantage, exchanges were asked to randomize the order queue slightly.
Audit and Reporting Requirements
Regular algorithmic audits ensure compliance with market integrity and prevent manipulative practices like spoofing or layering.
Latency Equalization Plans (LEP)
SEBI and exchanges have discussed measures to equalize latency across participants, ensuring that small brokers and retail investors are not disadvantaged.
Advantages of HFT in the Indian Market
Enhanced Liquidity
HFT provides continuous buy and sell orders, reducing bid-ask spreads and ensuring smoother price discovery.
Efficient Price Discovery
By reacting instantly to new information, HFT ensures that prices reflect available data faster.
Reduced Transaction Costs
Higher liquidity translates into tighter spreads, benefiting all market participants.
Improved Market Depth
HFT firms add orders at multiple price levels, enhancing overall market depth and stability.
Technological Advancement
The presence of HFT has encouraged Indian exchanges and brokers to adopt cutting-edge technology and infrastructure.
Risks and Criticisms
Despite its advantages, HFT has drawn criticism due to concerns about fairness, stability, and manipulation.
Market Manipulation
Practices like “spoofing” (placing fake orders) or “quote stuffing” (flooding the market with orders to slow competitors) can distort prices.
Systemic Risk
A malfunctioning algorithm can trigger flash crashes. The 2012 Knight Capital incident in the U.S. and minor glitches in Indian markets highlight this risk.
Unequal Access
Large institutions with access to colocation enjoy a speed advantage over smaller brokers and retail traders, raising fairness concerns.
Reduced Investor Confidence
Rapid and unexplained price movements may discourage long-term investors.
Regulatory Complexity
Constant monitoring and evolving technology make regulation challenging for SEBI and exchanges.
Case Studies and Incidents
NSE Co-location Controversy (2015–2018)
Allegations emerged that certain brokers received unfair access to NSE’s trading systems via colocation, giving them a latency advantage. SEBI imposed fines on NSE and directed reforms to ensure transparency.
Flash Crashes and Volatility Events
On several occasions, Indian markets witnessed sudden sharp movements attributed to algorithmic errors. For instance, in October 2012, a rogue algorithm triggered a 15% intraday fall in Nifty, causing temporary panic before recovery.
These incidents emphasized the need for robust surveillance and fail-safes.
The Role of HFT in Derivatives and Currency Markets
HFT plays a particularly vital role in futures, options, and currency derivatives, where speed and liquidity are crucial.
In the Nifty futures segment, HFT accounts for nearly 40–50% of the trading volume.
In currency derivatives, HFT improves market depth and helps maintain efficient exchange rate discovery.
By arbitraging between futures, options, and cash markets, HFT participants ensure alignment in prices across instruments.
Impact on Retail and Institutional Investors
For retail investors, HFT’s influence is both positive and negative:
Positive: Better liquidity, tighter spreads, and faster execution.
Negative: Limited ability to compete on speed; occasional volatility spikes may trigger stop-losses.
Institutional investors, on the other hand, leverage algorithmic systems for better execution and reduced slippage, often partnering with HFT firms for liquidity provision.
Technological Trends Shaping the Future of HFT
The next decade of HFT in India will be shaped by:
Artificial Intelligence (AI) and Machine Learning – Algorithms capable of adaptive decision-making and predictive analytics.
Quantum Computing – Offering potentially exponential speed gains.
Blockchain and Distributed Ledger Technology – Could revolutionize trade settlements.
5G and Edge Computing – Further reducing latency for real-time data transmission.
Integration of Global Markets – Cross-border HFT strategies as regulatory harmonization improves.
Future Outlook of HFT in India
The future of HFT in India is promising yet requires balanced oversight.
SEBI’s regulatory vigilance ensures that technology-driven efficiency doesn’t come at the cost of fairness or stability. With the Digital India initiative, expanding broadband infrastructure, and growing fintech innovation, India is set to witness a new wave of algorithmic sophistication.
HFT will likely extend beyond equities into commodities, bonds, and crypto-like regulated digital assets once frameworks evolve. However, the emphasis must remain on equal access, ethical algorithm design, and investor protection.
Conclusion
High-Frequency Trading has transformed India’s financial landscape, introducing speed, precision, and efficiency at unprecedented levels. While it brings liquidity and innovation, it also introduces challenges of fairness, stability, and ethical conduct.
The Indian regulatory system, guided by SEBI and supported by exchanges like NSE and BSE, continues to evolve to strike the right balance between technological progress and market integrity.
In the years ahead, as technology continues to reshape trading, HFT will remain a defining force in India’s journey toward becoming a globally competitive, transparent, and technology-driven financial market.
Smart Liquidity Trading Strategies1. Understanding Market Liquidity
Market liquidity refers to the ease with which an asset can be converted to cash at a stable price. High liquidity implies narrow bid-ask spreads, large volumes, and low volatility for a given transaction size, while low liquidity involves wider spreads, lower volume, and higher volatility. Understanding liquidity is crucial for trading strategies because:
Liquidity affects execution costs.
Illiquid markets are prone to sharp price moves.
Market participants’ behavior can create temporary liquidity imbalances, which smart traders exploit.
Liquidity can be categorized into:
Natural liquidity – The existing supply and demand for an asset.
Hidden liquidity – Orders that are not visible in the order book but can influence prices, such as iceberg orders.
Synthetic liquidity – Created by market participants through strategies like high-frequency trading (HFT) or algorithmic trading.
2. Types of Liquidity Trading Strategies
Smart liquidity trading strategies can be broadly classified into several types:
2.1 Order Book Analysis
The order book shows the real-time buy (bid) and sell (ask) orders. Smart traders analyze the order book to detect liquidity clusters:
Support and Resistance Liquidity Zones: Large order clusters act as barriers to price movement. If the buy-side has a significant volume, it can provide support. Conversely, large sell orders can act as resistance.
Order Flow Imbalances: When the number of aggressive buy orders exceeds sell orders, it can indicate potential upward price pressure, and vice versa.
Tools such as depth-of-market (DOM) screens, Level II quotes, and heatmaps allow traders to visualize these liquidity zones.
2.2 Volume-Weighted Strategies
Volume is a direct proxy for liquidity. Smart liquidity traders often use volume-weighted techniques:
Volume Weighted Average Price (VWAP) Trading: VWAP is the average price of a security weighted by its traded volume. Traders aim to buy below or sell above VWAP to minimize market impact.
Liquidity-Seeking Algorithms: Large institutional orders are split and executed in small portions based on current liquidity to avoid slippage. Algorithms like VWAP, TWAP (Time-Weighted Average Price), and POV (Percentage of Volume) are commonly used.
2.3 Price Action and Liquidity Gaps
Liquidity gaps occur when the order book is thin at certain price levels. Smart traders exploit these gaps:
Breakout Trading: Thin liquidity areas often allow prices to accelerate quickly once the barrier is breached.
Stop-Hunting Strategies: Large participants sometimes trigger liquidity pools (stop-loss clusters) to create favorable price movements. Traders who understand liquidity dynamics can anticipate these zones.
2.4 High-Frequency and Algorithmic Liquidity Strategies
High-frequency traders (HFTs) specialize in identifying and exploiting transient liquidity imbalances. Examples include:
Market-Making: Providing liquidity by continuously quoting buy and sell prices and profiting from the spread.
Latency Arbitrage: Exploiting delays in price updates across exchanges or trading venues.
Liquidity Sniping: Targeting hidden orders when they are partially revealed or exposed due to large market moves.
2.5 Cross-Market and Cross-Asset Liquidity Trading
Liquidity is not confined to a single market. Smart traders examine correlations between markets:
Equity and Derivative Pairs: For example, the liquidity in index futures can provide insights into the underlying stocks’ potential moves.
Forex and Commodity Cross-Market Liquidity: Major currency pairs often exhibit predictable liquidity patterns, which can influence commodity prices, like oil or gold.
ETF Arbitrage: When ETF liquidity diverges from its underlying basket, traders can exploit the mispricing efficiently.
3. Smart Tools for Liquidity Analysis
Successful liquidity trading requires advanced tools and data sources:
Order Book and Level II Data: Visualizing real-time buy/sell orders and depth helps identify liquidity clusters and thin zones.
Volume Heatmaps: Identify where significant trading activity is occurring across price levels.
Liquidity Aggregators: Tools that combine order book data across multiple exchanges to provide a consolidated view.
Algorithmic Platforms: Automated execution minimizes slippage and optimizes order placement according to liquidity conditions.
News and Event Scanners: Market liquidity often changes during economic releases, corporate earnings, or geopolitical events. Monitoring these can prevent adverse execution.
4. Liquidity Timing Strategies
Timing is crucial in liquidity trading. Smart traders often consider:
Market Open and Close: Liquidity is often thin at market open, leading to high volatility. Conversely, liquidity peaks near close due to institutional rebalancing.
Intraday Patterns: Volume spikes are common at certain times of the day (e.g., after economic news). Traders can use these predictable patterns.
Event-Based Liquidity: Earnings announcements, central bank decisions, and geopolitical events create temporary liquidity vacuums or surges.
5. Risk Management in Liquidity Trading
While liquidity strategies can be profitable, they carry specific risks:
Execution Risk: Entering or exiting positions in illiquid markets may lead to slippage or partial fills.
Market Impact Risk: Large orders in thin markets can move prices against the trader.
Counterparty Risk: Over-reliance on automated systems or brokers may lead to failure if liquidity vanishes unexpectedly.
Overnight Risk: Illiquid positions held overnight can be vulnerable to gaps in price movement.
Smart liquidity traders manage these risks using:
Order Slicing: Breaking large trades into smaller orders to avoid price impact.
Stop-Loss Placement: Strategic placement in liquid zones to reduce adverse execution.
Diversification: Trading multiple correlated instruments to distribute liquidity risk.
Automated Monitoring: Alert systems to detect liquidity shifts and adjust execution dynamically.
6. Psychological and Behavioral Insights
Liquidity trading is not just technical; market psychology plays a key role:
Traders often herd around visible liquidity pools, creating predictable patterns.
Understanding the behavior of institutional participants, such as how they hide large orders, can give retail traders a strategic advantage.
Market sentiment can create sudden liquidity droughts, which savvy traders can exploit by anticipating crowd behavior.
7. Practical Examples of Smart Liquidity Strategies
Example 1: VWAP Execution
An institutional trader needs to buy 1 million shares without moving the market.
The algorithm executes trades according to intraday volume, ensuring the average price is near VWAP, minimizing slippage.
Example 2: Liquidity Gap Breakout
A stock shows a thin order book at a certain price level due to low participation.
A trader places a breakout order just above the liquidity gap, allowing rapid execution as the price accelerates through the thin zone.
Example 3: Cross-Market Arbitrage
ETF price deviates from its underlying basket due to temporary liquidity shortage.
Trader buys the cheaper asset and sells the overvalued counterpart, profiting as prices converge once liquidity returns.
Example 4: Stop-Loss Liquidity Pool Hunting
Large institutional stops often cluster near round numbers.
Smart traders identify these clusters and position accordingly, entering slightly before the expected cascade to benefit from the resulting liquidity surge.
8. Advanced Considerations
Hidden Liquidity: Iceberg orders and dark pools hide true market depth. Advanced traders use predictive analytics to estimate hidden volumes.
Liquidity Fragmentation: Markets are fragmented across multiple exchanges and dark pools. Consolidated data helps detect where liquidity is concentrated.
Dynamic Liquidity Modeling: Using AI and machine learning to predict how liquidity responds to price moves, news, and market sentiment.
9. Key Principles for Smart Liquidity Trading
Observe, Don’t Chase: Liquidity dynamics often reveal intentions of larger players. Observing patterns is more effective than aggressive chasing.
Minimize Market Impact: Use algorithms and staggered executions to preserve favorable prices.
Adapt to Market Conditions: Liquidity is dynamic; strategies must adjust intraday.
Leverage Technology: Automation, analytics, and high-speed data feeds are essential.
Integrate Risk Management: Smart liquidity trading combines precision entry, execution efficiency, and rigorous risk controls.
10. Conclusion
Smart liquidity trading strategies focus on understanding and leveraging the flow of market liquidity rather than simply predicting price direction. By analyzing order books, volume, cross-market activity, and behavioral patterns, traders can execute efficiently, reduce slippage, and identify profitable opportunities hidden in the market structure. These strategies require a combination of analytical skill, technological tools, and disciplined risk management. As markets evolve and liquidity becomes more fragmented, mastery of liquidity dynamics increasingly distinguishes professional traders from casual participants. The essence of smart liquidity trading lies in respecting the invisible currents of supply and demand, positioning oneself ahead of major flows, and executing with surgical precision.

Trading Breakouts and Fakeouts: An In-Depth Analysis1. Understanding Breakouts
A breakout occurs when the price of an asset moves beyond a defined support or resistance level with increased volume. These levels act as psychological barriers where buyers or sellers have historically exerted control. A breakout signals a potential new trend and can present a lucrative trading opportunity.
Support Level: A price level where buying interest is strong enough to prevent further decline.
Resistance Level: A price level where selling pressure exceeds buying interest, preventing further ascent.
Breakouts indicate that the equilibrium between supply and demand has shifted, creating a momentum-driven price movement. Traders look for these opportunities as the market often continues moving in the breakout direction, at least in the short term.
Types of Breakouts
Upside Breakout: Occurs when the price moves above a resistance level. Often seen as a bullish signal indicating further upward movement.
Downside Breakout: Happens when the price falls below a support level. This is a bearish signal suggesting continued downward pressure.
Volatility Breakout: Happens when price moves beyond a consolidation range, indicating increased volatility.
Pattern-Based Breakout: Triggered by the completion of chart patterns such as triangles, head-and-shoulders, flags, or rectangles.
2. Factors Driving Breakouts
Breakouts are not random; several market factors contribute to their formation:
Fundamental Drivers: News releases, earnings reports, economic data, geopolitical events, or monetary policy announcements can trigger a breakout.
Technical Triggers: Long-term resistance or support levels, trendlines, and chart patterns attract attention from technical traders, amplifying price movements.
Volume Confirmation: A genuine breakout is usually accompanied by a significant increase in trading volume, signaling strong market interest and conviction.
Market Sentiment: Collective trader psychology plays a role. Fear and greed can accelerate breakouts as traders rush to capitalize on perceived opportunities.
3. Breakout Trading Strategies
Effective breakout trading relies on proper timing, risk management, and confirmation. Below are widely used strategies:
A. Entry Techniques
Wait for Close Beyond Level: Traders often wait for the price to close beyond the support/resistance level rather than reacting to intraday spikes.
Volume Confirmation: Look for above-average trading volume to confirm the breakout's strength.
Breakout Pullback: Sometimes, prices retest the breakout level. Entering after a successful retest can reduce false signals.
B. Risk Management
Stop Loss Placement: Place stop-loss orders slightly below the breakout point for long positions and above for short positions.
Position Sizing: Limit exposure to reduce the impact of sudden reversals.
Target Projection: Measure the height of the previous consolidation range to project price targets post-breakout.
C. Timeframe Consideration
Breakout signals vary across timeframes. Higher timeframes (daily, weekly) tend to offer more reliable breakouts, whereas intraday breakouts (5-min, 15-min charts) are more prone to fakeouts.
4. Understanding Fakeouts
A fakeout is a false breakout where the price moves beyond a key level but quickly reverses direction. Fakeouts can trap traders who enter positions prematurely, leading to losses. Recognizing fakeouts is essential to avoid falling into “breakout traps.”
Why Fakeouts Happen
Liquidity Hunting: Large institutional players may push prices beyond levels temporarily to trigger stop-loss orders of retail traders, then reverse.
Market Manipulation: In illiquid markets, price can be deliberately pushed to create misleading breakouts.
Psychological Reactions: Traders’ overconfidence can lead to impulsive entries, resulting in fakeout scenarios.
Lack of Volume: Breakouts without sufficient volume often fail to sustain, reverting to previous levels.
Common Fakeout Patterns
False Break Above Resistance: Price breaches resistance, but selling pressure soon overwhelms buyers.
False Break Below Support: Price dips below support, only to rebound as buying interest returns.
Wicks or Shadows: Candlestick charts often show long upper or lower shadows indicating rejection at breakout levels.
5. Identifying Fakeouts vs Genuine Breakouts
Differentiating between fakeouts and genuine breakouts requires careful observation:
Volume Analysis: Genuine breakouts are typically supported by strong volume. Low volume breakouts are more likely fakeouts.
Price Action Confirmation: Wait for consecutive closes beyond the level to confirm strength.
Market Context: Analyze broader trends and sentiment. Breakouts in alignment with trends are more reliable.
Indicators: Technical indicators such as RSI, MACD, and Bollinger Bands can provide clues. Divergence or overbought/oversold conditions may hint at potential fakeouts.
Timeframe Cross-Check: Confirm breakouts across multiple timeframes to ensure authenticity.
6. Psychological Aspects of Breakouts and Fakeouts
Trader psychology plays a pivotal role in breakouts and fakeouts:
Herd Mentality: Traders tend to follow momentum blindly, contributing to breakout acceleration or fakeout formation.
Fear and Greed: Overreaction to news or technical signals can trigger impulsive trades.
Confirmation Bias: Traders may convince themselves a breakout is genuine despite contrary signals, increasing susceptibility to fakeouts.
Patience and Discipline: Waiting for confirmation rather than entering prematurely is critical to successful breakout trading.
7. Risk Management Techniques for Breakout Trading
Breakout trading carries inherent risk. Effective strategies include:
Stop Loss Discipline: Placing stop-loss orders near the breakout point prevents large losses.
Diversification: Avoid overexposure to a single asset or breakout signal.
Trailing Stops: Protect profits by moving stops in the breakout direction.
Scaling In and Out: Gradually increase position size as the breakout proves itself, and consider partial exits at price targets.
8. Practical Examples
Example 1: Upside Breakout
Suppose a stock repeatedly tests resistance at $50. One day, it closes at $52 with high volume. Traders who enter the trade expect a continued upward trend. If the breakout is genuine, the price may climb to $60, with stop-losses placed just below $50.
Example 2: Fakeout
The same stock tests $50, briefly spikes to $52, but then falls back below $50 within hours. Traders who entered during the spike are trapped. Observing low volume and short-lived candlestick patterns could have prevented this loss.
9. Tools to Enhance Breakout Trading
Volume Indicators: On-Balance Volume (OBV), Volume Oscillator.
Trend Indicators: Moving Averages, MACD.
Volatility Indicators: Bollinger Bands, ATR (Average True Range).
Chart Patterns: Triangles, Flags, Pennants, Rectangles.
Candlestick Patterns: Engulfing patterns, Pin Bars, Doji formations.
10. Combining Breakout Trading with Other Strategies
Momentum Trading: Breakouts often align with momentum strategies. Combining them can enhance success rates.
Trend Following: Breakouts within strong trends are more likely genuine, offering high-probability trades.
Swing Trading: Breakout and fakeout analysis helps swing traders identify optimal entry and exit points.
Scalping: Intraday traders can exploit small breakout movements but must remain vigilant for fakeouts.
11. Common Mistakes in Breakout Trading
Entering Too Early: Jumping in before confirmation increases exposure to fakeouts.
Ignoring Volume: Trading breakouts without volume analysis often leads to losses.
Overleveraging: Using high leverage on breakouts can amplify losses during reversals.
Failure to Adjust Stops: Not trailing stop-losses or adjusting targets can erode profits.
Neglecting Market Context: Breakouts against the trend are riskier and more likely to fail.
12. Conclusion
Breakout and fakeout trading are fundamental concepts in technical analysis that offer lucrative opportunities when approached strategically. Breakouts signal market shifts and potential trend formations, while fakeouts remind traders of the risks associated with premature or misinformed entries. Successful trading requires a combination of:
Technical skills (chart analysis, pattern recognition, volume study)
Psychological discipline (patience, fear management, avoiding herd behavior)
Risk management (stop-loss placement, position sizing, diversification)
By understanding market mechanics, observing price and volume behavior, and integrating breakout and fakeout strategies with other trading techniques, traders can navigate financial markets more confidently and minimize the pitfalls of false signals. Ultimately, mastering breakouts and fakeouts equips traders with a sharper lens through which to interpret market movements and maximize returns.

Crypto Assets Secrets: The Hidden Dynamics of Digital WealthIntroduction
Over the past decade, crypto assets have transformed from a fringe experiment in digital money into a multitrillion-dollar financial ecosystem that challenges the traditional boundaries of economics, finance, and technology. Bitcoin’s mysterious emergence in 2009 under the pseudonym Satoshi Nakamoto sparked a global phenomenon, laying the foundation for an entirely new asset class known as crypto assets or digital assets. While the world has widely discussed cryptocurrencies like Bitcoin and Ethereum, the secrets behind crypto assets—how they derive value, operate, and influence financial systems—remain misunderstood by many.
This essay unveils the hidden dimensions of crypto assets, exploring their technological foundations, economic mechanisms, market dynamics, investment secrets, and the strategic shifts they are inducing in global finance.
1. Understanding Crypto Assets
A crypto asset is a digital representation of value that operates on blockchain technology and uses cryptography for security, verification, and transaction validation. Unlike fiat currencies, crypto assets are decentralized, meaning they are not issued or controlled by central banks or governments. They rely instead on distributed networks of computers (nodes) that collectively maintain the integrity of the ledger.
Crypto assets can be broadly divided into three main categories:
Cryptocurrencies – digital currencies used primarily as a medium of exchange (e.g., Bitcoin, Litecoin).
Utility tokens – tokens granting access to services within blockchain ecosystems (e.g., Ethereum’s ETH for gas fees).
Security and asset-backed tokens – representing ownership or rights to assets like equity, real estate, or commodities (e.g., tokenized stocks or gold).
Behind these classifications lies a deeper secret: the tokenization of value. Blockchain allows almost any form of asset—tangible or intangible—to be represented, traded, and fractionalized digitally, unlocking unprecedented liquidity and accessibility in global finance.
2. The Secret of Blockchain Technology
At the heart of every crypto asset lies blockchain technology, a decentralized digital ledger that records transactions in immutable “blocks.” The blockchain’s transparency, security, and decentralization are its core strengths.
The secret behind blockchain’s power is its consensus mechanism—the process by which distributed participants agree on the state of the ledger. Common mechanisms include:
Proof of Work (PoW) – miners solve complex mathematical puzzles to validate transactions (used by Bitcoin).
Proof of Stake (PoS) – validators lock up coins (“stake”) to earn the right to confirm transactions (used by Ethereum 2.0).
Delegated Proof of Stake (DPoS) and Proof of Authority (PoA) – more energy-efficient models emphasizing speed and scalability.
These consensus methods ensure that no single entity can alter records, creating a trustless system where integrity is mathematically guaranteed rather than institutionally enforced. This underpins the revolutionary concept of decentralized trust, which is one of the most powerful secrets of crypto assets.
3. Value Creation and Scarcity: The Economic Secret
Traditional assets derive value from underlying cash flows, commodities, or sovereign guarantees. Crypto assets, however, derive value from mathematical scarcity and network utility.
For example, Bitcoin’s total supply is capped at 21 million coins, making it a deflationary asset. This digital scarcity mimics the rarity of gold, positioning Bitcoin as “digital gold” and a hedge against inflation. Ethereum’s value, meanwhile, stems from its programmable utility—its blockchain powers thousands of decentralized applications (dApps) and smart contracts.
The economic secret is that crypto assets merge scarcity with utility. A token that is both scarce and useful tends to appreciate in value as network adoption grows—a phenomenon described by Metcalfe’s Law, which states that the value of a network is proportional to the square of its number of users.
4. The Secret Power of Decentralization
One of the most revolutionary aspects of crypto assets is decentralization—the removal of intermediaries like banks, brokers, or governments. In decentralized finance (DeFi), users can lend, borrow, trade, or invest directly using smart contracts without third-party oversight.
This system operates 24/7, globally, with transparent and automated processes. The secret advantage of decentralization is permissionless innovation: anyone can build or access financial services without seeking institutional approval. This democratizes finance and opens opportunities to billions of unbanked individuals worldwide.
However, decentralization comes with challenges—governance disputes, code vulnerabilities, and regulatory uncertainty—which form part of the hidden risks behind the promise of crypto wealth.
5. Crypto Market Dynamics: Secrets of Volatility and Manipulation
Crypto markets are notoriously volatile. Prices can rise or fall by double digits in a single day. This volatility is often misunderstood as pure speculation, but it also reflects deeper structural characteristics:
Low liquidity compared to traditional markets.
High leverage in derivatives and margin trading.
Whale activity—large holders who can manipulate prices.
News-driven sentiment amplified by social media and influencer culture.
A lesser-known secret is the role of algorithmic trading and market-making bots, which dominate exchanges and create rapid micro-fluctuations. Additionally, because crypto operates globally without a centralized regulator, price discovery is influenced by multiple fragmented exchanges.
To navigate this landscape, experienced investors rely on on-chain analysis, which examines blockchain data—wallet activity, token flows, and network metrics—to anticipate market trends beyond traditional charting methods.
6. Secrets of Crypto Investing and Portfolio Strategy
Successful crypto investing requires understanding not just price trends but fundamental blockchain metrics, including transaction volume, developer activity, tokenomics, and governance models.
Key strategies and their underlying “secrets” include:
HODLing – Long-term holding of high-conviction assets like Bitcoin or Ethereum, based on belief in their future dominance.
Staking – Earning passive income by locking coins to secure networks in PoS systems.
Yield farming – Lending or providing liquidity to DeFi protocols in exchange for rewards; highly profitable but risky.
NFT and metaverse investing – Speculating on digital ownership and virtual real estate.
Diversification – Allocating across blockchains, stablecoins, and DeFi projects to mitigate volatility.
Another secret is tokenomics, the economic design of a crypto project—how tokens are distributed, used, burned, or minted. Projects with transparent, sustainable tokenomics tend to outperform those with inflationary or centralized token supplies.
7. Hidden Risks and Security Secrets
While the crypto revolution promises freedom and profits, it hides complex security risks. Common vulnerabilities include:
Exchange hacks – centralized platforms holding billions in user assets are frequent targets.
Smart contract exploits – coding bugs that allow attackers to drain funds.
Phishing and social engineering – scams exploiting user ignorance or greed.
Private key loss – once lost, access to crypto wallets is permanently gone.
The security secret lies in self-custody—owning and protecting private keys through hardware wallets and multi-signature security models. Decentralized exchanges (DEXs) also enhance safety by allowing users to retain control of their assets during trading.
Another layer of defense is zero-knowledge proofs (ZKPs), a cryptographic innovation enabling transactions to be verified without revealing sensitive data. This technology is paving the way for privacy-preserving and scalable blockchains.
8. The Regulatory Secret: Balancing Innovation and Control
Governments worldwide are grappling with how to regulate crypto assets. The tension lies between fostering innovation and preventing financial crimes like money laundering or tax evasion.
The secret insight is that regulation is inevitable but potentially beneficial. Clear frameworks attract institutional investors who previously avoided crypto due to legal uncertainty. Countries like Singapore, Switzerland, and the UAE have leveraged crypto-friendly regulations to become global blockchain hubs.
Meanwhile, central banks are experimenting with Central Bank Digital Currencies (CBDCs)—state-issued digital currencies that adopt blockchain principles without decentralization. This reveals a paradoxical secret: the technology that began as a rebellion against centralization may ultimately reshape central banking itself.
9. The Institutional and Technological Shift
The entry of institutional players—hedge funds, asset managers, and public corporations—marks a new phase in crypto maturity. Companies like MicroStrategy, Tesla, and BlackRock have integrated Bitcoin into their balance sheets or fund offerings. This institutional endorsement signals that crypto is evolving from speculative trading to a legitimate asset class.
Behind the scenes, major innovations such as layer-2 scaling, interoperability protocols (Polkadot, Cosmos), and tokenized real-world assets (RWA) are redefining the boundaries of blockchain utility. These technologies aim to solve scalability bottlenecks and connect fragmented blockchains, enabling a seamless decentralized financial ecosystem.
The secret lesson here is convergence—the merging of traditional finance (TradFi) and decentralized finance (DeFi) into a hybrid model known as “CeDeFi”, where institutions adopt blockchain efficiencies while retaining regulatory compliance.
10. The Psychological Secret of Crypto Adoption
Crypto markets are not driven purely by technology—they are driven by belief and psychology. The phenomenon of community-driven growth, often seen in projects like Dogecoin or Shiba Inu, demonstrates how narratives and memes can mobilize collective sentiment into market capitalization worth billions.
The psychological secret lies in network belief—the idea that value in crypto is sustained by the confidence of its holders. When enough participants believe a token has worth, it self-validates through market demand. This blend of behavioral finance and digital community dynamics gives crypto its cultural power.
11. Environmental and Ethical Secrets
Critics argue that proof-of-work mining consumes enormous energy, raising concerns about sustainability. However, the hidden side of this debate is technological evolution. Newer blockchains are adopting energy-efficient consensus models, and Bitcoin mining is increasingly powered by renewable energy sources.
Moreover, the crypto industry is becoming a driver of green innovation—through tokenized carbon credits, renewable energy financing, and blockchain-based ESG tracking. Thus, the secret lies not in rejecting crypto’s environmental footprint but in harnessing it for sustainability solutions.
12. The Future Secrets of Crypto Assets
The future of crypto assets will be shaped by several converging trends:
Tokenization of real-world assets – turning stocks, real estate, and commodities into blockchain tokens for global access.
AI-driven smart contracts – merging artificial intelligence with blockchain for self-optimizing systems.
Cross-chain interoperability – seamless transfer of assets across different networks.
Decentralized identity (DID) – enabling privacy-preserving authentication and digital citizenship.
Institutional-grade custody and compliance – bridging crypto with traditional finance infrastructure.
The deeper secret is that crypto assets represent more than an investment trend—they are the foundation of a new digital economy built on transparency, inclusivity, and programmable trust.
Conclusion
The secrets of crypto assets lie not in hidden codes or mysterious markets, but in the profound reimagining of how humans define, exchange, and secure value. From decentralized trust and mathematical scarcity to programmable finance and tokenized ownership, crypto assets are revolutionizing global systems at every level.
Yet, with this transformation comes both opportunity and responsibility. Understanding these secrets allows investors, policymakers, and technologists to participate wisely in shaping a future where financial power is distributed, transparent, and resilient. As blockchain innovation continues to unfold, the true secret may be this: crypto assets are not just changing finance—they are redefining the very architecture of trust in the digital age.
What is a Double Top Pattern?What is a Double Top Pattern?
In technical analysis, a double top is a common chart pattern that signals a potential reversal from an uptrend to a downtrend. It forms when the price reaches a high point (the first top), pulls back to a support level (the trough or neckline), and then rises again to a similar high (the second top) before declining. Visually, it looks like the letter "M."
This pattern can appear on any timeframe, including hourly charts, but on an hourly basis, it typically indicates shorter-term reversals, often influenced by intraday trading dynamics.
Technical Analysis
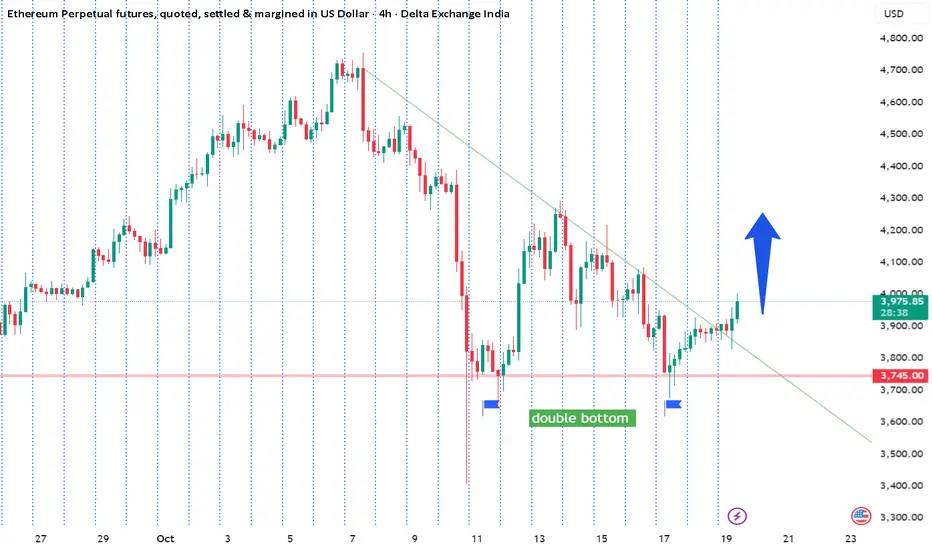
The provided hourly chart of Ethereum Perpetual Futures (ETH/USD) from TradingView, dated October 21, 2025, displays a classic double bottom pattern, which is a bullish reversal indicator. This "W"-shaped formation occurs after a downtrend, with two roughly equal lows (around $3,600–$3,700) separated by a peak, signaling potential exhaustion of selling pressure and a shift to buyer control.
Pattern Details: The first bottom forms after an initial decline, followed by a rally to a neckline resistance (approximately $4,200). The price then retraces to form the second bottom before attempting another breakout. Confirmation typically requires a close above the neckline with increased volume, projecting an upside target equal to the pattern's height (roughly $600, suggesting a move toward $4,200 + $600 = $4,800).
Current Price Action: As of October 21, 2025, ETH is trading around $3,890–$4,031, with a recent 24-hour decline of -3.53%. The chart shows volatility, with candles fluctuating between $3,600 and $4,260. Support levels are at $3,800–$3,900 (recent lows), while resistance sits at $4,100–$4,200 (neckline and recent highs).
Indicators:
Moving Averages: The 50-hour MA is around $4,000, acting as immediate resistance; a crossover above could signal strength. The 200-hour MA near $3,900 provides support.
RSI (Relative Strength Index): Likely in the 40–50 range (neutral), indicating no overbought conditions but potential for upward momentum if it climbs above 60.
MACD: Recent searches suggest a flattening or bearish crossover in short-term charts, pointing to consolidation, but on-chain data shows whale accumulation (80K+ ETH off exchanges), supporting a bullish bias.
Volume: Trading volume is high at $32B (24h), but recent outflows from ETFs ($145M) could pressure short-term moves.
Broader Technical Outlook: Multiple analyses indicate ETH stalling below $4,000, with risks of a drop to $3,800 if support fails. However, historical October gains (avg. 4.77%) and projections from sources like Changelly (fluctuating $4,001–$4,625) and CoinCodex (up to $4,358 by Oct 27) lean bullish. A break above $4,200 could target $4,500–$4,800 by end-October, while failure might retest $3,700.
Fundamental Analysis
Ethereum's fundamentals remain robust, driven by network upgrades, institutional adoption, and ecosystem growth, though short-term headwinds like ETF outflows and geopolitical tensions exist.
Network Activity: Q3 2025 saw major upgrades, including a gas limit increase to 45M and preparations for the Fusaka upgrade (December 2025), enabling 8x Layer 2 throughput via PeerDAS. Developer growth hit 16K+ new contributors in 2025, with DEX volume surging 47% to $33.9B weekly. Stablecoin growth and record dev activity bolster long-term value.
Institutional Factors: Spot ETH ETFs hold $27.63B in AUM (up from $10.13B in July), but recent outflows ($145M on Oct 20) signal caution. BlackRock's ETHA accumulated $1.4B since Oct 1, and whales pulled 80K+ ETH off exchanges (lowest supply since 2016), indicating accumulation.
Macro Influences: Fed signals for a modest rate cut in late October could boost risk assets. However, U.S.-China trade tensions (new tariffs Nov 1) sparked pullbacks. Vitalik Buterin praised Polygon's contributions, enhancing optimism, but North Korean hackers using ETH for malware adds negative press.
Market Metrics: Market cap at $469B (rank #2), with 120.7M ETH in circulation. Projections from Standard Chartered target $7,500 by year-end 2025, citing ETF inflows and regulatory progress like the GENIUS Act.
Overall, fundamentals support growth, with analysts eyeing $4,300–$4,500 by end-October if ETF inflows resume.
Sentiment Analysis
Sentiment around Ethereum is mixed but leans neutral-to-bullish, based on social media, community polls, and market indicators.
X (Twitter) Sentiment: From recent posts (Oct 1–21, 2025), 55% express bullish views (e.g., expectations of a breakout to $4,800–$6,000, whale accumulation, and support at $3,900), 30% bearish (short-term weakness below $4,000, RSI overbought), and 15% neutral (sideways consolidation). Key themes: Optimism on upgrades and ETF demand, but caution on volatility and macro risks. Community sentiment on CoinGecko is "bullish today" (79%), despite price declines.
Broader Market Sentiment: Fear & Greed Index at 30 (rising fear), with options flows showing hedging for downside. Prediction markets like EveryX give 76% probability of ETH hitting $5,000 by end-2025. Social chatter lacks aggressive buying but highlights defensive moves, with MVRV below average warning of short-term risks.
On-Chain Signals: Declining spot volume and open interest suggest sidelined bulls, but OBV (On-Balance Volume) trends negative, aligning with cautious sentiment. Overall, long-term conviction is high (e.g., institutional holding), but short-term nerves prevail.
Trend Prediction
Based on the double bottom pattern in the chart (bullish reversal), strong fundamentals (upgrades, accumulation), and predominantly optimistic sentiment despite short-term volatility, the overall trend for Ethereum is upward. Short-term consolidation or a minor pullback to $3,800–$3,900 is possible due to resistance at $4,000–$4,200 and recent outflows, but a confirmed breakout above the neckline could drive ETH toward $4,500–$4,800 by end-October 2025. Longer-term (Q4 2025), targets of $5,000–$6,000 appear achievable if macro conditions improve. Always monitor volume and news for confirmation—crypto markets are volatile.

Carbon Credits and ESG Investing1. Understanding Carbon Credits
1.1 Definition
A carbon credit is a tradable certificate or permit that represents the right to emit one ton of carbon dioxide (CO₂) or an equivalent amount of another greenhouse gas (GHG). Essentially, it is a financial instrument designed to cap emissions while incentivizing reductions. Carbon credits are central to market-based approaches for controlling global carbon emissions.
1.2 Types of Carbon Credits
Carbon credits can be broadly classified into two categories:
Compliance Carbon Credits:
These are generated and traded under mandatory national or international regulatory frameworks, such as the European Union Emissions Trading System (EU ETS) or the Kyoto Protocol mechanisms. Companies exceeding emission limits can purchase credits to meet compliance.
Voluntary Carbon Credits:
These are used by companies or individuals on a voluntary basis to offset emissions beyond regulatory requirements. The voluntary market supports projects like reforestation, renewable energy, and methane capture.
1.3 Mechanism of Carbon Credits
The carbon credit system operates on the “cap-and-trade” principle:
Cap: Governments or regulatory bodies set a cap on total carbon emissions for specific sectors or organizations.
Allocation: Companies are allocated emission allowances equivalent to the cap.
Trade: If a company emits less than its allowance, it can sell excess credits. Conversely, companies exceeding their limits must purchase credits to comply.
This system creates a financial incentive for companies to reduce emissions efficiently, while providing flexibility in achieving environmental goals.
1.4 Benefits of Carbon Credits
Environmental Impact: Encourages the reduction of greenhouse gas emissions and supports renewable energy and conservation projects.
Economic Incentives: Provides a cost-effective mechanism for companies to manage emission limits.
Global Cooperation: Facilitates cross-border collaboration in combating climate change.
Innovation: Encourages technological advancements in energy efficiency and clean technologies.
1.5 Challenges
Verification and Transparency: Ensuring the authenticity and impact of carbon credits can be difficult, especially in voluntary markets.
Market Volatility: Prices of carbon credits can fluctuate, affecting corporate planning.
Risk of “Greenwashing”: Companies may misuse credits to appear environmentally responsible without genuine sustainability efforts.
2. ESG Investing
2.1 Definition
ESG investing is an investment strategy that integrates Environmental, Social, and Governance factors into financial decision-making. Unlike traditional investment approaches that focus solely on financial returns, ESG investing evaluates how companies manage sustainability risks and social responsibilities.
Environmental: Examines a company’s environmental footprint, including energy use, emissions, waste management, and climate impact.
Social: Focuses on human capital management, labor standards, community relations, and diversity and inclusion.
Governance: Assesses corporate governance practices, board structure, transparency, shareholder rights, and ethical conduct.
2.2 History and Evolution
The concept of ESG investing has evolved over decades:
1960s–1980s: Ethical investing emerged, primarily focused on avoiding “sin stocks” like tobacco and weapons.
1990s–2000s: Socially responsible investing (SRI) began incorporating broader social and environmental concerns.
2010s–Present: ESG investing became mainstream, driven by climate change concerns, regulatory pressure, and growing investor awareness of long-term risks.
2.3 ESG Integration Strategies
Investors can adopt several approaches to integrate ESG factors:
Screening: Excluding companies or sectors that do not meet ESG criteria (negative screening) or including those that do (positive screening).
Integration: Embedding ESG factors into fundamental financial analysis to assess long-term risks and opportunities.
Impact Investing: Targeting investments that generate measurable social and environmental benefits alongside financial returns.
Shareholder Engagement: Using ownership rights to influence company policies on sustainability and corporate governance.
2.4 Importance of ESG Investing
Risk Management: ESG factors help identify potential environmental, social, or governance risks that could impact financial performance.
Long-term Value Creation: Companies with strong ESG performance tend to demonstrate resilience and sustainable growth.
Regulatory Compliance: Governments and regulators are increasingly mandating ESG disclosures and reporting.
Reputation and Consumer Demand: ESG-aligned companies attract customers, employees, and investors seeking responsible businesses.
2.5 Challenges in ESG Investing
Standardization: Lack of uniform ESG metrics and reporting standards makes comparisons difficult.
Greenwashing: Companies may exaggerate ESG credentials to attract investors without real impact.
Short-term vs Long-term: ESG benefits often manifest over the long term, while market pressures may favor short-term gains.
Data Quality: Reliable ESG data can be scarce, inconsistent, or biased.
3. Intersection of Carbon Credits and ESG Investing
Carbon credits and ESG investing are closely linked. Carbon credits primarily address environmental factors, which form a significant part of ESG considerations. Here’s how they intersect:
3.1 Carbon Credits as ESG Tools
Companies can purchase carbon credits to offset emissions, demonstrating commitment to environmental sustainability.
Carbon credits serve as measurable ESG actions that investors can evaluate when assessing environmental performance.
Integration of carbon credits into corporate ESG strategies enhances credibility and transparency in emissions reduction reporting.
3.2 Driving ESG-Compliant Investments
Investors increasingly consider companies’ carbon footprint and offset strategies when making investment decisions. Firms actively participating in carbon markets often attract ESG-focused capital, creating a feedback loop:
Investor Pressure: ESG-conscious investors demand action on climate-related risks.
Corporate Response: Companies adopt carbon offset projects, improve energy efficiency, and reduce emissions.
Market Incentive: This enhances long-term corporate value and reduces exposure to regulatory or environmental risks.
3.3 Role in Sustainable Finance
Sustainable finance refers to integrating ESG factors into financial systems to promote sustainable development. Carbon credits, green bonds, and ESG funds are instruments enabling sustainable finance:
Green Bonds: Proceeds are used for environmentally sustainable projects.
ESG Funds: Allocate capital to companies with strong ESG practices, often including carbon reduction initiatives.
Carbon Markets: Provide financial incentives for emissions reductions, complementing ESG investment strategies.
4. Global Trends and Market Dynamics
4.1 Carbon Market Growth
The global carbon market has expanded rapidly. According to the World Bank:
The market reached over $300 billion in value by 2023, with both compliance and voluntary markets growing.
Regulatory initiatives like the EU ETS, California Cap-and-Trade Program, and China’s national carbon market are driving compliance credit demand.
Voluntary carbon markets are increasingly used by multinational corporations to meet net-zero targets.
4.2 ESG Investment Growth
Global ESG assets are projected to surpass $50 trillion by 2025, representing over a third of total assets under management.
Institutional investors, pension funds, and sovereign wealth funds are incorporating ESG criteria into mainstream investment decisions.
ESG-focused indices and funds are becoming standard offerings in global capital markets.
4.3 Regional Variations
Europe: Leading in ESG adoption due to regulatory frameworks like the EU Sustainable Finance Disclosure Regulation (SFDR).
United States: ESG investing is growing, though regulatory clarity is evolving.
Asia-Pacific: Rapid adoption driven by corporate sustainability initiatives and investor demand, especially in Japan, India, and China.
5. Challenges and Criticisms
5.1 Carbon Credits
Lack of uniform verification standards.
Risk of over-reliance on offsets instead of direct emission reductions.
Potential for double counting or non-additionality (credits not leading to actual emission reductions).
5.2 ESG Investing
ESG rating agencies may use different methodologies, causing discrepancies.
Greenwashing remains a significant concern.
Measuring impact remains complex; financial returns are sometimes uncertain.
5.3 Integration Challenges
Combining ESG investment strategies with carbon credit mechanisms requires robust reporting and transparency.
Investors must carefully evaluate whether carbon offsets genuinely contribute to sustainability or merely serve marketing purposes.
Harmonization of global ESG standards is needed to streamline investment decisions.
6. Future Outlook
6.1 Regulatory Developments
Governments worldwide are introducing stricter ESG reporting and carbon disclosure requirements. These regulations are expected to:
Improve transparency in carbon markets.
Enhance corporate ESG reporting.
Encourage the adoption of standardized ESG metrics.
6.2 Technological Innovations
Blockchain: Enhances transparency in carbon credit trading and ESG reporting.
AI and Big Data: Improve ESG data collection, analysis, and predictive modeling.
Clean Technology: Investments in renewable energy, carbon capture, and sustainable agriculture will expand ESG and carbon credit opportunities.
6.3 Investor Behavior
Younger investors increasingly prioritize sustainability, pushing companies toward ESG compliance.
Impact investing and socially responsible funds will continue to grow.
Integration of carbon pricing into financial models will help assess corporate climate risk more accurately.
Conclusion
Carbon credits and ESG investing are pivotal in the transition toward a sustainable global economy. Carbon credits provide a mechanism to limit greenhouse gas emissions, incentivize environmental projects, and facilitate corporate accountability. ESG investing, on the other hand, allows investors to integrate sustainability into financial decisions, promoting ethical, responsible, and long-term value creation.
The synergy between these two concepts is crucial. Carbon credits complement ESG strategies by providing measurable environmental actions, while ESG investing channels capital toward sustainable and responsible enterprises. Together, they represent a shift in the financial world where profitability, sustainability, and societal impact are no longer mutually exclusive but increasingly interconnected.
As the global community confronts the challenges of climate change, resource scarcity, and social inequality, carbon credits and ESG investing will continue to play transformative roles in shaping investment strategies, corporate behavior, and ultimately, the sustainability of our planet.

ETHUSD (Ethereum / U.S. Dollar) on the 1-hour timeframe...ETHUSD (Ethereum / U.S. Dollar) on the 1-hour timeframe, here’s what stands out technically:
---
🧭 Chart Overview
The price has broken above a descending trendline, which is a bullish breakout signal.
The breakout is supported by Ichimoku confirmation — price is trading above the cloud, and the cloud ahead is turning bullish.
There’s a clear retest of the breakout zone (around $3,950–$3,970), where buyers stepped in again.
My marked a target point on the chart near the $4,225–$4,250 region.
---
🔍 Technical Breakdown
Current price: ~$4,040
Support zone: $3,950–$3,970 (retest area / Kijun + trendline retest)
Immediate resistance: $4,100–$4,150
Target zone (as shown): $4,220–$4,250
That corresponds closely to the measured move from the prior consolidation or inverse head-and-shoulders structure on the left side.
---
🎯 Expected Target
✅ Primary target: $4,225–$4,250
(aligns with your marked “target point” and measured breakout projection)
⚠ Stop-loss suggestion (for risk control): Below $3,930
(to stay safe if it dips back into the cloud)
---

Key Insights on Ethereum's 4-Hour ChartAs of October 19, 2025, Ethereum (ETH) is trading around $3,900, reflecting a period of consolidation after recent volatility, with analysis suggesting a balanced but potentially bullish setup if key resistances are broken.
The 4-hour chart shows a descending wedge pattern, which often signals a reversal; research indicates this could lead to upward momentum toward $4,400–$4,600 if ETH closes above $4,000–$4,100, though downside risks remain if support fails.
Indicators like RSI and MACD are neutral, leaning toward caution, while on-chain metrics such as declining exchange reserves and whale accumulation point to underlying strength, making a rally to $4,500 plausible by month's end amid broader market recovery.
Evidence leans toward a range-bound scenario in the short term, with potential for volatility expansion; traders should monitor for confirmed breakouts to avoid false moves.
Current Price and Recent Action
Ethereum's price stands at approximately $3,892 USD, with a slight 24-hour increase of about 0.6% from recent lows. Over the last few 4-hour candles, ETH has shown mild oscillation, rebounding from supports near $3,860 but facing rejection at higher levels, indicating indecision among buyers and sellers.
Key Patterns and Trends
On the 4-hour timeframe, ETH is forming a descending wedge, characterized by lower highs and lows converging toward a point near the $3,400–$3,500 demand zone. This pattern follows a sharp pullback from $4,200, suggesting compression that could resolve bullishly. Broader trends show ETH stabilizing after a 15% rebound from $3,435, aligning with daily bull flag formations that support upward bias if momentum builds.
Risks and Outlook
While the setup appears constructive, it remains at risk below critical resistances; a failure to hold $3,700 could expose lower supports. On-chain data offers optimism, with MVRV ratios at historical support levels hinting at rallies, but external factors like market sentiment could influence outcomes.
Price Action and Historical Context
Recent price action on the 4H chart reveals a series of lower highs and lows following a rejection from the $4,200 breakdown zone earlier in October. Over the last 10-20 candles, ETH has oscillated within a tight range, with bullish candles attempting rebounds from supports around $3,860 but facing consistent selling pressure near $3,930–$3,950. This follows a sharper decline from mid-October peaks near $4,500, where volume spiked during pullbacks, indicating profit-taking or liquidation events. Volume trends show a 24-hour trading volume of approximately $23.36 billion, with a volume-to-market-cap ratio of 0.1019, suggesting moderate liquidity but no explosive buying yet.
Historically, ETH has shown resilience at these levels; for instance, the all-time high reached $4,955 on August 23, 2025, before correcting. Year-to-date, ETH is up 46.95%, but the recent 15% rebound from a two-month low of $3,435 highlights a V-shaped recovery pattern, supported by institutional demand zones. Contrasting views from analysts note that while short-term weakness persists (e.g., from $4,450–$4,500 resistance), the structure remains intact for potential upside if global sentiment
Chart Patterns and Structures
The dominant pattern on the 4H timeframe is a descending wedge, formed after the rejection from $4,200, with converging trendlines indicating compression between buyers and sellers. The lower boundary aligns with the $3,400–$3,500 institutional demand zone, while the upper trendline coincides with resistance at $4,000–$4,100. This setup is often bullish, as wedges typically resolve upward, but confirmation requires a close above the descending trendline.
Part 6 Learn Institutional Trading Leverage and Speculation in Option Trading
Options provide leverage, allowing traders to control large positions with small investments. For instance, buying a single call option can represent ownership of 100 shares, magnifying both profits and losses. Speculators use this leverage to capitalize on short-term market moves. However, leverage also increases risk—if the market moves against the position, the entire premium can be lost. Successful speculators use strict risk management, combining analysis of volatility, momentum, and time decay to optimize entries and exits. While leverage makes options attractive, disciplined control is vital to avoid quick capital depletion.

High-Frequency Trading in the Indian MarketIntroduction
High-Frequency Trading (HFT) has emerged as one of the most sophisticated trading strategies in modern financial markets. It leverages advanced technology, high-speed networks, and complex algorithms to execute large volumes of trades in fractions of a second. Globally, markets such as the U.S., Europe, and Japan have witnessed a significant presence of HFT, impacting market liquidity, volatility, and trading costs. India, with its growing stock markets and increasing adoption of technology-driven trading, has also seen the rise of high-frequency trading. However, the Indian context presents unique regulatory, technological, and market-structure characteristics that distinguish it from developed markets.
What is High-Frequency Trading?
High-Frequency Trading is a type of algorithmic trading that focuses on executing trades at extremely high speeds, often measured in microseconds or milliseconds. The main characteristics of HFT include:
Speed: HFT relies on ultra-low-latency systems to execute trades faster than human traders or standard algorithmic strategies.
Algorithmic Decision-Making: Proprietary algorithms analyze market data, detect patterns, and automatically make trading decisions.
High Volume: HFT firms typically place a large number of trades with small profit margins per trade, relying on volume to generate significant returns.
Short Holding Periods: Positions are held for very brief periods, sometimes milliseconds, minimizing exposure to market risk.
Market Microstructure Exploitation: HFT strategies often exploit inefficiencies in market pricing, liquidity, and order execution.
HFT strategies can be broadly classified into the following types:
Market Making: Providing liquidity by continuously quoting buy and sell prices and profiting from the bid-ask spread.
Statistical Arbitrage: Exploiting statistical discrepancies between correlated instruments.
Event-Driven Trading: Reacting to news, earnings announcements, or macroeconomic events faster than competitors.
Latency Arbitrage: Exploiting differences in the speed of market information between exchanges.
Evolution of HFT in India
High-frequency trading in India is a relatively recent phenomenon compared to Western markets. The introduction of electronic trading in Indian stock exchanges in the late 1990s, followed by rapid adoption of technology and algorithmic trading in the 2000s, set the stage for HFT. Key milestones include:
Electronic Trading and NSE Launch (1994): The National Stock Exchange (NSE) introduced fully electronic trading, replacing open outcry systems, which facilitated faster trade execution.
Introduction of Algorithmic Trading (2008): SEBI allowed algorithmic trading with strict guidelines, enabling institutional investors and proprietary traders to implement HFT strategies.
Co-Location Services (2012): Exchanges such as NSE and BSE introduced co-location facilities, allowing HFT firms to place their servers physically close to exchange servers, reducing latency and execution time.
Growth in Market Participation: Over the last decade, HFT participation in India has grown steadily, accounting for a significant share of overall trading volumes in equities, derivatives, and currency markets.
Regulatory Framework Governing HFT in India
The Securities and Exchange Board of India (SEBI) regulates high-frequency trading to maintain market integrity, protect investors, and prevent market abuse. Key regulatory provisions include:
Algorithmic Trading Guidelines:
Traders must obtain prior approval from stock exchanges before using algorithms.
Exchanges monitor algorithms for market abuse, including manipulative strategies.
Co-Location Regulations:
Traders are allowed to place servers in proximity to exchange servers.
SEBI has mandated fair access policies, ensuring equal opportunity for all market participants.
Transparency requirements include real-time order monitoring and periodic audits.
Risk Management and Order Controls:
Exchanges require pre-trade risk checks to prevent erroneous orders.
Limits on order-to-trade ratios help control excessive messaging that can strain the market.
Market Surveillance:
SEBI employs sophisticated monitoring tools to detect potential manipulative practices like quote stuffing, layering, and spoofing.
While SEBI has created a framework for safe HFT, it remains cautious, emphasizing investor protection and market stability over unrestricted technological advancement.
Technological Infrastructure for HFT in India
High-frequency trading relies heavily on technological infrastructure, and India’s growing IT ecosystem has played a vital role. Critical components include:
Low-Latency Networks: HFT requires ultra-fast communication between trading firms and exchanges. Co-location, fiber-optic connectivity, and microwave links are used to minimize delays.
High-Performance Servers: Trading firms deploy powerful servers with advanced processors to handle massive data streams and execute algorithms rapidly.
Data Feeds: Real-time market data, order books, and news feeds are essential. Indian exchanges provide proprietary data feeds like NSE’s “NEAT” and BSE’s “BOLT” for HFT purposes.
Algorithm Development: Machine learning, statistical modeling, and predictive analytics are increasingly used to develop smarter algorithms capable of adapting to changing market conditions.
Impact of HFT on the Indian Market
The presence of high-frequency trading in India has both positive and negative implications:
Positive Impacts:
Enhanced Liquidity: HFT firms act as market makers, reducing bid-ask spreads and facilitating smoother trading for all participants.
Price Discovery: Rapid trading ensures that prices reflect new information almost instantly, improving market efficiency.
Reduced Transaction Costs: Tight bid-ask spreads and high competition among HFTs lead to lower trading costs for regular investors.
Negative Impacts:
Market Volatility: Ultra-fast trading can exacerbate price swings during periods of stress, as seen in flash crashes.
Unfair Advantage: Traders with superior technology and co-location access may dominate, creating a perception of inequality.
Potential Manipulation: Strategies like layering, spoofing, and quote stuffing can distort prices and harm genuine investors.
Despite these concerns, SEBI’s vigilant monitoring and risk management frameworks have minimized systemic risks, making India’s HFT ecosystem more controlled compared to less-regulated markets.
HFT Strategies Used in India
Some commonly observed HFT strategies in India include:
Market Making: Many HFT firms act as liquidity providers in NSE and BSE equities and derivatives markets, continuously posting bid and ask prices to profit from spreads.
Statistical Arbitrage: Arbitrage opportunities exist between futures and underlying stocks or between correlated securities. HFT algorithms detect these discrepancies and execute trades at lightning speed.
Index Arbitrage: Futures and index components sometimes have misaligned prices, which HFTs exploit for instant profits.
Latency Arbitrage: Traders exploit slight delays in price updates between exchanges or data feeds, gaining microsecond-level advantages.
Event-Based Strategies: Reactions to corporate announcements, macroeconomic data releases, or global market movements allow HFTs to anticipate price changes faster than traditional traders.
Challenges for HFT in India
Despite technological and regulatory progress, HFT faces unique challenges in India:
Infrastructure Constraints: Although exchanges offer co-location, latency can still be higher than global standards, limiting the competitiveness of Indian HFT firms internationally.
Regulatory Restrictions: Strict SEBI regulations on order-to-trade ratios, pre-trade risk checks, and algorithm approvals require continuous compliance efforts.
Market Depth: While liquidity has improved, some Indian stocks still have shallow markets, making HFT strategies less effective.
Competition from Global Players: International HFT firms entering India can outcompete domestic players due to superior technology and experience.
Ethical Concerns: HFT is often criticized for favoring speed over fundamentals, raising questions about market fairness.
Future of High-Frequency Trading in India
The future of HFT in India looks promising, driven by technological advances, increasing digital adoption, and regulatory evolution. Key trends include:
Artificial Intelligence and Machine Learning: Next-generation algorithms will leverage AI to detect patterns and adapt dynamically to market conditions.
Expansion into Derivatives and Currency Markets: As Indian derivatives and currency markets mature, HFT participation is expected to increase, offering better liquidity and efficiency.
Global Integration: Indian HFT firms may collaborate with global players, adopting international best practices while contributing to domestic market sophistication.
Regulatory Evolution: SEBI may further refine co-location and algorithmic trading norms to balance innovation with investor protection.
Technological Innovation: Investments in ultra-low-latency infrastructure, quantum computing, and advanced analytics will redefine competitiveness in HFT.
Conclusion
High-frequency trading has become an integral part of the Indian financial markets, enhancing liquidity, improving price discovery, and reducing transaction costs. At the same time, it presents challenges such as increased volatility, regulatory oversight, and ethical concerns. The Indian market, with its robust regulatory framework and growing technological infrastructure, is uniquely positioned to adopt HFT responsibly.
With continuous innovation, effective regulation, and market evolution, HFT in India is likely to grow further, playing a critical role in shaping the future of electronic trading. For investors, policymakers, and trading firms, understanding HFT is crucial, as it represents both an opportunity and a challenge in India’s rapidly modernizing capital markets.

Private vs Public Banks: Role in the Indian Trading Market1. Overview of Public and Private Banks in India
1.1 Public Sector Banks (PSBs)
Public sector banks are those where the majority ownership (more than 50%) lies with the Government of India. Examples include the State Bank of India (SBI), Punjab National Bank (PNB), Bank of Baroda, and Canara Bank. PSBs dominate the Indian banking sector in terms of branch network, assets under management (AUM), and reach, particularly in rural and semi-urban regions.
Key Characteristics of PSBs:
Government-owned with social and development mandates.
Conservative in risk-taking.
Large customer base across rural and urban India.
Often involved in policy-driven lending and financial inclusion schemes.
1.2 Private Sector Banks (PVBs)
Private banks, such as HDFC Bank, ICICI Bank, Axis Bank, and Kotak Mahindra Bank, are owned predominantly by private shareholders. These banks are known for customer-centric approaches, high efficiency, and greater use of technology. They have grown rapidly in the last two decades and now have significant influence in retail, corporate, and investment banking.
Key Characteristics of PVBs:
Privately owned with profit-driven motives.
Higher risk appetite and innovative products.
Focused on urban and semi-urban populations.
Advanced technological adoption and superior customer service.
2. Role in the Indian Trading Market
The Indian trading market comprises equities, commodities, derivatives, forex, and bond markets. Both private and public banks play distinct roles in facilitating trading activities, investment, and capital flow.
2.1 Providing Capital and Liquidity
PSBs: They are crucial in funding large-scale corporate and government projects, which indirectly impacts trading markets by providing liquidity and supporting corporate growth. PSBs often lend to companies whose stocks or bonds are actively traded in the market.
PVBs: These banks are more active in retail lending, margin finance, and funding startups or small-cap companies. By offering working capital, they help increase market participation and trading volumes.
2.2 Investment Banking and Market Operations
PSBs: Traditionally, PSBs have a limited role in high-risk investment banking activities. However, banks like SBI Capital Markets actively participate in primary market issuances (IPOs) and underwriting services, supporting capital formation.
PVBs: Private banks are more aggressive in equity and bond issuance, IPO management, advisory services, and mergers & acquisitions (M&A). They provide liquidity to the trading market and cater to institutional investors, contributing to market depth.
2.3 Facilitating Retail and Institutional Trading
Retail Market: Private banks lead in offering demat accounts, online trading platforms, and wealth management services, making trading accessible to individual investors. PSBs have been slower in digital adoption but still serve a large customer base with affordable services.
Institutional Market: PSBs dominate government securities (G-Secs) trading, large-scale corporate bonds, and interbank transactions, whereas PVBs are more flexible in providing structured products and derivatives to hedge risks in trading portfolios.
3. Technological Innovation and Trading Efficiency
3.1 Digital Platforms
PVBs: Banks like HDFC, ICICI, and Kotak Mahindra have pioneered digital banking solutions, including online trading, mobile apps, algorithmic trading support, and seamless payment gateways. These platforms enhance efficiency in stock, forex, and commodity markets.
PSBs: Although improving, public banks have traditionally lagged in adopting high-speed trading platforms. Their digital offerings are often centralized but less user-friendly for advanced traders.
3.2 Data Analytics and Market Insights
Private banks leverage big data analytics and AI-driven trading advisory, providing traders and investors with market insights, technical analysis, and risk management tools.
Public banks, while increasingly offering research services, focus mainly on policy-driven investment guidance and macroeconomic reports.
4. Risk Management and Market Stability
4.1 Risk Appetite
PSBs: Conservative lending and trading practices help maintain market stability, preventing excessive speculation. However, this may limit high-growth opportunities in trading markets.
PVBs: Their higher risk appetite fosters innovation and liquidity but may also contribute to volatility, especially in derivatives and structured products.
4.2 Crisis Management
PSBs: During market downturns, public banks play a stabilizing role by maintaining credit flow to companies and acting as government channels for economic stimulus.
PVBs: While they provide risk-mitigating tools like hedging products, their reliance on market-driven profits makes them vulnerable during severe market corrections.
5. Role in Government and Policy Initiatives
PSBs are instrumental in implementing government-backed schemes like MUDRA loans, priority sector lending (PSL), and disbursal of subsidies. These measures impact trading indirectly by enhancing disposable income and liquidity in the economy.
PVBs participate in policy initiatives selectively, often aligning with profit motives, such as facilitating corporate bond markets, IPO underwriting, and private wealth management.
6. Impact on Stock, Commodity, and Forex Markets
6.1 Equity Market
PSBs: Major institutional investors; provide long-term funding and participate in strategic equity investments. Their trading volume may be lower but stable.
PVBs: Retail-oriented and innovative products enhance equity market participation. They facilitate derivatives trading, margin financing, and high-frequency trading for active investors.
6.2 Commodity Market
PSBs: Serve as financing partners for commodity producers and importers, ensuring supply chain liquidity.
PVBs: Offer customized hedging solutions and online platforms for commodity trading, attracting active market participants.
6.3 Forex Market
PSBs: Dominant in external commercial borrowing (ECB), trade finance, and remittance services, crucial for forex stability.
PVBs: Provide competitive forex services, real-time trading, and risk management tools for businesses and individual traders.
7. Comparative Analysis: Public vs Private Banks
Aspect Public Sector Banks Private Sector Banks
Ownership Government Private
Risk Appetite Conservative Higher
Market Reach Nationwide, including rural Urban & semi-urban focused
Technology Adoption Moderate High
Retail Trading Support Limited digital services Advanced platforms & apps
Institutional Role Government & corporate Corporate & investment banking
Market Stability Stabilizing Liquidity enhancer, can be volatile
Financial Inclusion High Moderate
Trading Products Traditional bonds, G-Secs Derivatives, structured products, margin trading
8. Challenges and Opportunities
8.1 Challenges
PSBs: Legacy systems, NPA (Non-Performing Asset) issues, slower technological adoption, and bureaucratic decision-making hinder active participation in fast-paced trading markets.
PVBs: Exposure to market volatility, regulatory pressures, and high competition requires constant innovation to remain relevant in trading markets.
8.2 Opportunities
PSBs: Digital transformation, strategic partnerships with fintechs, and expanding advisory services can boost their trading market role.
PVBs: Expanding into rural markets, leveraging AI-driven trading analytics, and tapping government-backed schemes offer growth potential.
9. Conclusion
The roles of public and private banks in the Indian trading market are complementary rather than competitive. Public banks provide stability, government-backed funding, and long-term institutional support, making them pillars of the financial ecosystem. Private banks, in contrast, drive innovation, liquidity, and retail participation through advanced technology, flexible financial products, and customer-centric services.
Together, both sectors enhance market efficiency, capital formation, risk management, and investor confidence, ensuring the Indian trading market remains vibrant and robust. The future of India’s trading ecosystem will increasingly depend on how both public and private banks leverage technology, collaborate with fintechs, and balance risk with sustainable growth.

Part 1 Master Class of Intraday Trading Understanding the Concept of Options
Option trading involves financial contracts that give buyers the right, but not the obligation, to buy or sell an underlying asset—like a stock, index, or commodity—at a predetermined price within a specific period. The two main types are Call Options (buy rights) and Put Options (sell rights). Unlike owning shares directly, options let traders speculate on price movements with limited capital. The right to buy or sell comes at a cost known as the premium. Options are widely used for hedging, speculation, and income generation. Their value is influenced by factors such as volatility, time decay, and market sentiment. Understanding these dynamics helps traders manage risk and seize market opportunities efficiently.

Part 3 Institutional Trading Put Options Explained
A put option gives the holder the right to sell an asset at a fixed strike price within a certain timeframe. Traders buy put options when they anticipate a price decline. For instance, if a stock is trading at ₹100 and you buy a put at ₹95, you profit when the price falls below ₹95 minus the premium. Puts are useful for hedging—protecting against potential losses in long positions—or for speculation during bearish trends. They are crucial tools for risk management and profit in declining markets.

Position Sizing for Different Trading Strategies1. Why Position Sizing Matters
Position sizing directly affects risk management. Even a profitable strategy can lead to account depletion if positions are too large relative to your capital. Conversely, if positions are too small, your returns will be suboptimal. Proper position sizing ensures that no single trade can jeopardize your entire trading account.
Key reasons position sizing matters:
Risk Control: Limits losses on any single trade.
Consistency: Ensures uniform risk exposure across trades.
Psychological Comfort: Helps traders manage emotions and stick to their strategy.
Maximizing Returns: Optimizes capital usage without taking excessive risk.
2. Core Concepts in Position Sizing
Before diving into strategy-specific sizing, understanding core concepts is essential:
2.1 Risk per Trade
This is the percentage of your total capital you are willing to risk on a single trade. Commonly, traders risk 1–3% per trade, depending on their risk tolerance.
2.2 Stop Loss
Stop loss defines the price at which you will exit a trade to prevent further losses. It directly influences position size: the closer the stop, the larger the position you can take, and vice versa.
2.3 Volatility
More volatile assets require smaller positions, as they are prone to larger price swings. Measures like Average True Range (ATR) help determine an appropriate position size relative to market volatility.
2.4 Account Size
Your total trading capital determines the absolute value of positions. Traders with smaller accounts may use tighter risk management rules to avoid blow-ups.
2.5 Reward-to-Risk Ratio
The potential reward compared to the risk taken affects sizing decisions. Higher reward-to-risk ratios may justify larger position sizes.
3. Position Sizing Methods
Several mathematical methods help determine the ideal position size:
3.1 Fixed Dollar Risk
You risk a fixed amount of money per trade regardless of the asset. For example, a trader risking $100 per trade will always limit losses to $100, whether trading a volatile stock or a low-volatility ETF.
3.2 Fixed Fractional
This method risks a fixed percentage of capital on each trade, which adjusts with account growth or decline. It is widely used due to its simplicity and adaptability.
Example:
With $50,000 capital and a 2% risk, the maximum loss per trade is $1,000. If the risk per share is $5, the position size is $1,000 ÷ $5 = 200 shares.
3.3 Volatility-Based Position Sizing
Adjusts position size according to market volatility. Higher volatility → smaller position size, lower volatility → larger position size. Tools like ATR are commonly used.
4. Position Sizing for Day Trading
Day traders enter and exit positions within the same day, often making multiple trades daily. Because trades are short-term and volatility can be high, risk management is crucial.
Typical Risk per Trade: 0.5–1% of account
Stop Loss: Tight, often based on intraday support/resistance or ATR
Position Size Method: Fixed fractional or volatility-based
Example:
If a trader has $100,000 and risks 1% ($1,000) per trade, with a $2 intraday stop, the position size is $1,000 ÷ $2 = 500 shares.
Key Tips for Day Traders:
Avoid over-leveraging during volatile sessions
Use intraday ATR for adjusting position size dynamically
Focus on liquidity to ensure smooth entry and exit
5. Position Sizing for Swing Trading
Swing traders hold positions from a few days to weeks to capture medium-term price moves. Risk is usually higher than day trading because positions are exposed to overnight and weekend gaps.
Typical Risk per Trade: 1–2% of account
Stop Loss: Wider than day trading, set based on technical levels
Position Size Method: Fixed fractional with ATR adjustment
Example:
A swing trader with $50,000 account risks 2% ($1,000). If the stop loss is $5 per share, the position size is 200 shares. For a stock with higher volatility (stop loss $10), the position size reduces to 100 shares.
Key Tips for Swing Traders:
Factor in overnight risk and earnings events
Adjust positions for volatility spikes
Diversify positions across sectors to reduce correlated risk
6. Position Sizing for Trend Following
Trend followers aim to ride long-term trends, often holding positions for weeks or months. These traders are willing to tolerate larger drawdowns in exchange for higher profits.
Typical Risk per Trade: 1–3%
Stop Loss: Wide, based on trend-defining support/resistance
Position Size Method: Volatility-based or fixed fractional with trailing stops
Example:
For a $100,000 account, a trend follower might risk 2% ($2,000) per trade. Using ATR for volatility measurement, a higher ATR reduces position size to prevent excessive risk during volatile trends.
Key Tips for Trend Followers:
Use volatility-adjusted stops to avoid getting stopped out prematurely
Scale into positions as trend strength confirms
Monitor correlation to avoid overexposure in the same market
7. Position Sizing for Scalping
Scalping involves making dozens or hundreds of trades per day to exploit small price movements. Risk per trade is tiny, but leverage and trade frequency increase overall risk.
Typical Risk per Trade: 0.1–0.25%
Stop Loss: Very tight, often a few ticks or cents
Position Size Method: Fixed fractional with tight risk controls
Example:
A scalper with $50,000 may risk 0.2% ($100) per trade. If stop loss is $0.10, the position size is $100 ÷ $0.10 = 1,000 shares/contracts.
Key Tips for Scalpers:
Execution speed and tight spreads are crucial
Monitor cumulative risk across multiple trades
Avoid trading during illiquid or volatile news events
8. Position Sizing for Options Trading
Options offer leverage, which makes position sizing critical. Option traders often risk a percentage of the premium or account rather than the underlying stock price.
Typical Risk per Trade: 1–3%
Stop Loss: Based on option premium or underlying price movement
Position Size Method: Fixed fractional or risk-defined based on delta
Example:
If a trader has $50,000 and risks 2% ($1,000) per trade on call options costing $5 each, they could buy 200 contracts.
Key Tips for Options Traders:
Factor in implied volatility changes
Avoid allocating too much capital to high-risk out-of-the-money options
Consider position delta to manage exposure to the underlying asset
9. Adjusting Position Size Based on Market Conditions
Market conditions influence position sizing significantly:
High Volatility: Reduce position size to limit risk
Low Volatility: Increase position size cautiously
Correlated Assets: Adjust sizes to prevent overexposure
Economic Events: Reduce exposure during major announcements
Dynamic position sizing is a hallmark of professional traders, allowing them to adapt to changing market environments without compromising risk control.
10. Common Mistakes in Position Sizing
Even experienced traders make mistakes with position sizing:
Ignoring Risk: Taking trades without defining risk can lead to catastrophic losses.
Overleveraging: Using excessive leverage magnifies small losses.
Inconsistent Sizing: Risking different percentages randomly undermines risk management.
Neglecting Volatility: Treating volatile assets the same as stable ones leads to oversized positions.
Not Scaling: Failing to adjust position size as account grows or shrinks.
Avoiding these mistakes is essential for long-term success.
11. Tools and Software for Position Sizing
Modern traders often rely on tools to calculate position size automatically:
Trading Platforms: MetaTrader, ThinkorSwim, NinjaTrader
Risk Calculators: Many online calculators allow inputs for account size, stop loss, and risk per trade
Excel Sheets: Customizable for advanced traders using multiple strategies
These tools save time and prevent errors in manual calculation.
12. Psychological Benefits of Proper Position Sizing
Position sizing is not only about numbers; it also affects trader psychology:
Confidence: Knowing risk is controlled reduces stress.
Discipline: Helps traders stick to strategy without emotional interference.
Consistency: Prevents revenge trading after losses.
A trader who masters position sizing often experiences steadier account growth and lower emotional volatility.
13. Summary and Best Practices
Position sizing is a cornerstone of risk management and long-term trading success. Key takeaways:
Determine your risk per trade relative to account size.
Adjust size based on stop loss, volatility, and trading strategy.
Use fixed fractional, volatility-based, or Kelly criterion methods.
Day traders use tight stops and small risks, swing traders use moderate risk and wider stops, trend followers rely on volatility-based sizing, and scalpers use very small per-trade risk.
Avoid common mistakes like ignoring volatility, overleveraging, or inconsistent sizing.
Employ tools and calculators to ensure accuracy.
Remember that position sizing protects both capital and mental composure.
By combining the right strategy with disciplined position sizing, traders can survive losses, ride profits, and grow their accounts consistently over time.
Conclusion:
Position sizing is the unsung hero of successful trading. It is what separates consistent traders from those who rely solely on prediction and luck. Whether you are a day trader, swing trader, trend follower, scalper, or options trader, understanding and applying proper position sizing can dramatically improve your risk-adjusted returns. Mastering this skill is not optional—it is essential for long-term profitability and trading survival.
ETH Retest Confirmed – Bullish Momentum Intact!CMP: $3,968
Ethereum is holding strong above the symmetrical triangle breakout zone after a textbook breakout + retest . Despite the recent consolidation, the structure remains bullish , and the bigger pattern is still in play.
🔶 Technical Highlights:
✅ Symmetrical Triangle Breakout: ETH successfully broke out and retested the upper trendline (see red circle). This retest confirms the breakout validity.
✅ Consolidation Above Resistance: ETH is consolidating in a tight range above previous resistance , forming a potential bull flag .
✅ Pattern Targets Remain Active:
📍 Symmetrical Triangle Target: ~$7,950
📍 Bull Flag Target (if breakout confirms): ~$7,365+
📈 Market Structure:
📍 Previous breakouts (Bullish Pennant in 2016, Falling Wedge in 2019) led to strong uptrends .
📍 Current consolidation mirrors historical patterns that preceded major rallies.
🟢 Key Level to Watch:
📍 A monthly close above $4,954.16 (previous ATH) would mark the next major confirmation, likely attracting breakout traders and institutions.
💡 ETH is showing maturity in structure – breakouts, retests, and consolidations are happening on higher timeframes with clear technical precision. The longer this base holds, the stronger the eventual move could be.
📌 Disclaimer: This analysis is shared for educational purposes only. It is not a buy/sell recommendation. Please do your own research before making any trading decisions.
#ETH | #Ethereum | #Crypto | #Breakout | #ChartPatterns | #SymmetricalTriangle | #BullFlag | #PriceAction
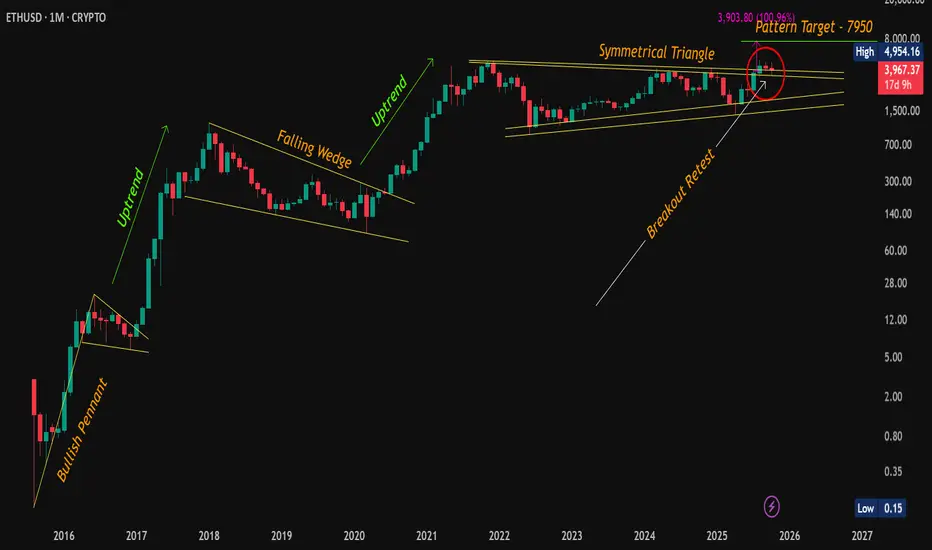
Crypto Trading Guide1. Introduction to Crypto Trading
Cryptocurrency trading involves buying, selling, and exchanging digital assets in order to profit from price fluctuations. Unlike traditional markets, crypto trading operates 24/7 due to the decentralized nature of blockchain technology. The crypto market is highly volatile, which presents both opportunities and risks for traders. Popular cryptocurrencies include Bitcoin (BTC), Ethereum (ETH), Ripple (XRP), Cardano (ADA), and many more altcoins.
Crypto trading is divided into two main categories:
Spot Trading: Buying and selling cryptocurrencies for immediate settlement.
Derivatives Trading: Using financial contracts like futures and options to speculate on price movements without owning the underlying asset.
2. Understanding the Crypto Market
2.1 Market Structure
The crypto market is unique in its decentralized, borderless structure. Unlike traditional markets with centralized exchanges, crypto operates via:
Centralized Exchanges (CEX): Platforms like Binance, Coinbase, and Kraken. These offer high liquidity but require trust in the platform.
Decentralized Exchanges (DEX): Platforms like Uniswap and SushiSwap. These run on smart contracts and allow peer-to-peer trading.
2.2 Market Participants
Crypto market participants include:
Retail Traders: Individual traders buying or selling for personal gain.
Institutional Traders: Hedge funds, banks, and large investors.
Market Makers: Entities that provide liquidity by simultaneously placing buy and sell orders.
2.3 Market Hours
Unlike stock markets, crypto markets operate 24/7, which allows traders to react to news and events instantly. However, this also increases the risk of impulsive decisions.
3. Types of Crypto Trading
3.1 Spot Trading
Spot trading is the simplest form of crypto trading where traders buy crypto at current market prices. Key considerations include:
Order Types: Market orders (buy/sell immediately), limit orders (buy/sell at a specific price), and stop-loss orders (automated exit at a set loss level).
Portfolio Diversification: Spreading investments across multiple assets reduces risk.
Risk Management: Setting strict entry and exit rules is critical due to high volatility.
3.2 Margin Trading
Margin trading allows traders to borrow funds to increase exposure. For example, with 10x leverage, a $100 trade controls $1000 worth of assets.
Risks: Margin trading amplifies both profits and losses. Liquidation occurs if losses exceed collateral.
3.3 Futures and Options Trading
Derivatives trading enables speculation on price movements:
Futures Contracts: Agreements to buy or sell an asset at a future date at a predetermined price.
Options Contracts: Rights (but not obligations) to buy or sell at a fixed price within a certain time.
Perpetual Contracts: Futures with no expiry, commonly used in crypto derivatives markets.
3.4 Algorithmic and Bot Trading
Automated trading uses algorithms to execute trades based on predefined strategies:
Trend-following bots: Buy in uptrends, sell in downtrends.
Arbitrage bots: Exploit price differences between exchanges.
Market-making bots: Provide liquidity while capturing spreads.
4. Fundamental Analysis (FA) in Crypto
FA evaluates a cryptocurrency’s intrinsic value based on technology, adoption, and market dynamics. Key factors include:
Whitepapers: Technical documents explaining the coin’s purpose, roadmap, and use cases.
Development Activity: Active GitHub commits and project updates indicate sustainability.
Network Metrics: On-chain data like transaction volume, wallet addresses, and staking rates.
Regulatory Environment: Government policies can significantly affect prices.
5. Technical Analysis (TA) in Crypto
TA uses historical price data to predict future trends. Key tools and concepts include:
5.1 Chart Patterns
Triangles, Head & Shoulders, Double Tops/Bottoms: Patterns indicate potential reversals or continuations.
Support and Resistance Levels: Price points where buying or selling pressure is strong.
5.2 Indicators and Oscillators
Moving Averages (MA): SMA, EMA help identify trends.
Relative Strength Index (RSI): Measures overbought or oversold conditions.
MACD (Moving Average Convergence Divergence): Trend and momentum indicator.
Bollinger Bands: Measure volatility and potential breakout points.
5.3 Volume Analysis
High trading volume confirms price trends, while low volume may indicate weak moves.
6. Risk Management
Effective risk management is crucial in crypto due to volatility:
Position Sizing: Risk only a small percentage (1–3%) of your capital per trade.
Stop-loss Orders: Limit potential losses automatically.
Diversification: Spread investments across multiple coins and strategies.
Avoid Overleveraging: Using excessive leverage increases the chance of liquidation.
7. Trading Strategies
7.1 Day Trading
Traders buy and sell within the same day to profit from short-term price movements. Requires constant monitoring.
7.2 Swing Trading
Holding positions for days or weeks to capture medium-term trends. Combines TA and FA.
7.3 Scalping
Quick trades lasting seconds to minutes. Focuses on small price changes with high frequency.
7.4 HODLing
Long-term strategy where traders hold assets regardless of market fluctuations. Common with Bitcoin and Ethereum.
8. Psychology of Crypto Trading
Emotional discipline separates successful traders from losers:
Avoid FOMO (Fear of Missing Out): Impulsive buying during rapid price surges can lead to losses.
Control Greed: Exiting trades too late can reverse profits.
Patience and Discipline: Following a strategy consistently is more important than predicting the market perfectly.
9. Security and Safety
Crypto security is critical due to hacks and scams:
Wallets:
Hot Wallets: Online wallets for active trading; convenient but vulnerable.
Cold Wallets: Offline storage; highly secure for long-term holdings.
Two-Factor Authentication (2FA): Adds an extra security layer.
Exchange Reputation: Use reputable exchanges with insurance and strong security protocols.
10. Taxes and Regulations
Crypto trading is subject to tax in most countries. Regulations vary widely:
Taxable Events: Selling crypto, converting to fiat, or trading one coin for another.
Reporting Requirements: Maintain transaction records for audits.
Regulatory Compliance: Know your country’s laws to avoid legal issues.
11. Tools and Resources
Traders rely on tools for research, trading, and risk management:
Trading Platforms: Binance, Coinbase, Kraken.
Charting Tools: TradingView, Coinigy.
News Sources: CoinDesk, CoinTelegraph, CryptoSlate.
Portfolio Trackers: Blockfolio, Delta App.
12. Common Mistakes to Avoid
Ignoring risk management rules.
Overtrading or excessive leverage.
Falling for pump-and-dump schemes.
Neglecting security practices.
Blindly following social media tips.
13. Emerging Trends in Crypto Trading
DeFi (Decentralized Finance): Lending, borrowing, and yield farming.
NFTs (Non-Fungible Tokens): Digital collectibles and gaming assets.
Layer 2 Solutions: Faster, cheaper transactions on Ethereum (e.g., Polygon).
AI-Powered Trading: Leveraging artificial intelligence for predictive analytics.
14. Conclusion
Crypto trading offers immense profit potential but comes with high risk. Success requires a combination of:
Strong technical and fundamental analysis skills.
Effective risk and money management.
Psychological discipline and patience.
Staying updated with market trends, news, and regulatory changes.
By developing a systematic trading plan, diversifying strategies, and prioritizing security, traders can navigate the volatile crypto markets more confidently.
Part 9 Trading Master Class With Experts Option Chain and Market Data
Traders analyze the option chain—a table showing available strikes, premiums, and open interest.
Key Insights from Option Chain:
Open Interest (OI):
High OI at a strike → strong support or resistance zone.
Change in OI:
Helps identify where traders are building positions.
Put-Call Ratio (PCR):
Indicator of market sentiment.
PCR > 1 → bullish sentiment; PCR < 1 → bearish.
Option chain analysis helps identify market bias, expected ranges, and potential breakout zones.

ETHUSD TRADING LEVELSETHUSD TRADING LEVELS. Anyone can Trade on both sides (as per levels)
Levels shared on chart

Ethereum will be continued sell on rise until 4050 not break Ethereum selll on rise until 4050 not break ,
Updated levels given on chart for next week
How My Harmonic pattern projection Indicator work is explained below :
Recent High or Low :
D-0% is our recent low or high
Profit booking zone ( Early / Risky entry) : D 13.2% -D 16.1 % is
range if break them profit booking start on uptrend or downtrend but only profit booking, trend not changed
SL reversal zone (Safe entry ) : SL 23.1% and SL 25.5% is reversal zone if break then trend reverse and we can take reverse trade
Target : T1, T2, T3, T4 and .
Are our Target zone
Any Upside or downside level will activate only if break 1st level then 2nd will be active if break 2nd then 3rd will be active.
Total we have 7 important level which are support and resistance area
Until , 16% not break uptrend will continue if break then profit booking will start.
If break 25% then fresh downtrend will start then T1, T2,T3 will activate
1,3,5,10,15,20 minutes are short term levels.
30 minutes 60 minutes , 2 hours,3 hours, ... 1 day and 1 week chart positional and long term levels
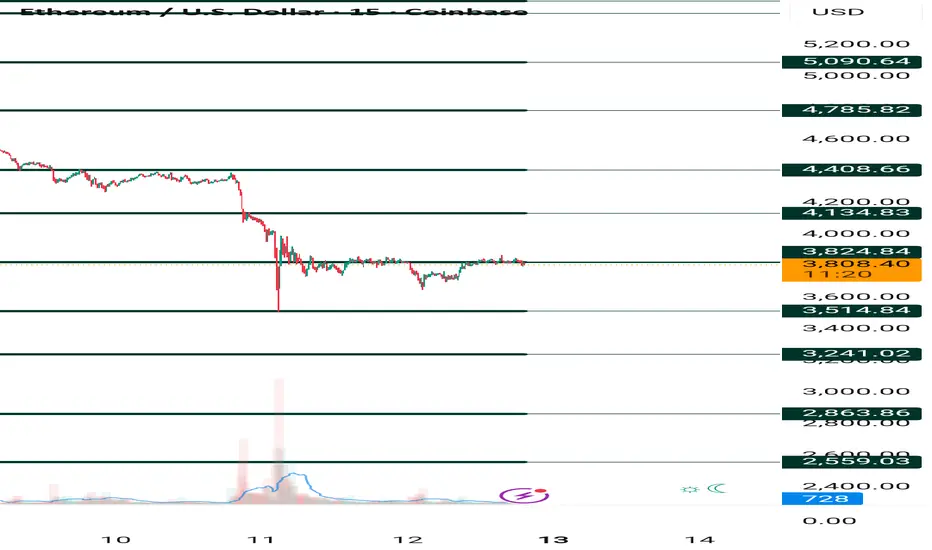
BTCUSD and ETHUSD BTCUSD and ETHUSD could not break the hurdle and formed nearly a triple top pattern. Some reversal has been seen. Maybe could fall some more. One should consider co-relating it with the trend of Gold and find entry opportunities in Crypto (just as a hedge in my view).

Part 2 Trading Master Class With ExpertsHow Option Trading Works
Let’s take a practical example:
Suppose you buy a Nifty 50 Call Option with a strike price of ₹22,000, expiring in one month, by paying a premium of ₹100 per lot (lot size 50).
If Nifty moves up to 22,500 before expiry — your call option becomes profitable because you can buy at 22,000 (strike) and sell at 22,500 (market price).
If Nifty falls to 21,800 — your option becomes worthless, and you lose only the ₹100 premium.
In short, your risk is limited to the premium paid, but your profit potential is unlimited (for call buyers).
Similarly, for a put option, profits come when the market goes down.
