Ethereum updated levels, buy in dip previous ATH target openHow My Harmonic pattern projection Indicator work is explained below :
Recent High or Low :
D-0% is our recent low or high
Profit booking zone: D13% -D15% is
range if break them profit booking start on uptrend or downtrend but only profit booking, trend not changed
SL reversal zone : SL 23% and SL 25% is reversal zone if break then trend reverse and we can take reverse trade
Target : T1, T2, T3, T4 and .
Are our Target zone
ETHUSD.P trade ideas

Best Possible Elliott Wave Counts: ETHUSDHello friends,
Welcome RK_Chaarts.
Today we're attempting to analyze Ethereum's chart from an Elliott Wave perspective. Looking at the monthly timeframe chart, we can see that from the beginning, around 2015-2016, when data is available, to the top in 2021 we have a Super Cycle degree Wave (I) marked in blue, which has completed.
Next, June 2022 we have a bottom around $874, marking the end of Super Cycle Wave (II) in blue.
We are now unfolding Wave (III), which should have five sub-divisions. Within this, the red Cycle degree Wave I and Wave II have completed, and we have possibly started the third of third wave.
Monthly:
Moving to a lower timeframe (Weekly) where we observed the completion of blue Wave (II) and the start of Wave (III), we notice that within this, the red Cycle degree Wave I and Wave II have completed, and we've possibly started Wave III of cycle degree marked in Red.
Furthermore, friends, within this third wave, we've marked the black Primary degree Waves ((1)) and ((2)), which we've labeled as Rounded ((1)) and Rounded ((2)). We're assuming these are complete, and Wave ((3)) has started, which is our current working hypothesis.
Weekly:
Now, if we move to a lower timeframe, such as the daily chart, we can see that the Cycle degree Wave II, which ended at 1385.70, has been followed by a Primary degree black Wave ((1)) in Black & Wave ((2)) has pulled back, completing Waves ((1)) and ((2)), and now Primary degree Wave ((3)) has started.
Possible wave counts on Daily
Within Wave ((3)), we expect five Intermediate degree waves. We've marked the first Intermediate degree Wave (1) in blue, which is currently unfolding. If we move to an even lower timeframe, such as the 4-hour chart, we can see that within the Intermediate degree blue Wave (1), there are five Minor degree sub-divisions marked in red. Waves 1 and 2 are complete, and Wave 3 is nearing completion.
Possible wave counts on 4 Hours:
Once Wave 3 is complete, we expect Waves 4 and 5 to follow, completing the Intermediate degree blue Wave (1). After that, we may see a dip in the form of Wave (2), followed by a continuation of the bullish trend as blue Wave (3).
Possible wave counts on 60 Min:
Friends, based on our multi-timeframe analysis, the overall wave structure appears bullish. We've provided snapshots of each timeframe, and you can see the nearest invalidation level marked with a red line.
In this study, we're using Elliott Wave theory and structure, which involves multiple possibilities. The scenario we're presenting seems plausible because it's aligned across multiple timeframes and adheres to Elliott Wave principles. However, please remember that this analysis can be wrong, and you should consult with a financial advisor before making any investment decisions.
This post is shared purely for educational purposes, to illustrate possible Elliott Waves.
I am not Sebi registered analyst.
My studies are for educational purpose only.
Please Consult your financial advisor before trading or investing.
I am not responsible for any kinds of your profits and your losses.
Most investors treat trading as a hobby because they have a full-time job doing something else.
However, If you treat trading like a business, it will pay you like a business.
If you treat like a hobby, hobbies don't pay, they cost you...!
Hope this post is helpful to community
Thanks
RK💕
Disclaimer and Risk Warning.
The analysis and discussion provided on in.tradingview.com/u/RK_Chaarts/ is intended for educational purposes only and should not be relied upon for trading decisions. RK_Chaarts is not an investment adviser and the information provided here should not be taken as professional investment advice. Before buying or selling any investments, securities, or precious metals, it is recommended that you conduct your own due diligence. RK_Chaarts does not share in your profits and will not take responsibility for any losses you may incur. So Please Consult your financial advisor before trading or investing.

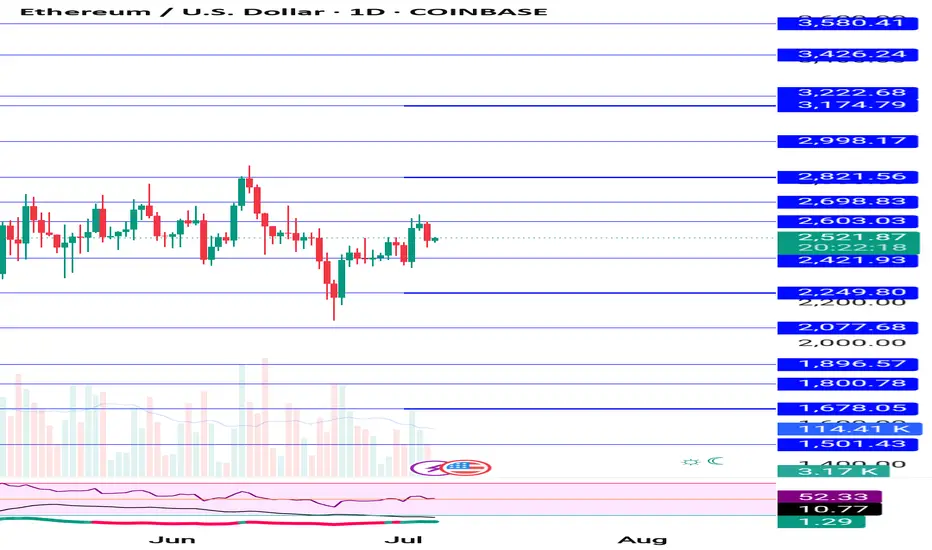
ETHUSD📈 BITSTAMP:ETHUSD Weekly Chart | CMP: $2975
✅ Flag breakout above $2750
✅ Triangle breakout confirmed
📉 Previous range: High $4105 (Dec 2024) – Low $1385 (Apr 2025)
With current breakout holding, if $2290 (weekly close) holds as stop loss,
🎯 Target: $4430 in 12–18 months
Structure looks strong for long-term upside.
#ETH #Ethereum #Crypto #Altcoins #ChartAnalysis

ETHUSD Trade Setup – 15Min Chart UpdateEthereum respected the rising channel structure throughout the session, maintaining higher highs and higher lows. After a brief correction, ETH has once again bounced from the lower trendline support of the ascending channel.
🚀 Entry has been triggered right off the channel support zone, indicating bullish momentum is still intact.
📌 Key Levels:
Entry: Near $2783
Stop Loss: Below $2753
Target: $2809 and beyond
This setup offers a favorable risk-reward ratio, with strong structure-based confidence. As long as the trendline holds, bullish continuation is likely.

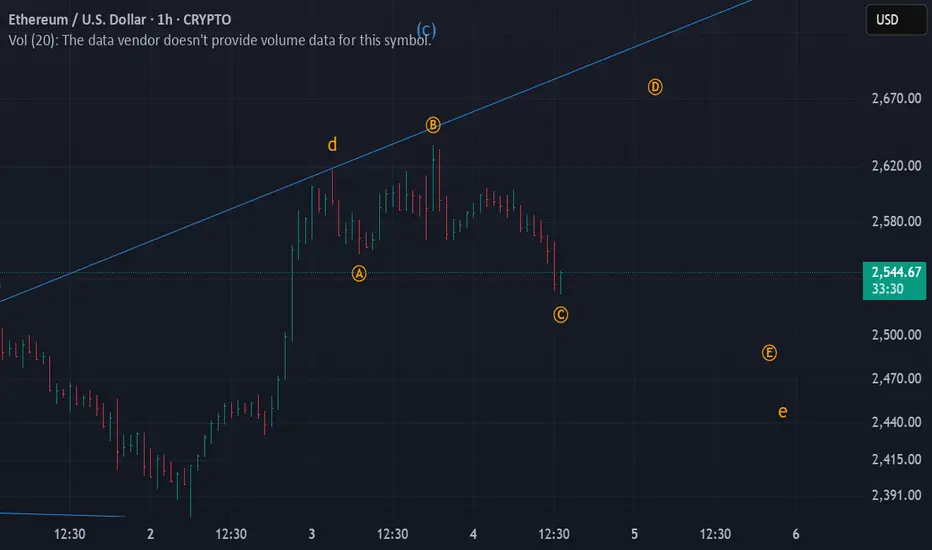
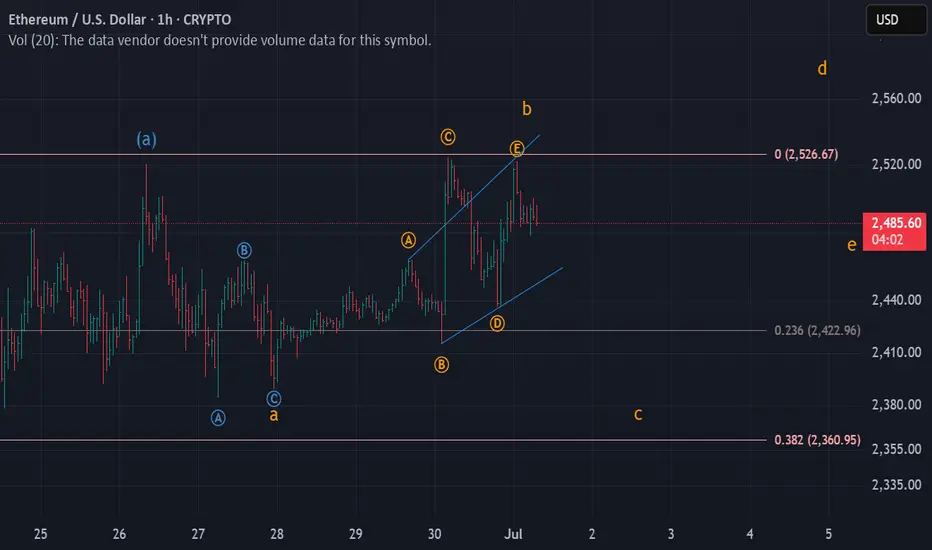
EDUCATIONAL | Uptrend OverEth has hit a major upward target.
Wave C is equal to Wave A
Will be on the lookout for shorting opportunities after getting a confirmation of downtrend, which will most likely be a corrective downtrend

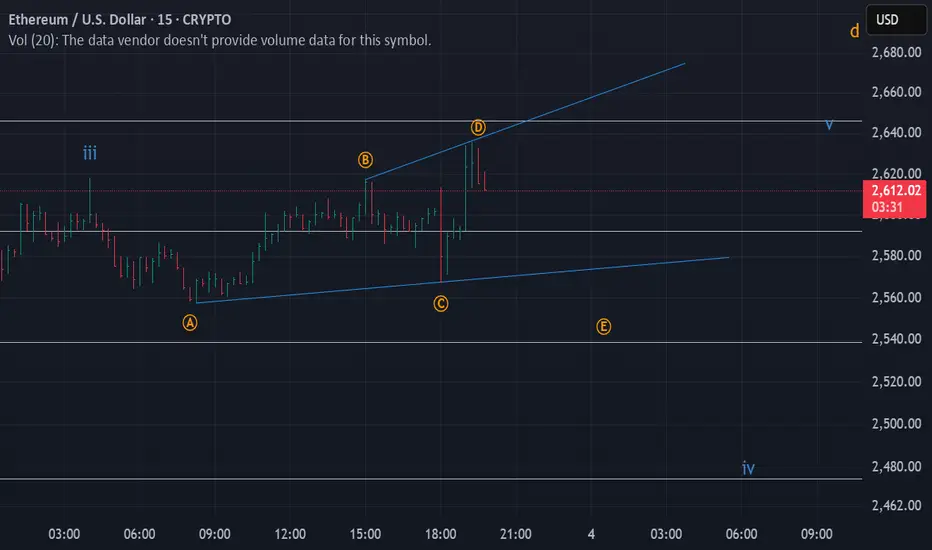
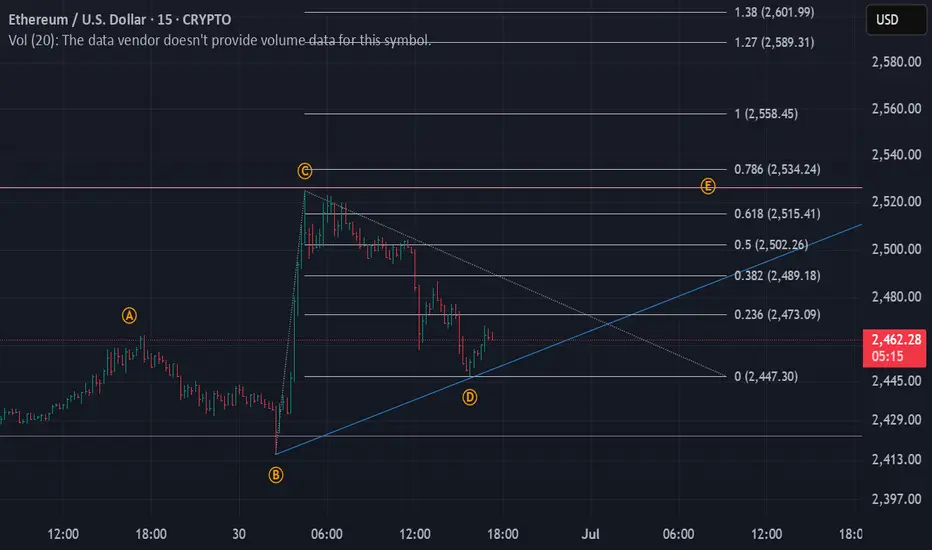
Corrective Rise UpEthereum seems to have completed Wave C of an expanding triangle and now we're headed towards Wave D.
Rise UpEth seems to have completed wave 2 or wave B and now moving upwards.
Tgt 1 -> 2630
Tgt 2 -> 2645

Educational | Completed a complex triple correctionEthereum seems to have completed a triple combination pattern
Wave Z ended with a neutral triangle
Wave Y was a zigzag
Wave W was a flat.
Wave Y took equal time as Wave W to form
Wave Z took twice the time of Wave W/Y.
This triple combination completed Wave E of a larger neutral triangle.
The internal Wave E of a triangle is generally similar to the larger triangle of which it is a part of.
In this case too, the Wave E of the neutral triangle itself concluded with a neutral triangle.
Let me know if you'd more such educational content or larger timeframe analysis of Ethereum or any other asset.
Happy Trading!!

ETHERIUM best tipReal-time Ethereum (ETH/USDT) chart powered by TradingView. Yeh chart aapko live price movements, historical trends, aur technical indicators ke sath full customization deta hai — perfect for traders & investors.

Ethereum levels,try to sell near resistance 2150-220 buying areaHow My Harmonic pattern projection Indicator work is explained below :
Recent High or Low :
D-0% is our recent low or high
Profit booking zone: D13% -D15% is
range if break them profit booking start on uptrend or downtrend but only profit booking, trend not changed
SL reversal zone : SL 23% and SL 25% is reversal zone if break then trend reverse and we can take reverse trade
Target : T1, T2, T3, T4 and .
Are our Target zone
Corrective DowntrendEthereum seems to forming Wave E of an expanding triangle and could lead to below Wave C.
Will update in case we need to book profit
Corrective Rise UpEthereum seems to have completed Wave C
and now we're entering Wave D which will be a corrective rise.
I believe we're in the starting of a diametric formation which will be of 'diamond' category

ETH/USDT strong up trend.Looking at the ETH chart, we can see one thing, the price has accumulated and moved sideways for quite a while after a strong up leg before. With the bullish price structure still maintained, with ETH we look for long positions with futures or SPOT for good positions. The price is expected to surpass $3,000 soon
Corrective Downtrend | Hourly Ethereum seems to have completed Wave B in an hourly timeframe and now moving towards Wave C which could end a little lower than the starting of Wave B.
Will keep updating in case of any changes
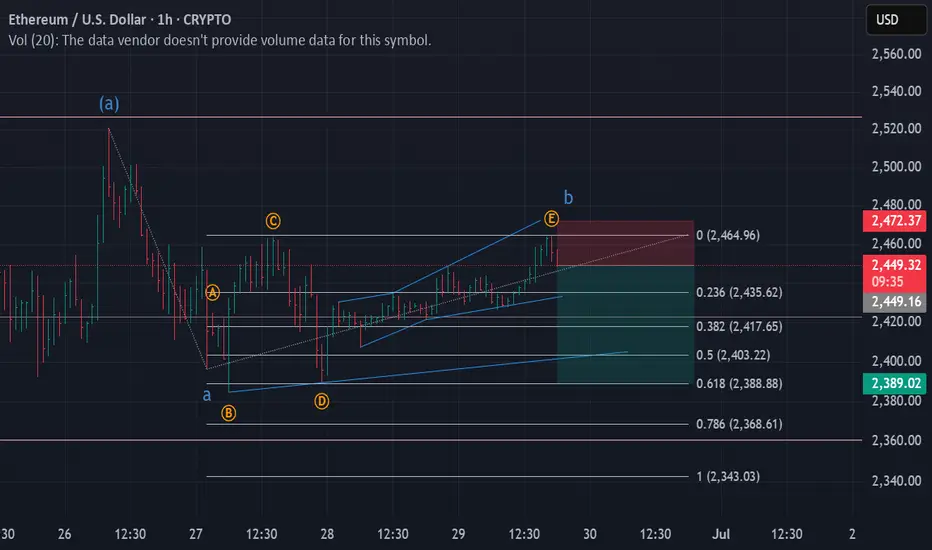
Corrective Rise UpEthereum seems to have or nearly completed Wave D of a neutral triangle and entering Wave E.
The minimum target of Wave E is around 2480
A break below current B-D trendline will be a warning sign that Wave D is still in progress
Ethereum buy near 2440 add more st 2380 sl 2340 target 2660,2730How My Harmonic pattern projection Indicator work is explained below :
Recent High or Low :
D-0% is our recent low or high
Profit booking zone: D13% -D15% is
range if break them profit booking start on uptrend or downtrend but only profit booking, trend not changed
SL reversal zone : SL 23% and SL 25% is reversal zone if break then trend reverse and we can take reverse trade
Target : T1, T2, T3, T4 and .
Are our Target zone

ETHUSD | SHORTEthereum seems to have completed Wave B and currently going to start Wave C of a ZigZag.
Current Price -> 2450
Stop Loss ~> 2475
Target 1 -> 2400
ETHUSD Entry at $2,422 with Target at $2,521and Support at 2,3921. Entry Point: ~2,422.2
This is the suggested buy area based on a recent bounce from the support zone.
2. Support Zone (Purple Box):
Bottom boundary: ~2,392.4
Top boundary: ~2,408.4
Price has bounced multiple times here, showing strong buying interest.
3. Resistance Point: ~2,463.9
A clear horizontal resistance line, previously tested.
4. EA Target Point: ~2,522.1
A bullish target if the price breaks above the resistance level.
---
🔶 Highlighted Patterns / Markers
Orange Circles: Indicate key swing highs and lows — possibly used to identify double tops/bottoms or rejection/wick zones.
Blue Arrows: Illustrate the anticipated move from:
Entry (2,408.1) → Resistance (2,463.9) → Target (2,521.2)
Target gain = +111.7 USD (+4.64%)
---
🔻 Stop Loss Level
Set just below the support box at ~2,392.4
Protects from false breakouts or deeper pullbacks.
---
📈 Strategy Outlook
Bullish Bias: The setup expects a breakout from the current price range.
Risk-Reward Ratio: Appears favorable — tight stop and wide target.
Confirmation Needed: A solid breakout and hold above 2,423–2,425 may be the early confirmation signal.
---
📌 Summary
Element Value
Entry Point ~2,422.2
Stop Loss ~2,392.4
Resistance ~2,463.9
Target (TP) ~2,521.2
R:R Ratio Approx. 3:1
Bias Bullish

Ethereum chart showing weakness avoid fresh buy until 2580 breakHow My Harmonic pattern projection Indicator work is explained below :
Recent High or Low :
D-0% is our recent low or high
Profit booking zone: D13% -D15% is
range if break them profit booking start on uptrend or downtrend but only profit booking, trend not changed
SL reversal zone : SL 23% and SL 25% is reversal zone if break then trend reverse and we can take reverse trade
Target : T1, T2, T3, T4 and .
Are our Target zone
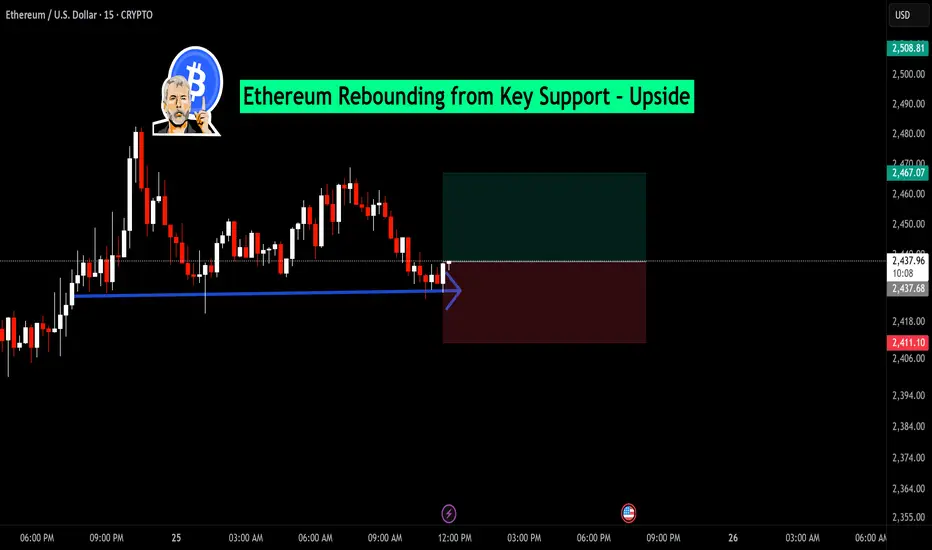
Ethereum Rebounding from Key Support – Upside TargetSupport Zone: Price has tested and respected a horizontal support level around $2,436, highlighted by the blue line and arrow. Multiple rejections here suggest buying interest.
Candlestick Reaction: A small bullish candle is forming right at support, hinting at a possible bounce.
Risk-Reward Setup: The green and red box indicates a favorable long trade setup:
✅ Entry: Near the support zone at $2,436
🎯 Target: Around $2,481 — a prior resistance level
🛑 Stop-Loss: Just below support, around $2,394 — protecting against breakdown
Ethereum (ETHUSD) Update – 15 Min ChartEthereum has respected the key support zone near $2,382, forming a potential bullish reversal candle after testing the level multiple times.
🔹 Support Held: $2,382
🔹 Current Price: $2,401
🔹 Resistance Zone: $2,435 – $2,440
🔹 Bias: Short-term bullish as long as price holds above $2,382
📌 A clean bounce from the demand zone indicates buyer interest. If ETH sustains above $2,400, we may see a move toward the $2,435 target.
🧠 Structure remains positive above support — risk-managed long opportunity.

Ethereum 2150-2130 positional Target hit now buy on dip How My Harmonic pattern projection Indicator work is explained below :
Recent High or Low :
D-0% is our recent low or high
Profit booking zone: D13% -D15% is
range if break them profit booking start on uptrend or downtrend but only profit booking, trend not changed
SL reversal zone : SL 23% and SL 25% is reversal zone if break then trend reverse and we can take reverse trade
Target : T1, T2, T3, T4 and .
Are our Target zone

Ethereum still looking negative if ceasefire news come then up How to take trades using Harmonic pattern projection Trade setup is explained below :-
Entry : 1st SL point : 0% is recent top or bottom.
Trailing D: 15.1% is work as trailing SL of buy or sell trade if hit then we have to book profit
.If price goes below 2nd D 22.5% to 24.5% range then early traders can make fresh reversals trade after breaking 1st D 15.1% safe traders can reversal trade after breaking Point D 22.5.4% to 24.5% range
Targets :
Target T1 : 36.1% to 38.3%
Target T3 : 49.1% to 52.5%
T3: 60.9% to 64.8% is our 3rd Target since this is reversal zone so must book profit if break then take fresh trade again
Target T4 : 76.4% to 79.7%
Next Targets are 100% , 127.2% ,141.4% and final Target 161.8%.
How to take reversal trade :
If price going upside/ downside then then buy or sell levels appear on Chart ( Automatically show when price reach any reversal zone of harmonic projection ).
Trailing SL:
After reach 1st Target trail SL to just above or below cost ( for example we are holding sell trade from 100 1st Target 110 hit then move trailing sl to 104-105 and move SL as price move upside or Downside)
Re- Entry :
For Re-entry in any pull back Point D ( 15.1% ) is used for re-entry then SL recent high or low Point SL ( 0% ) .
Blue Line is 1st support/ Resistance
Green line is 2nd support/ resistance
Red line is 3rd Support/ resistance
