Ethereum bought at 2150 Booked at 2520 again holding buy 2280How to take trades using Harmonic pattern projection Trade setup is explained below :-
Entry : 1st SL point : 0% is recent top or bottom.
Trailing D: 11.4% is work as trailing SL of buy or sell trade if hit then we have to book profit
.If price goes below 2nd D 21.4% to 23.6% range then early traders can make fresh reversals trade after breaking 1st D 11.4% safe traders can reversal trade after breaking Point D 21.4% to 23.6% range
Targets :
Target T1 : 35.1% to 38.3%
Target T3 : 49.1% to 53.2%
T3: 60.9% to 64.8% is our 3rd Target since this is reversal zone so must book profit if break then take fresh trade again
Target T4 : 76.4% to 79.7%
Next Targets are 100% , 127.2% ,141.4% and final Target 161.8%.
How to take reversal trade :
If price going upside/ downside then then buy or sell levels appear on Chart ( Automatically show when price reach any reversal zone of harmonic projection pattern based .
After showing reversal levels wait for confirmation until 21.4% or 28.3 % level not break if break then exit from current buy / sell trade and take fresh reverse trade buy/ sell .
Trailing SL:
After reach 1st Target trail SL to just above or below cost ( for example we are holding sell trade from 100 1st Target 110 hit then move trailing sl to 104-105 and move SL as price move upside or Downside)
Re- Entry :
For Re-entry in any pull back Point D ( 11.4% ) is used for re-entry then SL recent high or low Point SL ( 0% ) .
Blue Line is 1st support/ Resistance
Green line is 2nd support/ resistance
Red line is 3rd Support/ resistance
ETHUSD.P trade ideas

ETH with M2 Money Supply Adjusted 76 DaysETH with M2 Money Supply Adjusted 76 Days. Looks like a possible breakout April 7th in this example. Let's see if this help predict ETH future price moves.

Ethereum buy given at 2150 enjoy huge profit hold buy trade How to take trades using Harmonic pattern projection Trade setup is explained below :-
Entry : 1st SL point : 0% is recent top or bottom.
Trailing D: 11.4% is work as trailing SL of buy or sell trade if hit then we have to book profit
.If price goes below 2nd D 21.4% then early traders can make fresh reversals trade after breaking 1st D 11.4% safe traders can reversal trade after breaking 2nd D 21.4%
Targets :
Target T1 : 28.3% ( early trade if entry at 11.4% )
Target T1 : 35.1% to 38.2%
Target T3 : 49.1% to 53.2%
T3: 61.8% to 65.1% is our 3rd Target since this is reversal zone so must book profit if break then take fresh trade again
Target T4 : 76.4% to 79.7%
Next Targets are 100% , 127.2% ,141.4% and final Target 161.8%.
How to take reversal trade :
If price going upside/ downside then then buy or sell levels appear on Chart ( Automatically show when price reach any reversal zone of harmonic projection pattern based .
After showing reversal levels wait for confirmation until 21.4% or 28.3 % level not break if break then exit from current buy / sell trade and take fresh reverse trade buy/ sell .
Trailing SL:
After reach 1st Target trail SL to just above or below cost ( for example we are holding sell trade from 100 1st Target 110 hit then move trailing sl to 104-105 and move SL as price move upside or Downside)
Re- Entry :
For Re-entry in any pull back Point D ( 11.4% ) is used for re-entry then SL recent high or low Point D ( 0% ) .
Target is same as early 21.4% , 28.3 , 35.1 and so on
Blue Line is 1st support/ Resistance
Green line is 2nd support/ resistance
Red line is 3rd Support/ resistance

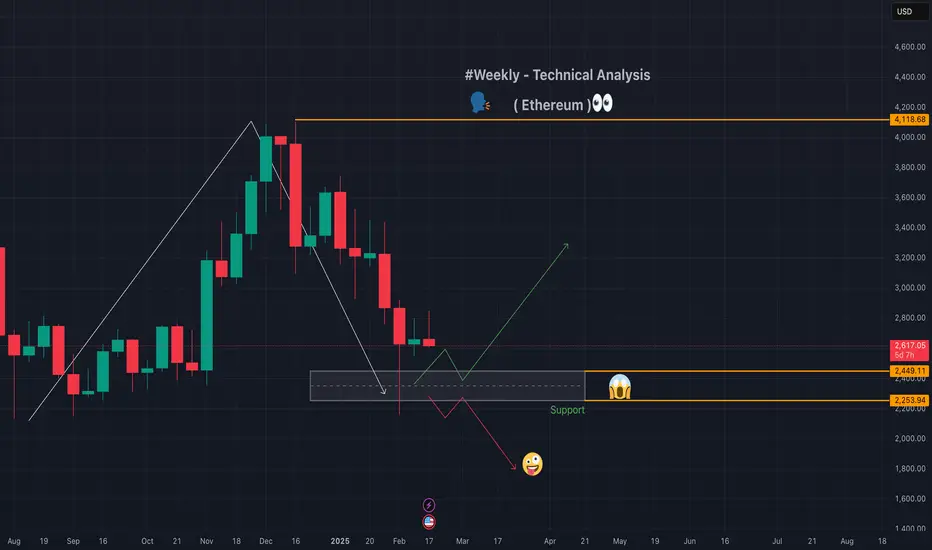
Ethereum Technical Analysis - Weakly 🇺🇸 CRYPTOCAP:ETH Weekly Technical Analysis: #Ethereum broke previous support at $2250 on the 4-hour timeframe. We are in a bearish trend, 💔raising concerns. As the weekly closing is pending, I will update if there are changes after the weekly and monthly closings.
📈📉Chart for reference. posted on trading view as well link below

ETH USD 24-02 BUY DIRECTIONDear traders, Here are the important pivot support zones of ETH USD (15m): Candle taking support at the S3 pivot level, it represents short-term intraday buy direction based on previous day movement and market trend.
Risk Reward Ratio 1:1

Ethereum Technical - Daily❣️Time has come for reversal if we hold the support between 2250$ to 2400$ ❣️
after a long time👊🦾💪
📉📈 chart for your reference

ETHUSD Buy directionDear traders, Here are the important pivot support zones of ETHUSD (15m): Candle taking support at the S2 pivot level, it represents short-term intraday buy direction based on previous day movement and market trend.

ETHUSD Long side Dear traders, follow the upward direction. The reason is that the candle tries to break pivot R1 level continuously so we can expect ETH-USD moving buy side direction upto R2 level.
Risk Reward Ratio 1:1

ETH Long Position for 4H CurvePotantial position for up trend in ETH in 4H curve.
Reason: we have made a strong up move in Daily timeframe. The next Fresh supply is our target.
If it comes for deep retracement. We add to our position at key levels in intraday timeframe.

ETHUSD Short Strategy:
ETHUSD Short Strategy:
Entry: 2,679 - 2,692
Stop Loss: 2,760
Target 1: 2,600
Target 2: 2,463 - 2,460
Expected timeframe: Target before early next week
Additional strategy: If the price retraces to 2,720 - 2,740, consider adding to the short position.
📌 Follow me for more market insights and real-time trade updates! 🚀

ETHEREUM - $5000 loading! - Super Bullish? Price Overview:
ETH showing signs of a major bull rally! Here’s what’s happening:
1️⃣ Trendline Breakout: ETH has successfully broken out of a major trendline, signaling bullish momentum.
2️⃣ Next Stop: ATH! The next resistance level aligns with its all-time high, making this a crucial milestone.
3️⃣ Altcoin Rally Dependency: For the broader altcoin market to rally, Ethereum must break its ATH first.
✨ The Bitcoin Connection:
Bitcoin dominance plays a pivotal role in the altcoin market? When Bitcoin dominance weakens, it creates room for altcoins—to shine. If ETH breaks its ATH, it could kickstart an exciting altcoin season.
💡My Expectations:
ETH looks poised to reclaim its ATH soon. A breakout here could be the trigger for the next big rally.🚀
Stay tuned for further insights, updates, and trade safely!
If you enjoyed this analysis, leave a comment and help boost the post. Let’s grow together!
⚠️ Disclaimer: This is NOT a buy/sell recommendation. All views are personal and shared for educational purposes only. Do your research before investing.
Thanks & Regards,
Anubrata Ray ⚡

Ethereum - Technical - Weekly❣️#Ethereum has been experiencing a downward trend with lower highs and lower lows, suggesting a bearish outlook in the short term. However, there are signs of a potential sideways movement in the very short term.
sharing a 📉chart for your reference so any body can learn and make decision.💟
Ethereum at a Critical Turning Point: Head & Shoulder PatternEthereum Technical Chart Study
Ethereum is showing some interesting price action. It recently took resistance from its resistance zone and is now forming a classic Head & Shoulder pattern—a structure often signaling potential reversals.
Currently, the price is sitting right at the neckline of the Head & Shoulder pattern. If this neckline breaks, it could lead to further downside movement.
Looking below, there’s some key support to watch:
1. The 2800 resistance zone, which Ethereum broke out of earlier, hasn’t been tested yet. This zone might now act as a strong support if the price moves downward.
2. There’s also a trendline support in play, adding another layer of potential price stability.
So, what’s next?
If Ethereum breaks the neckline, we could see the price fall towards the 2800 zone or possibly to the trendline support. These are the levels to keep an eye on for the next big move.

Ethereum TechnicalEthereum has been pivotal in the blockchain space, not just for its cryptocurrency but for its platform capabilities. Its evolution continues to be watched closely by both enthusiasts and skeptics, given its impact on blockchain technology and decentralized systems. I
chart for your reference

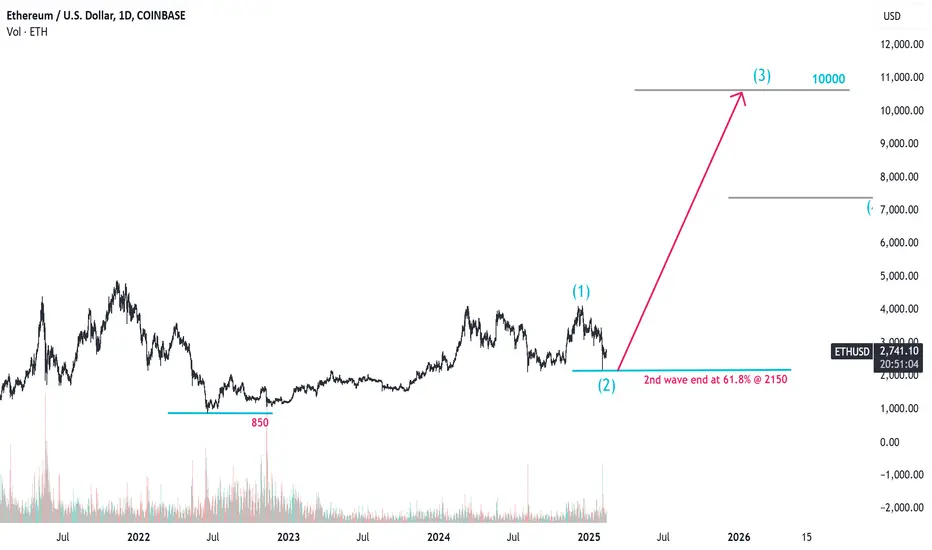
ETH 3rd wave towards 10K We have seen 800 to 4000 Rally as wave 1
61.8% retracement of wave 1 end @ 2150
What is Next for 3rd wave ???
My Target is $10,000
ETH - Potential Bullish Signs (Weekly) ETH forming some potential bullish signs on the weekly chart. These can take a few months to play out. We would like to see a bullish cross on the 21SMA and 50SMA. We would like to see the continuation on the stochastic RSI cross. We would like to see a break over the white trendline in the 3100 range. Lets see if the bullish hammer candle is in play with that long wick that was bought up in this past weekends sell off, closing Sunday. I would keep a tight stop loss around the 200SMA (Yellow).

Ethereum Resistance ZoneEthereum has been experiencing volatility, with significant price drops and recoveries. It was reported that ETH had plunged 10% weekly, hinting at more potential downside. However, there have been moments of recovery, with ETH briefly touching above $3,000 but facing rejections at key technical levels given in the chart

Breakout soon in ETH?Descending Triangle Breakout Setup
Bounce from strong support
RSI reversal in daily chart
Enter after confirmation
Disc: for study only, not a recommendation


Technical Analysis of Ethereum - Weekly Time Frame
👉🚀Here is a #technical analysis of #Ethereum #ETH based on the most recent data and insights from the
📉📈Chart

education purpose only - ETHon a short term chart Cup and Handle pattern is in preparation.. if it is formed and BO has come than a large move can be expected...
Lets see how it future will unfold..

Ethereum 4 Hour Technical AnalysisAnalysing Ethereum on a 4-hour chart involves looking at various technical indicators and chart patterns to assess potential price movements. Here's a chart based on current data and insights from various sources

ETH - To go above 41K !!!we can see ETH taking support near the green path area shown in chart. But Red line is current resistance line. Breakout of Red line could take price above 41K !!! Till then price could dance between red and green lines shown in chart, one may buy and go long now for quick returns since all crypto could spike or already moving up due to new crypto US President. And ETH is also expected to move up after the bull run ends in Bitcoin. so its good buy right now in ETH
