Key Insights on Ethereum's 4-Hour ChartAs of October 19, 2025, Ethereum (ETH) is trading around $3,900, reflecting a period of consolidation after recent volatility, with analysis suggesting a balanced but potentially bullish setup if key resistances are broken.
The 4-hour chart shows a descending wedge pattern, which often signals a reversal; research indicates this could lead to upward momentum toward $4,400–$4,600 if ETH closes above $4,000–$4,100, though downside risks remain if support fails.
Indicators like RSI and MACD are neutral, leaning toward caution, while on-chain metrics such as declining exchange reserves and whale accumulation point to underlying strength, making a rally to $4,500 plausible by month's end amid broader market recovery.
Evidence leans toward a range-bound scenario in the short term, with potential for volatility expansion; traders should monitor for confirmed breakouts to avoid false moves.
Current Price and Recent Action
Ethereum's price stands at approximately $3,892 USD, with a slight 24-hour increase of about 0.6% from recent lows. Over the last few 4-hour candles, ETH has shown mild oscillation, rebounding from supports near $3,860 but facing rejection at higher levels, indicating indecision among buyers and sellers.
Key Patterns and Trends
On the 4-hour timeframe, ETH is forming a descending wedge, characterized by lower highs and lows converging toward a point near the $3,400–$3,500 demand zone. This pattern follows a sharp pullback from $4,200, suggesting compression that could resolve bullishly. Broader trends show ETH stabilizing after a 15% rebound from $3,435, aligning with daily bull flag formations that support upward bias if momentum builds.
Risks and Outlook
While the setup appears constructive, it remains at risk below critical resistances; a failure to hold $3,700 could expose lower supports. On-chain data offers optimism, with MVRV ratios at historical support levels hinting at rallies, but external factors like market sentiment could influence outcomes.
Price Action and Historical Context
Recent price action on the 4H chart reveals a series of lower highs and lows following a rejection from the $4,200 breakdown zone earlier in October. Over the last 10-20 candles, ETH has oscillated within a tight range, with bullish candles attempting rebounds from supports around $3,860 but facing consistent selling pressure near $3,930–$3,950. This follows a sharper decline from mid-October peaks near $4,500, where volume spiked during pullbacks, indicating profit-taking or liquidation events. Volume trends show a 24-hour trading volume of approximately $23.36 billion, with a volume-to-market-cap ratio of 0.1019, suggesting moderate liquidity but no explosive buying yet.
Historically, ETH has shown resilience at these levels; for instance, the all-time high reached $4,955 on August 23, 2025, before correcting. Year-to-date, ETH is up 46.95%, but the recent 15% rebound from a two-month low of $3,435 highlights a V-shaped recovery pattern, supported by institutional demand zones. Contrasting views from analysts note that while short-term weakness persists (e.g., from $4,450–$4,500 resistance), the structure remains intact for potential upside if global sentiment
Chart Patterns and Structures
The dominant pattern on the 4H timeframe is a descending wedge, formed after the rejection from $4,200, with converging trendlines indicating compression between buyers and sellers. The lower boundary aligns with the $3,400–$3,500 institutional demand zone, while the upper trendline coincides with resistance at $4,000–$4,100. This setup is often bullish, as wedges typically resolve upward, but confirmation requires a close above the descending trendline.
Trade ideas
Part 6 Learn Institutional Trading Leverage and Speculation in Option Trading
Options provide leverage, allowing traders to control large positions with small investments. For instance, buying a single call option can represent ownership of 100 shares, magnifying both profits and losses. Speculators use this leverage to capitalize on short-term market moves. However, leverage also increases risk—if the market moves against the position, the entire premium can be lost. Successful speculators use strict risk management, combining analysis of volatility, momentum, and time decay to optimize entries and exits. While leverage makes options attractive, disciplined control is vital to avoid quick capital depletion.

High-Frequency Trading in the Indian MarketIntroduction
High-Frequency Trading (HFT) has emerged as one of the most sophisticated trading strategies in modern financial markets. It leverages advanced technology, high-speed networks, and complex algorithms to execute large volumes of trades in fractions of a second. Globally, markets such as the U.S., Europe, and Japan have witnessed a significant presence of HFT, impacting market liquidity, volatility, and trading costs. India, with its growing stock markets and increasing adoption of technology-driven trading, has also seen the rise of high-frequency trading. However, the Indian context presents unique regulatory, technological, and market-structure characteristics that distinguish it from developed markets.
What is High-Frequency Trading?
High-Frequency Trading is a type of algorithmic trading that focuses on executing trades at extremely high speeds, often measured in microseconds or milliseconds. The main characteristics of HFT include:
Speed: HFT relies on ultra-low-latency systems to execute trades faster than human traders or standard algorithmic strategies.
Algorithmic Decision-Making: Proprietary algorithms analyze market data, detect patterns, and automatically make trading decisions.
High Volume: HFT firms typically place a large number of trades with small profit margins per trade, relying on volume to generate significant returns.
Short Holding Periods: Positions are held for very brief periods, sometimes milliseconds, minimizing exposure to market risk.
Market Microstructure Exploitation: HFT strategies often exploit inefficiencies in market pricing, liquidity, and order execution.
HFT strategies can be broadly classified into the following types:
Market Making: Providing liquidity by continuously quoting buy and sell prices and profiting from the bid-ask spread.
Statistical Arbitrage: Exploiting statistical discrepancies between correlated instruments.
Event-Driven Trading: Reacting to news, earnings announcements, or macroeconomic events faster than competitors.
Latency Arbitrage: Exploiting differences in the speed of market information between exchanges.
Evolution of HFT in India
High-frequency trading in India is a relatively recent phenomenon compared to Western markets. The introduction of electronic trading in Indian stock exchanges in the late 1990s, followed by rapid adoption of technology and algorithmic trading in the 2000s, set the stage for HFT. Key milestones include:
Electronic Trading and NSE Launch (1994): The National Stock Exchange (NSE) introduced fully electronic trading, replacing open outcry systems, which facilitated faster trade execution.
Introduction of Algorithmic Trading (2008): SEBI allowed algorithmic trading with strict guidelines, enabling institutional investors and proprietary traders to implement HFT strategies.
Co-Location Services (2012): Exchanges such as NSE and BSE introduced co-location facilities, allowing HFT firms to place their servers physically close to exchange servers, reducing latency and execution time.
Growth in Market Participation: Over the last decade, HFT participation in India has grown steadily, accounting for a significant share of overall trading volumes in equities, derivatives, and currency markets.
Regulatory Framework Governing HFT in India
The Securities and Exchange Board of India (SEBI) regulates high-frequency trading to maintain market integrity, protect investors, and prevent market abuse. Key regulatory provisions include:
Algorithmic Trading Guidelines:
Traders must obtain prior approval from stock exchanges before using algorithms.
Exchanges monitor algorithms for market abuse, including manipulative strategies.
Co-Location Regulations:
Traders are allowed to place servers in proximity to exchange servers.
SEBI has mandated fair access policies, ensuring equal opportunity for all market participants.
Transparency requirements include real-time order monitoring and periodic audits.
Risk Management and Order Controls:
Exchanges require pre-trade risk checks to prevent erroneous orders.
Limits on order-to-trade ratios help control excessive messaging that can strain the market.
Market Surveillance:
SEBI employs sophisticated monitoring tools to detect potential manipulative practices like quote stuffing, layering, and spoofing.
While SEBI has created a framework for safe HFT, it remains cautious, emphasizing investor protection and market stability over unrestricted technological advancement.
Technological Infrastructure for HFT in India
High-frequency trading relies heavily on technological infrastructure, and India’s growing IT ecosystem has played a vital role. Critical components include:
Low-Latency Networks: HFT requires ultra-fast communication between trading firms and exchanges. Co-location, fiber-optic connectivity, and microwave links are used to minimize delays.
High-Performance Servers: Trading firms deploy powerful servers with advanced processors to handle massive data streams and execute algorithms rapidly.
Data Feeds: Real-time market data, order books, and news feeds are essential. Indian exchanges provide proprietary data feeds like NSE’s “NEAT” and BSE’s “BOLT” for HFT purposes.
Algorithm Development: Machine learning, statistical modeling, and predictive analytics are increasingly used to develop smarter algorithms capable of adapting to changing market conditions.
Impact of HFT on the Indian Market
The presence of high-frequency trading in India has both positive and negative implications:
Positive Impacts:
Enhanced Liquidity: HFT firms act as market makers, reducing bid-ask spreads and facilitating smoother trading for all participants.
Price Discovery: Rapid trading ensures that prices reflect new information almost instantly, improving market efficiency.
Reduced Transaction Costs: Tight bid-ask spreads and high competition among HFTs lead to lower trading costs for regular investors.
Negative Impacts:
Market Volatility: Ultra-fast trading can exacerbate price swings during periods of stress, as seen in flash crashes.
Unfair Advantage: Traders with superior technology and co-location access may dominate, creating a perception of inequality.
Potential Manipulation: Strategies like layering, spoofing, and quote stuffing can distort prices and harm genuine investors.
Despite these concerns, SEBI’s vigilant monitoring and risk management frameworks have minimized systemic risks, making India’s HFT ecosystem more controlled compared to less-regulated markets.
HFT Strategies Used in India
Some commonly observed HFT strategies in India include:
Market Making: Many HFT firms act as liquidity providers in NSE and BSE equities and derivatives markets, continuously posting bid and ask prices to profit from spreads.
Statistical Arbitrage: Arbitrage opportunities exist between futures and underlying stocks or between correlated securities. HFT algorithms detect these discrepancies and execute trades at lightning speed.
Index Arbitrage: Futures and index components sometimes have misaligned prices, which HFTs exploit for instant profits.
Latency Arbitrage: Traders exploit slight delays in price updates between exchanges or data feeds, gaining microsecond-level advantages.
Event-Based Strategies: Reactions to corporate announcements, macroeconomic data releases, or global market movements allow HFTs to anticipate price changes faster than traditional traders.
Challenges for HFT in India
Despite technological and regulatory progress, HFT faces unique challenges in India:
Infrastructure Constraints: Although exchanges offer co-location, latency can still be higher than global standards, limiting the competitiveness of Indian HFT firms internationally.
Regulatory Restrictions: Strict SEBI regulations on order-to-trade ratios, pre-trade risk checks, and algorithm approvals require continuous compliance efforts.
Market Depth: While liquidity has improved, some Indian stocks still have shallow markets, making HFT strategies less effective.
Competition from Global Players: International HFT firms entering India can outcompete domestic players due to superior technology and experience.
Ethical Concerns: HFT is often criticized for favoring speed over fundamentals, raising questions about market fairness.
Future of High-Frequency Trading in India
The future of HFT in India looks promising, driven by technological advances, increasing digital adoption, and regulatory evolution. Key trends include:
Artificial Intelligence and Machine Learning: Next-generation algorithms will leverage AI to detect patterns and adapt dynamically to market conditions.
Expansion into Derivatives and Currency Markets: As Indian derivatives and currency markets mature, HFT participation is expected to increase, offering better liquidity and efficiency.
Global Integration: Indian HFT firms may collaborate with global players, adopting international best practices while contributing to domestic market sophistication.
Regulatory Evolution: SEBI may further refine co-location and algorithmic trading norms to balance innovation with investor protection.
Technological Innovation: Investments in ultra-low-latency infrastructure, quantum computing, and advanced analytics will redefine competitiveness in HFT.
Conclusion
High-frequency trading has become an integral part of the Indian financial markets, enhancing liquidity, improving price discovery, and reducing transaction costs. At the same time, it presents challenges such as increased volatility, regulatory oversight, and ethical concerns. The Indian market, with its robust regulatory framework and growing technological infrastructure, is uniquely positioned to adopt HFT responsibly.
With continuous innovation, effective regulation, and market evolution, HFT in India is likely to grow further, playing a critical role in shaping the future of electronic trading. For investors, policymakers, and trading firms, understanding HFT is crucial, as it represents both an opportunity and a challenge in India’s rapidly modernizing capital markets.

Private vs Public Banks: Role in the Indian Trading Market1. Overview of Public and Private Banks in India
1.1 Public Sector Banks (PSBs)
Public sector banks are those where the majority ownership (more than 50%) lies with the Government of India. Examples include the State Bank of India (SBI), Punjab National Bank (PNB), Bank of Baroda, and Canara Bank. PSBs dominate the Indian banking sector in terms of branch network, assets under management (AUM), and reach, particularly in rural and semi-urban regions.
Key Characteristics of PSBs:
Government-owned with social and development mandates.
Conservative in risk-taking.
Large customer base across rural and urban India.
Often involved in policy-driven lending and financial inclusion schemes.
1.2 Private Sector Banks (PVBs)
Private banks, such as HDFC Bank, ICICI Bank, Axis Bank, and Kotak Mahindra Bank, are owned predominantly by private shareholders. These banks are known for customer-centric approaches, high efficiency, and greater use of technology. They have grown rapidly in the last two decades and now have significant influence in retail, corporate, and investment banking.
Key Characteristics of PVBs:
Privately owned with profit-driven motives.
Higher risk appetite and innovative products.
Focused on urban and semi-urban populations.
Advanced technological adoption and superior customer service.
2. Role in the Indian Trading Market
The Indian trading market comprises equities, commodities, derivatives, forex, and bond markets. Both private and public banks play distinct roles in facilitating trading activities, investment, and capital flow.
2.1 Providing Capital and Liquidity
PSBs: They are crucial in funding large-scale corporate and government projects, which indirectly impacts trading markets by providing liquidity and supporting corporate growth. PSBs often lend to companies whose stocks or bonds are actively traded in the market.
PVBs: These banks are more active in retail lending, margin finance, and funding startups or small-cap companies. By offering working capital, they help increase market participation and trading volumes.
2.2 Investment Banking and Market Operations
PSBs: Traditionally, PSBs have a limited role in high-risk investment banking activities. However, banks like SBI Capital Markets actively participate in primary market issuances (IPOs) and underwriting services, supporting capital formation.
PVBs: Private banks are more aggressive in equity and bond issuance, IPO management, advisory services, and mergers & acquisitions (M&A). They provide liquidity to the trading market and cater to institutional investors, contributing to market depth.
2.3 Facilitating Retail and Institutional Trading
Retail Market: Private banks lead in offering demat accounts, online trading platforms, and wealth management services, making trading accessible to individual investors. PSBs have been slower in digital adoption but still serve a large customer base with affordable services.
Institutional Market: PSBs dominate government securities (G-Secs) trading, large-scale corporate bonds, and interbank transactions, whereas PVBs are more flexible in providing structured products and derivatives to hedge risks in trading portfolios.
3. Technological Innovation and Trading Efficiency
3.1 Digital Platforms
PVBs: Banks like HDFC, ICICI, and Kotak Mahindra have pioneered digital banking solutions, including online trading, mobile apps, algorithmic trading support, and seamless payment gateways. These platforms enhance efficiency in stock, forex, and commodity markets.
PSBs: Although improving, public banks have traditionally lagged in adopting high-speed trading platforms. Their digital offerings are often centralized but less user-friendly for advanced traders.
3.2 Data Analytics and Market Insights
Private banks leverage big data analytics and AI-driven trading advisory, providing traders and investors with market insights, technical analysis, and risk management tools.
Public banks, while increasingly offering research services, focus mainly on policy-driven investment guidance and macroeconomic reports.
4. Risk Management and Market Stability
4.1 Risk Appetite
PSBs: Conservative lending and trading practices help maintain market stability, preventing excessive speculation. However, this may limit high-growth opportunities in trading markets.
PVBs: Their higher risk appetite fosters innovation and liquidity but may also contribute to volatility, especially in derivatives and structured products.
4.2 Crisis Management
PSBs: During market downturns, public banks play a stabilizing role by maintaining credit flow to companies and acting as government channels for economic stimulus.
PVBs: While they provide risk-mitigating tools like hedging products, their reliance on market-driven profits makes them vulnerable during severe market corrections.
5. Role in Government and Policy Initiatives
PSBs are instrumental in implementing government-backed schemes like MUDRA loans, priority sector lending (PSL), and disbursal of subsidies. These measures impact trading indirectly by enhancing disposable income and liquidity in the economy.
PVBs participate in policy initiatives selectively, often aligning with profit motives, such as facilitating corporate bond markets, IPO underwriting, and private wealth management.
6. Impact on Stock, Commodity, and Forex Markets
6.1 Equity Market
PSBs: Major institutional investors; provide long-term funding and participate in strategic equity investments. Their trading volume may be lower but stable.
PVBs: Retail-oriented and innovative products enhance equity market participation. They facilitate derivatives trading, margin financing, and high-frequency trading for active investors.
6.2 Commodity Market
PSBs: Serve as financing partners for commodity producers and importers, ensuring supply chain liquidity.
PVBs: Offer customized hedging solutions and online platforms for commodity trading, attracting active market participants.
6.3 Forex Market
PSBs: Dominant in external commercial borrowing (ECB), trade finance, and remittance services, crucial for forex stability.
PVBs: Provide competitive forex services, real-time trading, and risk management tools for businesses and individual traders.
7. Comparative Analysis: Public vs Private Banks
Aspect Public Sector Banks Private Sector Banks
Ownership Government Private
Risk Appetite Conservative Higher
Market Reach Nationwide, including rural Urban & semi-urban focused
Technology Adoption Moderate High
Retail Trading Support Limited digital services Advanced platforms & apps
Institutional Role Government & corporate Corporate & investment banking
Market Stability Stabilizing Liquidity enhancer, can be volatile
Financial Inclusion High Moderate
Trading Products Traditional bonds, G-Secs Derivatives, structured products, margin trading
8. Challenges and Opportunities
8.1 Challenges
PSBs: Legacy systems, NPA (Non-Performing Asset) issues, slower technological adoption, and bureaucratic decision-making hinder active participation in fast-paced trading markets.
PVBs: Exposure to market volatility, regulatory pressures, and high competition requires constant innovation to remain relevant in trading markets.
8.2 Opportunities
PSBs: Digital transformation, strategic partnerships with fintechs, and expanding advisory services can boost their trading market role.
PVBs: Expanding into rural markets, leveraging AI-driven trading analytics, and tapping government-backed schemes offer growth potential.
9. Conclusion
The roles of public and private banks in the Indian trading market are complementary rather than competitive. Public banks provide stability, government-backed funding, and long-term institutional support, making them pillars of the financial ecosystem. Private banks, in contrast, drive innovation, liquidity, and retail participation through advanced technology, flexible financial products, and customer-centric services.
Together, both sectors enhance market efficiency, capital formation, risk management, and investor confidence, ensuring the Indian trading market remains vibrant and robust. The future of India’s trading ecosystem will increasingly depend on how both public and private banks leverage technology, collaborate with fintechs, and balance risk with sustainable growth.

Part 1 Master Class of Intraday Trading Understanding the Concept of Options
Option trading involves financial contracts that give buyers the right, but not the obligation, to buy or sell an underlying asset—like a stock, index, or commodity—at a predetermined price within a specific period. The two main types are Call Options (buy rights) and Put Options (sell rights). Unlike owning shares directly, options let traders speculate on price movements with limited capital. The right to buy or sell comes at a cost known as the premium. Options are widely used for hedging, speculation, and income generation. Their value is influenced by factors such as volatility, time decay, and market sentiment. Understanding these dynamics helps traders manage risk and seize market opportunities efficiently.

Part 3 Institutional Trading Put Options Explained
A put option gives the holder the right to sell an asset at a fixed strike price within a certain timeframe. Traders buy put options when they anticipate a price decline. For instance, if a stock is trading at ₹100 and you buy a put at ₹95, you profit when the price falls below ₹95 minus the premium. Puts are useful for hedging—protecting against potential losses in long positions—or for speculation during bearish trends. They are crucial tools for risk management and profit in declining markets.

Position Sizing for Different Trading Strategies1. Why Position Sizing Matters
Position sizing directly affects risk management. Even a profitable strategy can lead to account depletion if positions are too large relative to your capital. Conversely, if positions are too small, your returns will be suboptimal. Proper position sizing ensures that no single trade can jeopardize your entire trading account.
Key reasons position sizing matters:
Risk Control: Limits losses on any single trade.
Consistency: Ensures uniform risk exposure across trades.
Psychological Comfort: Helps traders manage emotions and stick to their strategy.
Maximizing Returns: Optimizes capital usage without taking excessive risk.
2. Core Concepts in Position Sizing
Before diving into strategy-specific sizing, understanding core concepts is essential:
2.1 Risk per Trade
This is the percentage of your total capital you are willing to risk on a single trade. Commonly, traders risk 1–3% per trade, depending on their risk tolerance.
2.2 Stop Loss
Stop loss defines the price at which you will exit a trade to prevent further losses. It directly influences position size: the closer the stop, the larger the position you can take, and vice versa.
2.3 Volatility
More volatile assets require smaller positions, as they are prone to larger price swings. Measures like Average True Range (ATR) help determine an appropriate position size relative to market volatility.
2.4 Account Size
Your total trading capital determines the absolute value of positions. Traders with smaller accounts may use tighter risk management rules to avoid blow-ups.
2.5 Reward-to-Risk Ratio
The potential reward compared to the risk taken affects sizing decisions. Higher reward-to-risk ratios may justify larger position sizes.
3. Position Sizing Methods
Several mathematical methods help determine the ideal position size:
3.1 Fixed Dollar Risk
You risk a fixed amount of money per trade regardless of the asset. For example, a trader risking $100 per trade will always limit losses to $100, whether trading a volatile stock or a low-volatility ETF.
3.2 Fixed Fractional
This method risks a fixed percentage of capital on each trade, which adjusts with account growth or decline. It is widely used due to its simplicity and adaptability.
Example:
With $50,000 capital and a 2% risk, the maximum loss per trade is $1,000. If the risk per share is $5, the position size is $1,000 ÷ $5 = 200 shares.
3.3 Volatility-Based Position Sizing
Adjusts position size according to market volatility. Higher volatility → smaller position size, lower volatility → larger position size. Tools like ATR are commonly used.
4. Position Sizing for Day Trading
Day traders enter and exit positions within the same day, often making multiple trades daily. Because trades are short-term and volatility can be high, risk management is crucial.
Typical Risk per Trade: 0.5–1% of account
Stop Loss: Tight, often based on intraday support/resistance or ATR
Position Size Method: Fixed fractional or volatility-based
Example:
If a trader has $100,000 and risks 1% ($1,000) per trade, with a $2 intraday stop, the position size is $1,000 ÷ $2 = 500 shares.
Key Tips for Day Traders:
Avoid over-leveraging during volatile sessions
Use intraday ATR for adjusting position size dynamically
Focus on liquidity to ensure smooth entry and exit
5. Position Sizing for Swing Trading
Swing traders hold positions from a few days to weeks to capture medium-term price moves. Risk is usually higher than day trading because positions are exposed to overnight and weekend gaps.
Typical Risk per Trade: 1–2% of account
Stop Loss: Wider than day trading, set based on technical levels
Position Size Method: Fixed fractional with ATR adjustment
Example:
A swing trader with $50,000 account risks 2% ($1,000). If the stop loss is $5 per share, the position size is 200 shares. For a stock with higher volatility (stop loss $10), the position size reduces to 100 shares.
Key Tips for Swing Traders:
Factor in overnight risk and earnings events
Adjust positions for volatility spikes
Diversify positions across sectors to reduce correlated risk
6. Position Sizing for Trend Following
Trend followers aim to ride long-term trends, often holding positions for weeks or months. These traders are willing to tolerate larger drawdowns in exchange for higher profits.
Typical Risk per Trade: 1–3%
Stop Loss: Wide, based on trend-defining support/resistance
Position Size Method: Volatility-based or fixed fractional with trailing stops
Example:
For a $100,000 account, a trend follower might risk 2% ($2,000) per trade. Using ATR for volatility measurement, a higher ATR reduces position size to prevent excessive risk during volatile trends.
Key Tips for Trend Followers:
Use volatility-adjusted stops to avoid getting stopped out prematurely
Scale into positions as trend strength confirms
Monitor correlation to avoid overexposure in the same market
7. Position Sizing for Scalping
Scalping involves making dozens or hundreds of trades per day to exploit small price movements. Risk per trade is tiny, but leverage and trade frequency increase overall risk.
Typical Risk per Trade: 0.1–0.25%
Stop Loss: Very tight, often a few ticks or cents
Position Size Method: Fixed fractional with tight risk controls
Example:
A scalper with $50,000 may risk 0.2% ($100) per trade. If stop loss is $0.10, the position size is $100 ÷ $0.10 = 1,000 shares/contracts.
Key Tips for Scalpers:
Execution speed and tight spreads are crucial
Monitor cumulative risk across multiple trades
Avoid trading during illiquid or volatile news events
8. Position Sizing for Options Trading
Options offer leverage, which makes position sizing critical. Option traders often risk a percentage of the premium or account rather than the underlying stock price.
Typical Risk per Trade: 1–3%
Stop Loss: Based on option premium or underlying price movement
Position Size Method: Fixed fractional or risk-defined based on delta
Example:
If a trader has $50,000 and risks 2% ($1,000) per trade on call options costing $5 each, they could buy 200 contracts.
Key Tips for Options Traders:
Factor in implied volatility changes
Avoid allocating too much capital to high-risk out-of-the-money options
Consider position delta to manage exposure to the underlying asset
9. Adjusting Position Size Based on Market Conditions
Market conditions influence position sizing significantly:
High Volatility: Reduce position size to limit risk
Low Volatility: Increase position size cautiously
Correlated Assets: Adjust sizes to prevent overexposure
Economic Events: Reduce exposure during major announcements
Dynamic position sizing is a hallmark of professional traders, allowing them to adapt to changing market environments without compromising risk control.
10. Common Mistakes in Position Sizing
Even experienced traders make mistakes with position sizing:
Ignoring Risk: Taking trades without defining risk can lead to catastrophic losses.
Overleveraging: Using excessive leverage magnifies small losses.
Inconsistent Sizing: Risking different percentages randomly undermines risk management.
Neglecting Volatility: Treating volatile assets the same as stable ones leads to oversized positions.
Not Scaling: Failing to adjust position size as account grows or shrinks.
Avoiding these mistakes is essential for long-term success.
11. Tools and Software for Position Sizing
Modern traders often rely on tools to calculate position size automatically:
Trading Platforms: MetaTrader, ThinkorSwim, NinjaTrader
Risk Calculators: Many online calculators allow inputs for account size, stop loss, and risk per trade
Excel Sheets: Customizable for advanced traders using multiple strategies
These tools save time and prevent errors in manual calculation.
12. Psychological Benefits of Proper Position Sizing
Position sizing is not only about numbers; it also affects trader psychology:
Confidence: Knowing risk is controlled reduces stress.
Discipline: Helps traders stick to strategy without emotional interference.
Consistency: Prevents revenge trading after losses.
A trader who masters position sizing often experiences steadier account growth and lower emotional volatility.
13. Summary and Best Practices
Position sizing is a cornerstone of risk management and long-term trading success. Key takeaways:
Determine your risk per trade relative to account size.
Adjust size based on stop loss, volatility, and trading strategy.
Use fixed fractional, volatility-based, or Kelly criterion methods.
Day traders use tight stops and small risks, swing traders use moderate risk and wider stops, trend followers rely on volatility-based sizing, and scalpers use very small per-trade risk.
Avoid common mistakes like ignoring volatility, overleveraging, or inconsistent sizing.
Employ tools and calculators to ensure accuracy.
Remember that position sizing protects both capital and mental composure.
By combining the right strategy with disciplined position sizing, traders can survive losses, ride profits, and grow their accounts consistently over time.
Conclusion:
Position sizing is the unsung hero of successful trading. It is what separates consistent traders from those who rely solely on prediction and luck. Whether you are a day trader, swing trader, trend follower, scalper, or options trader, understanding and applying proper position sizing can dramatically improve your risk-adjusted returns. Mastering this skill is not optional—it is essential for long-term profitability and trading survival.
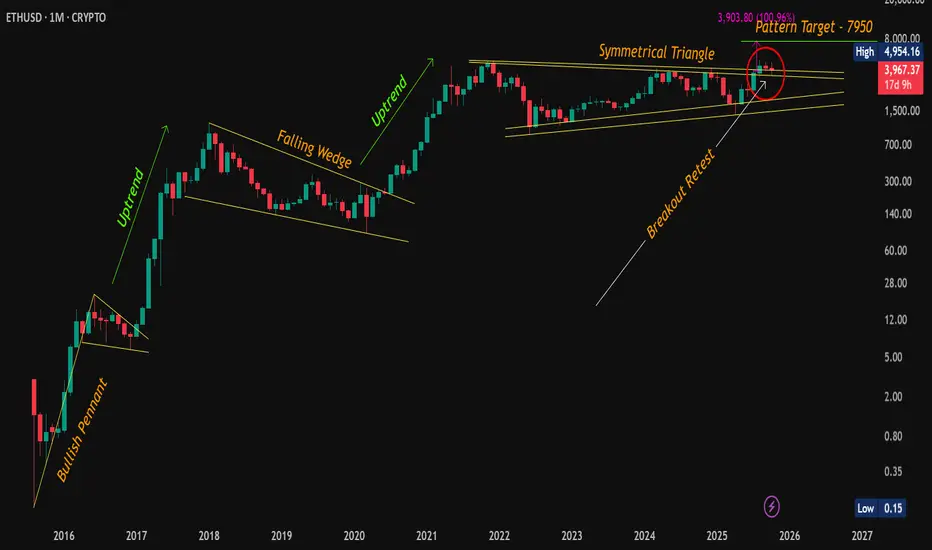
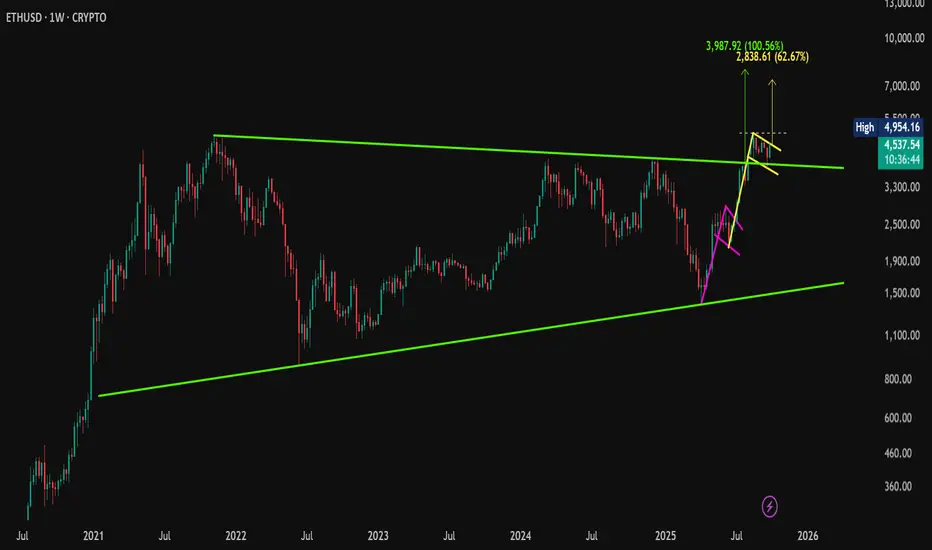
ETH Retest Confirmed – Bullish Momentum Intact!CMP: $3,968
Ethereum is holding strong above the symmetrical triangle breakout zone after a textbook breakout + retest . Despite the recent consolidation, the structure remains bullish , and the bigger pattern is still in play.
🔶 Technical Highlights:
✅ Symmetrical Triangle Breakout: ETH successfully broke out and retested the upper trendline (see red circle). This retest confirms the breakout validity.
✅ Consolidation Above Resistance: ETH is consolidating in a tight range above previous resistance , forming a potential bull flag .
✅ Pattern Targets Remain Active:
📍 Symmetrical Triangle Target: ~$7,950
📍 Bull Flag Target (if breakout confirms): ~$7,365+
📈 Market Structure:
📍 Previous breakouts (Bullish Pennant in 2016, Falling Wedge in 2019) led to strong uptrends .
📍 Current consolidation mirrors historical patterns that preceded major rallies.
🟢 Key Level to Watch:
📍 A monthly close above $4,954.16 (previous ATH) would mark the next major confirmation, likely attracting breakout traders and institutions.
💡 ETH is showing maturity in structure – breakouts, retests, and consolidations are happening on higher timeframes with clear technical precision. The longer this base holds, the stronger the eventual move could be.
📌 Disclaimer: This analysis is shared for educational purposes only. It is not a buy/sell recommendation. Please do your own research before making any trading decisions.
#ETH | #Ethereum | #Crypto | #Breakout | #ChartPatterns | #SymmetricalTriangle | #BullFlag | #PriceAction
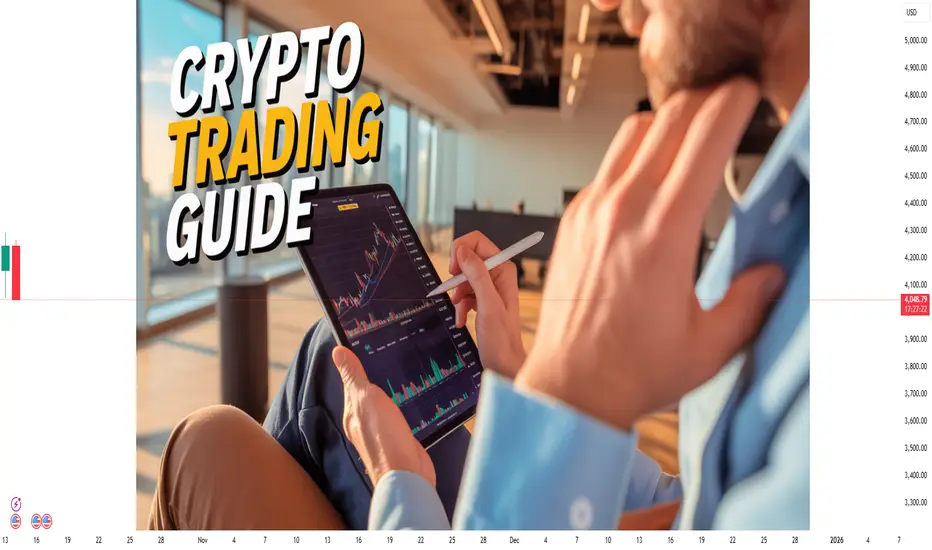
Crypto Trading Guide1. Introduction to Crypto Trading
Cryptocurrency trading involves buying, selling, and exchanging digital assets in order to profit from price fluctuations. Unlike traditional markets, crypto trading operates 24/7 due to the decentralized nature of blockchain technology. The crypto market is highly volatile, which presents both opportunities and risks for traders. Popular cryptocurrencies include Bitcoin (BTC), Ethereum (ETH), Ripple (XRP), Cardano (ADA), and many more altcoins.
Crypto trading is divided into two main categories:
Spot Trading: Buying and selling cryptocurrencies for immediate settlement.
Derivatives Trading: Using financial contracts like futures and options to speculate on price movements without owning the underlying asset.
2. Understanding the Crypto Market
2.1 Market Structure
The crypto market is unique in its decentralized, borderless structure. Unlike traditional markets with centralized exchanges, crypto operates via:
Centralized Exchanges (CEX): Platforms like Binance, Coinbase, and Kraken. These offer high liquidity but require trust in the platform.
Decentralized Exchanges (DEX): Platforms like Uniswap and SushiSwap. These run on smart contracts and allow peer-to-peer trading.
2.2 Market Participants
Crypto market participants include:
Retail Traders: Individual traders buying or selling for personal gain.
Institutional Traders: Hedge funds, banks, and large investors.
Market Makers: Entities that provide liquidity by simultaneously placing buy and sell orders.
2.3 Market Hours
Unlike stock markets, crypto markets operate 24/7, which allows traders to react to news and events instantly. However, this also increases the risk of impulsive decisions.
3. Types of Crypto Trading
3.1 Spot Trading
Spot trading is the simplest form of crypto trading where traders buy crypto at current market prices. Key considerations include:
Order Types: Market orders (buy/sell immediately), limit orders (buy/sell at a specific price), and stop-loss orders (automated exit at a set loss level).
Portfolio Diversification: Spreading investments across multiple assets reduces risk.
Risk Management: Setting strict entry and exit rules is critical due to high volatility.
3.2 Margin Trading
Margin trading allows traders to borrow funds to increase exposure. For example, with 10x leverage, a $100 trade controls $1000 worth of assets.
Risks: Margin trading amplifies both profits and losses. Liquidation occurs if losses exceed collateral.
3.3 Futures and Options Trading
Derivatives trading enables speculation on price movements:
Futures Contracts: Agreements to buy or sell an asset at a future date at a predetermined price.
Options Contracts: Rights (but not obligations) to buy or sell at a fixed price within a certain time.
Perpetual Contracts: Futures with no expiry, commonly used in crypto derivatives markets.
3.4 Algorithmic and Bot Trading
Automated trading uses algorithms to execute trades based on predefined strategies:
Trend-following bots: Buy in uptrends, sell in downtrends.
Arbitrage bots: Exploit price differences between exchanges.
Market-making bots: Provide liquidity while capturing spreads.
4. Fundamental Analysis (FA) in Crypto
FA evaluates a cryptocurrency’s intrinsic value based on technology, adoption, and market dynamics. Key factors include:
Whitepapers: Technical documents explaining the coin’s purpose, roadmap, and use cases.
Development Activity: Active GitHub commits and project updates indicate sustainability.
Network Metrics: On-chain data like transaction volume, wallet addresses, and staking rates.
Regulatory Environment: Government policies can significantly affect prices.
5. Technical Analysis (TA) in Crypto
TA uses historical price data to predict future trends. Key tools and concepts include:
5.1 Chart Patterns
Triangles, Head & Shoulders, Double Tops/Bottoms: Patterns indicate potential reversals or continuations.
Support and Resistance Levels: Price points where buying or selling pressure is strong.
5.2 Indicators and Oscillators
Moving Averages (MA): SMA, EMA help identify trends.
Relative Strength Index (RSI): Measures overbought or oversold conditions.
MACD (Moving Average Convergence Divergence): Trend and momentum indicator.
Bollinger Bands: Measure volatility and potential breakout points.
5.3 Volume Analysis
High trading volume confirms price trends, while low volume may indicate weak moves.
6. Risk Management
Effective risk management is crucial in crypto due to volatility:
Position Sizing: Risk only a small percentage (1–3%) of your capital per trade.
Stop-loss Orders: Limit potential losses automatically.
Diversification: Spread investments across multiple coins and strategies.
Avoid Overleveraging: Using excessive leverage increases the chance of liquidation.
7. Trading Strategies
7.1 Day Trading
Traders buy and sell within the same day to profit from short-term price movements. Requires constant monitoring.
7.2 Swing Trading
Holding positions for days or weeks to capture medium-term trends. Combines TA and FA.
7.3 Scalping
Quick trades lasting seconds to minutes. Focuses on small price changes with high frequency.
7.4 HODLing
Long-term strategy where traders hold assets regardless of market fluctuations. Common with Bitcoin and Ethereum.
8. Psychology of Crypto Trading
Emotional discipline separates successful traders from losers:
Avoid FOMO (Fear of Missing Out): Impulsive buying during rapid price surges can lead to losses.
Control Greed: Exiting trades too late can reverse profits.
Patience and Discipline: Following a strategy consistently is more important than predicting the market perfectly.
9. Security and Safety
Crypto security is critical due to hacks and scams:
Wallets:
Hot Wallets: Online wallets for active trading; convenient but vulnerable.
Cold Wallets: Offline storage; highly secure for long-term holdings.
Two-Factor Authentication (2FA): Adds an extra security layer.
Exchange Reputation: Use reputable exchanges with insurance and strong security protocols.
10. Taxes and Regulations
Crypto trading is subject to tax in most countries. Regulations vary widely:
Taxable Events: Selling crypto, converting to fiat, or trading one coin for another.
Reporting Requirements: Maintain transaction records for audits.
Regulatory Compliance: Know your country’s laws to avoid legal issues.
11. Tools and Resources
Traders rely on tools for research, trading, and risk management:
Trading Platforms: Binance, Coinbase, Kraken.
Charting Tools: TradingView, Coinigy.
News Sources: CoinDesk, CoinTelegraph, CryptoSlate.
Portfolio Trackers: Blockfolio, Delta App.
12. Common Mistakes to Avoid
Ignoring risk management rules.
Overtrading or excessive leverage.
Falling for pump-and-dump schemes.
Neglecting security practices.
Blindly following social media tips.
13. Emerging Trends in Crypto Trading
DeFi (Decentralized Finance): Lending, borrowing, and yield farming.
NFTs (Non-Fungible Tokens): Digital collectibles and gaming assets.
Layer 2 Solutions: Faster, cheaper transactions on Ethereum (e.g., Polygon).
AI-Powered Trading: Leveraging artificial intelligence for predictive analytics.
14. Conclusion
Crypto trading offers immense profit potential but comes with high risk. Success requires a combination of:
Strong technical and fundamental analysis skills.
Effective risk and money management.
Psychological discipline and patience.
Staying updated with market trends, news, and regulatory changes.
By developing a systematic trading plan, diversifying strategies, and prioritizing security, traders can navigate the volatile crypto markets more confidently.
Part 9 Trading Master Class With Experts Option Chain and Market Data
Traders analyze the option chain—a table showing available strikes, premiums, and open interest.
Key Insights from Option Chain:
Open Interest (OI):
High OI at a strike → strong support or resistance zone.
Change in OI:
Helps identify where traders are building positions.
Put-Call Ratio (PCR):
Indicator of market sentiment.
PCR > 1 → bullish sentiment; PCR < 1 → bearish.
Option chain analysis helps identify market bias, expected ranges, and potential breakout zones.

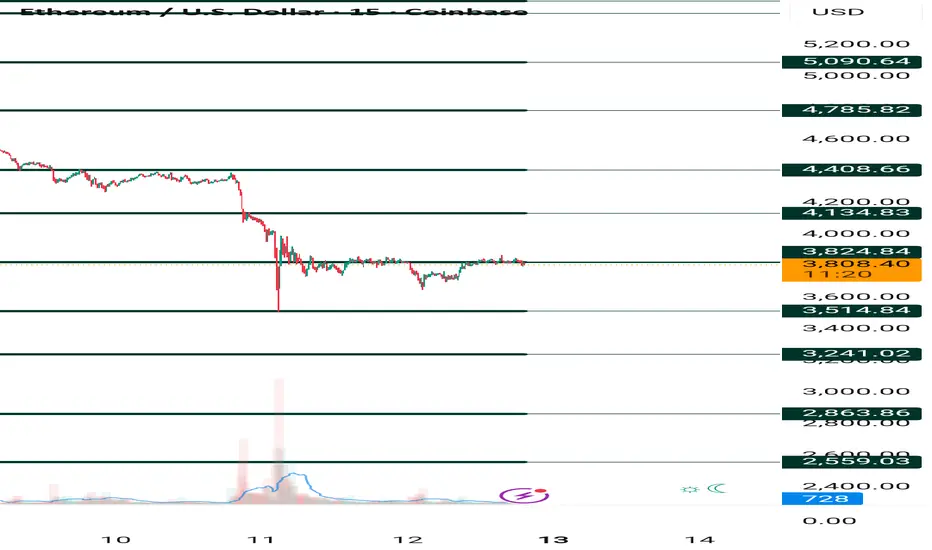
ETHUSD TRADING LEVELSETHUSD TRADING LEVELS. Anyone can Trade on both sides (as per levels)
Levels shared on chart

Ethereum will be continued sell on rise until 4050 not break Ethereum selll on rise until 4050 not break ,
Updated levels given on chart for next week
How My Harmonic pattern projection Indicator work is explained below :
Recent High or Low :
D-0% is our recent low or high
Profit booking zone ( Early / Risky entry) : D 13.2% -D 16.1 % is
range if break them profit booking start on uptrend or downtrend but only profit booking, trend not changed
SL reversal zone (Safe entry ) : SL 23.1% and SL 25.5% is reversal zone if break then trend reverse and we can take reverse trade
Target : T1, T2, T3, T4 and .
Are our Target zone
Any Upside or downside level will activate only if break 1st level then 2nd will be active if break 2nd then 3rd will be active.
Total we have 7 important level which are support and resistance area
Until , 16% not break uptrend will continue if break then profit booking will start.
If break 25% then fresh downtrend will start then T1, T2,T3 will activate
1,3,5,10,15,20 minutes are short term levels.
30 minutes 60 minutes , 2 hours,3 hours, ... 1 day and 1 week chart positional and long term levels
BTCUSD and ETHUSD BTCUSD and ETHUSD could not break the hurdle and formed nearly a triple top pattern. Some reversal has been seen. Maybe could fall some more. One should consider co-relating it with the trend of Gold and find entry opportunities in Crypto (just as a hedge in my view).

Part 2 Trading Master Class With ExpertsHow Option Trading Works
Let’s take a practical example:
Suppose you buy a Nifty 50 Call Option with a strike price of ₹22,000, expiring in one month, by paying a premium of ₹100 per lot (lot size 50).
If Nifty moves up to 22,500 before expiry — your call option becomes profitable because you can buy at 22,000 (strike) and sell at 22,500 (market price).
If Nifty falls to 21,800 — your option becomes worthless, and you lose only the ₹100 premium.
In short, your risk is limited to the premium paid, but your profit potential is unlimited (for call buyers).
Similarly, for a put option, profits come when the market goes down.

ETHUSD: Reversal Expected Near 4100The bullish outlook remains unchanged. We are expecting the price to reverse near 4100 . The sharp move on wave a, a small correction for wave b, indicates a sharp decline and rapid rise in the upcoming days.
Previous research:
Stay Tuned!
@money_dictators
Thanks :)

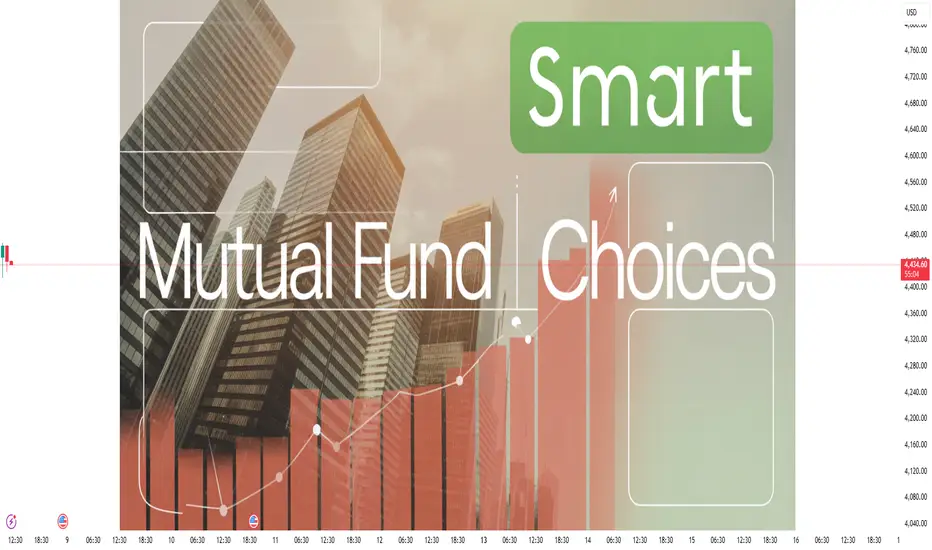
Choose Mutual Funds Smartly1. Understanding Mutual Funds
Before choosing mutual funds, it’s important to understand what they are.
Definition: A mutual fund is a pooled investment vehicle where money from multiple investors is collected and invested in a diversified portfolio of stocks, bonds, or other securities by professional fund managers.
Types of Mutual Funds:
Equity Funds: Invest primarily in stocks; higher risk, higher potential returns.
Debt Funds: Invest in bonds, government securities, and fixed-income instruments; lower risk, moderate returns.
Hybrid Funds: Mix of equity and debt; balance of risk and return.
Sectoral/Thematic Funds: Focus on specific sectors (like technology, pharma) or themes (like ESG investing).
Index Funds & ETFs: Track market indices; passive management; low expense ratio.
Key takeaway: Understanding the type of fund helps align investments with your financial goals and risk tolerance.
2. Define Your Investment Goals
Choosing mutual funds smartly begins with clarity about your financial objectives.
Short-term Goals (0–3 years): Emergency fund, vacation, buying a car. Focus on low-risk funds like debt or liquid funds.
Medium-term Goals (3–7 years): House down payment, higher education. Consider hybrid or balanced funds.
Long-term Goals (7+ years): Retirement, wealth creation. Equity funds or index funds are suitable for long-term growth.
Tip: Always match the fund’s investment horizon with your financial goal horizon.
3. Assess Your Risk Appetite
Risk tolerance is crucial for fund selection.
High-risk appetite: Can tolerate volatility for higher returns → Equity or sectoral funds.
Moderate-risk appetite: Comfortable with some fluctuations → Balanced or hybrid funds.
Low-risk appetite: Prefer stable returns → Debt funds or government securities.
Important: Assess your risk not just financially but emotionally. Some investors panic during market dips.
4. Analyze Fund Performance
Past performance is not a guarantee, but it indicates the fund manager’s skill.
Look for consistency: Check returns over 1, 3, 5, and 10 years.
Compare with benchmarks: A good equity fund should outperform its benchmark index.
Evaluate risk-adjusted returns: Use metrics like Sharpe Ratio or Standard Deviation.
Example: A fund that gives 12% annual return with moderate volatility is preferable to a 15% return fund with extreme fluctuations.
5. Evaluate the Fund Manager
A skilled fund manager can make a huge difference in returns.
Experience matters: Check the manager’s track record over different market cycles.
Fund house reputation: Trust established fund houses with strong research capabilities.
Fund manager tenure: Frequent changes may indicate instability.
Pro tip: A strong fund manager is particularly important in actively managed equity and sectoral funds.
6. Expense Ratio and Fees
Costs directly reduce your returns.
Expense Ratio: Annual fee charged by the fund for managing your money. Lower is better.
Exit Load: Fee for selling before a certain period. Avoid high exit loads if you plan to stay flexible.
Tip: Compare expense ratios across similar funds. Even a 1% difference compounds over long-term investments.
7. Tax Implications
Mutual fund investments are subject to taxes. Understanding them helps in smart planning.
Equity Funds:
Short-term capital gains (STCG) – 15% if held ≤1 year
Long-term capital gains (LTCG) – 10% on gains above ₹1 lakh if held >1 year
Debt Funds:
STCG – Taxed as per income slab if held ≤3 years
LTCG – 20% with indexation if held >3 years
ELSS Funds:
Equity-linked savings scheme; 3-year lock-in; tax-saving benefit under Section 80C
Smart strategy: Use tax-efficient funds to reduce liabilities and increase net returns.
8. Diversification and Portfolio Strategy
Diversification reduces risk without sacrificing returns.
Across Asset Classes: Mix equity, debt, and hybrid funds.
Within Equity: Invest in large-cap, mid-cap, and small-cap funds.
Geographic Diversification: Some funds invest globally, reducing dependence on a single economy.
Example: A portfolio with 50% large-cap equity, 20% mid/small-cap, 20% debt, and 10% international equity balances growth and stability.
9. Check the Fund’s Investment Style
Understanding the fund’s style helps anticipate performance in different markets.
Equity Funds: Growth vs. Value, Large-cap vs. Mid-cap vs. Small-cap
Debt Funds: Duration strategy – short-term, medium-term, or long-term
Hybrid Funds: Equity-Debt ratio and rebalancing frequency
Pro tip: Align the style with market conditions and your risk tolerance.
10. Review Fund Ratings and Research Reports
Independent fund ratings provide a quick insight into quality.
Agencies: CRISIL, Morningstar, Value Research
Ratings reflect: Past performance, volatility, fund manager expertise, and consistency
Use as a guide: Not a sole decision factor
11. Monitor and Rebalance Regularly
Investing smartly doesn’t end at selection.
Track Performance: Review quarterly or semi-annually
Rebalance Portfolio: Adjust allocation as goals, risk tolerance, or market conditions change
Avoid Emotional Decisions: Don’t panic during market downturns; focus on long-term goals
12. SIPs vs. Lump Sum Investment
Systematic Investment Plans (SIPs) are generally safer for new investors.
SIP: Regular, smaller investments; reduces impact of market volatility via rupee-cost averaging
Lump Sum: One-time investment; better if markets are undervalued or for experienced investors
Smart choice: For beginners or long-term wealth creation, SIPs in equity or hybrid funds are ideal.
13. Beware of Marketing Hype
Avoid choosing funds based on:
Short-term performance or “hot” recommendations
Celebrity endorsements or ads
Peer pressure
Smart investors: Focus on fundamentals, not hype.
14. Tools to Aid Smart Selection
Several online platforms can help in research:
Morningstar, Value Research, Moneycontrol: Fund performance, ratings, comparison
Robo-advisors: Personalized fund recommendations based on risk profile and goals
Mutual fund apps: For SIPs, monitoring, and portfolio tracking
15. Case Study: Smart vs. Hasty Choice
Investor A: Chose fund based on last year’s 40% return. Fund dropped 25% next year → panic sold → loss realized.
Investor B: Analyzed 5-year performance, fund manager experience, risk-adjusted returns → consistent 12–15% returns → held long-term → wealth accumulation.
Lesson: Smart selection focuses on consistency, not short-term gains.
16. Final Checklist Before Investing
Define your goal and time horizon
Assess risk tolerance
Understand fund type and strategy
Analyze past performance and fund manager
Compare expense ratios and fees
Evaluate tax implications
Ensure diversification
Start with SIP or lump sum wisely
Monitor periodically and rebalance
Conclusion
Choosing mutual funds smartly is less about luck and more about informed decision-making. By understanding your goals, assessing risk, analyzing funds carefully, and maintaining discipline, investors can achieve consistent returns and long-term wealth creation. Smart investors don’t chase hype—they focus on research, planning, and patience. Mutual funds, when selected and managed intelligently, are a powerful tool for financial freedom.
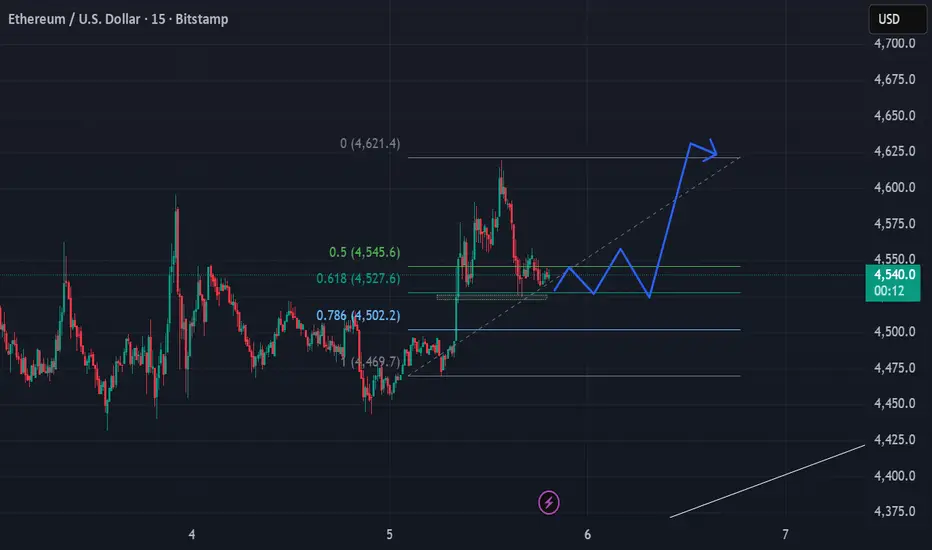
ETHUSD: Where Price Could Go?4h tf
ETHUSD has bounced back strongly from around $3,826 after completing an A-B-C wave pattern. Right now, the price is testing resistance near $4,756. It could drop a little to around $4,440 before moving higher again. If the uptrend continues, the next target levels are $4,955, $5,300, and $5,500.
Stay tuned!
Thank you,
@Money_Dictators

Don't miss this move on Ethereum!!!Price is consolidating on the golden level zone of Fibonacci.
If there is a good bullish candle on after the breakout of consolidation with a good liquidity sweep, go for long!
ETHUSD - Buy Side Entry ZonesETHUSD – Bullish Momentum With Premium Entry Zones 🚀
📍 Bias: Bullish
📍 Pair: ETH/USD
📆 Timeframes: 15m | 4H | 1D | 1W
---
🧭 Multi-Timeframe Context
ETHUSD is showing strong bullish structure on the 4H, Daily, and Weekly timeframes.
Buyers clearly dominate the market right now — every dip is being aggressively bought, and structure is aligned across all major TFs.
This alignment gives us high-probability long setups, especially when paired with clean Order Block + Market Structure Shift entries.
---
🧱 Key Bullish Order Blocks
1️⃣ Breaker Block + Order Block Zone → 4074 – 4248
This zone aligns with a bullish breaker block and previous structure flip area.
A strong reaction from here can fuel the next impulsive leg up.
2️⃣ Deeper OB Zone → 4044 – 3927
Acts as a secondary accumulation zone if price retraces deeper.
Perfect area for scaling in or catching a discounted entry.
---
📈 Execution Plan
Wait for LTF (15-Min) Market Structure Shift inside either OB zone.
Enter on bullish break + retest confirmation to align lower timeframe momentum with higher timeframe trend.
Keep stops below the OB zone you choose to trade, and target new highs in alignment with the macro trend.
> 💡 Remember: Don’t chase green candles — let the market come to your zones and show intent before execution.
---
⚠️ Final Note
With all higher timeframes bullish and clean OB zones below, ETHUSD is setting up for continuation plays. Patience and structured execution on LTF will give the best RR setups.
---
🚀 Bulls are in control — now it’s about precision entries.
#ETHUSD #TradingView #SmartMoneyConcepts #OrderBlocks #PriceAction #CryptoTrading

ETH Triangle Breakout + Bull Flag Setup – Is $8K Next?CMP: $4,540
Ethereum has broken out of a long-term symmetrical triangle , retested the trendline, and is now moving higher — signaling strong bullish momentum.
🔹 Breakout Retest Done – ETH completed a clean breakout and retest of the triangle resistance.
🔹 Bull Flags – Two bullish continuation flags have formed. The second flag is on the verge of breaking out , hinting at another potential leg up.
🔹 Pattern Targets –
• Bull Flag target: $7,365 +, if breakout confirms.
• Symmetrical Triangle target: $7,950 , which is over 62% above current price.
🟢 Key Level to Watch: A weekly close above $4,954.16 (previous ATH) would further validate the bullish structure.
#ETH | #Ethereum | #Crypto | #Breakout | #ChartPatterns | #SymmetricalTriangle | #BullFlag | #PriceAction
📌 Disclaimer: This analysis is shared for educational purposes only. It is not a buy/sell recommendation. Please do your own research before making any trading decisions.
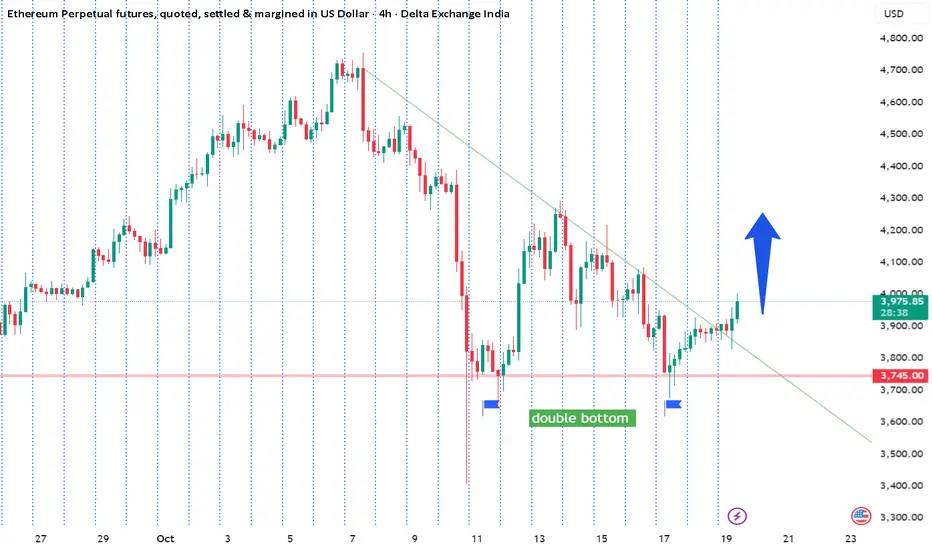
A bullish TA for EthereumThe price has successfully broken above the "Neck line". This breakout is a confirmation signal for the double bottom pattern, suggesting a potential trend reversal to the upside.
Several potential price targets for the completion of Wave 5. These bullish targets include:
4,929.47
5,068.66
5,133.26
5,166.99
5,370.77
Also indicates a potential failure point for this bullish scenario. If the price were to reverse and break down below the double bottom lows, the downward-pointing Fibonacci extension levels suggest potential bearish targets at:
3,656.23
3,582.49

ETHEREUM COULD SEE 6000 Soon We may see strong 3rd wave towards 6000/8000 soon as the volatality increase .
3rd wave Personality we have seen from 3850 low if the pressure towards high intake we may see new high by end of the year .

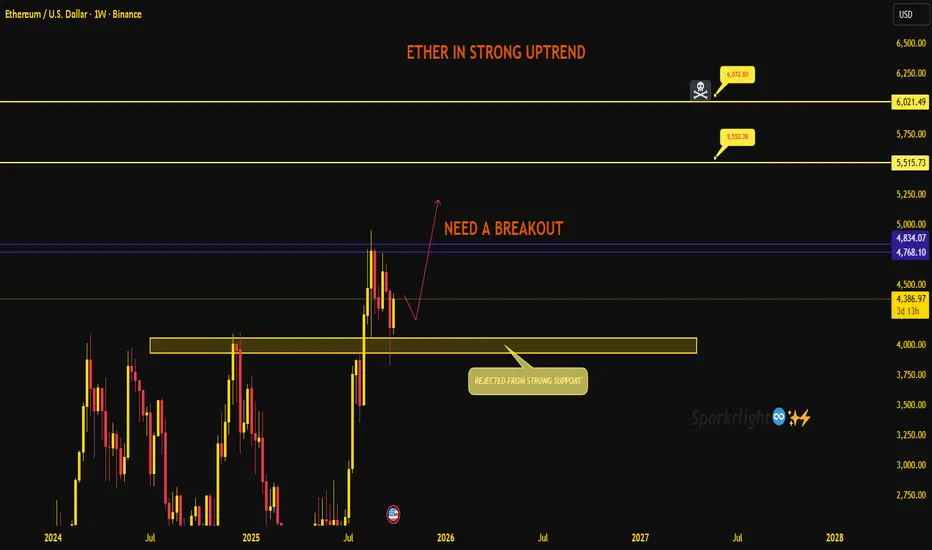
Ethereum – Strong Uptrend but Needs a Breakout!!Ether is still holding its strong uptrend, and the recent rejection from support has kept the bullish structure intact. The bigger picture remains positive, but short-term price action now demands a clear breakout to confirm continuation.
Current structure:
Price bounced cleanly from the 4000 zone, showing that buyers are defending the base.
The rally stalled just below the 4800–4850 resistance. This is the key barrier that needs to give way for the next leg higher.
Until then, we are stuck in a consolidation between strong support below and heavy resistance above.
Key levels to track:
Support: 4050–3950. As long as this zone holds, bulls keep the upper hand.
Breakout zone: 4768–4834. A weekly close above here should trigger momentum buyers.
Upside targets: 5515 → 5550, and if momentum extends, 6,000+.
Short-term view:
Ethereum is in a strong trend but needs that breakout above 4,800 to unlock the next wave higher. If buyers fail to push through, expect more back-and-forth action near support before another attempt.
The structure favors patience – wait for the breakout confirmation rather than chasing inside the range. Trade safe.