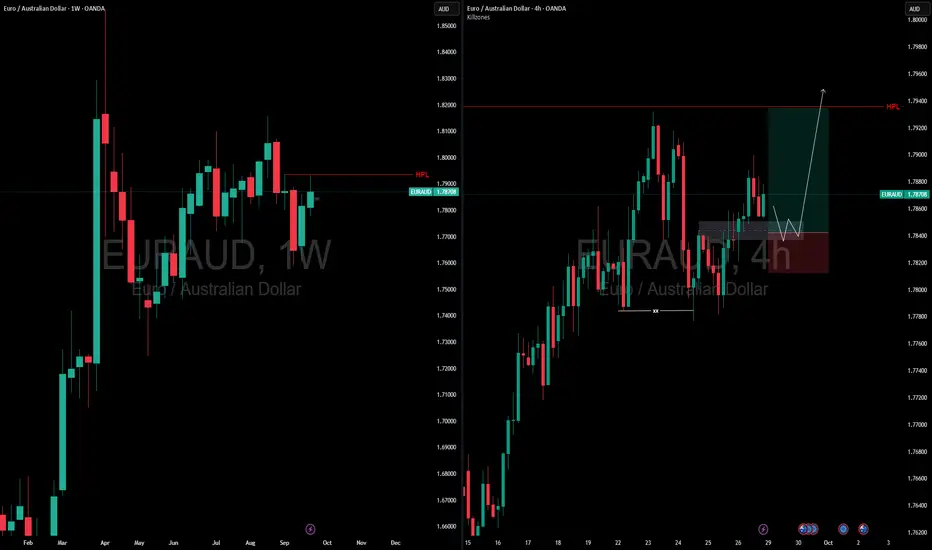
EURAUD Bearish SetupIf we look at H4 chart of ICMARKETS:EURAUD , it made a great reversal and formed a bearish Engulf at 70% Fib Level.
The H4 timeframe is forming a slid rationality to be bearish on H1 timeframe. The targets may take a week or so to hit while the SL may hit within a few days.
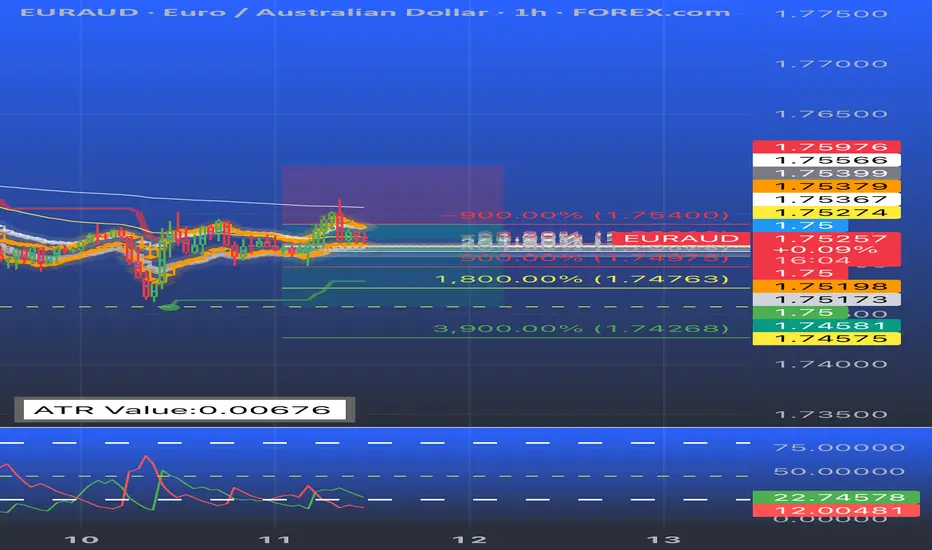
On H1 timeframe the MACD showed overboughtness and the price is probably to change its trend from Bullish to bearish.
the MACD divergence is second by Lower High formation indicating a bearish signal.
Now we need a confirmation for the price to cross the HIgher Low at 1.7795.
I will place a sell stop order 1.7793 with my SL at the Higher High at 1.7863
I will take two positions both at the breakout Higher Low at 1.7793. Both position has 2% risk in total with the stop loss at 1.7863
Note: The Sell stop order is a must. If its not triggered then we are not aiming for any other trade.
Important: If TP1 Hit, we will move our SL to Break even to trade the rest 2.5x reward with 0 risk.
Position 1 with 1 % Risk
Sell Stop: 1.7793
Stop Loss: 1.7863
TP: 1.7723
Position 1 with 1 % Risk
Sell Stop: 1.7793
Stop Loss: 1.7863
TP: 1.7615
EURAUD trade ideas

EURAUD MULTI TIME FRAME ANALYSISHello traders , here is the full multi time frame analysis for this stock , let me know in the comment section below if you have any questions , the position will be taken only if all rules of the strategies will be satisfied. wait for more price action to develop before taking any position. I suggest you keep this pair on your watchlist and see if the rules of your strategy are satisfied.
🧠💡 Share your unique analysis, thoughts, and ideas in the comments section below. I'm excited to hear your perspective on this pair .
💭🔍 Don't hesitate to comment if you have any questions or queries regarding this analysis.
BUY EURAUDTrade Idea: BUY EURAUD
The EURAUD pair is showing renewed bullish momentum as the Euro gains strength against the Australian Dollar. Market sentiment is tilted in favor of EUR, supported by stability in the Eurozone, while AUD is weighed down by softer risk appetite and commodity price pressures.
🔹 Technical Outlook:
Price is holding firmly above the support zone, which acts as a strong base for buyers.
The pair is trending higher, forming higher lows — a sign of continued upward momentum.
Immediate resistance lies at 1.75874. A breakout above this could open the path toward 1.75870 levels.
🔹 Trading Bias: Bullish
Entry: Around 1.76092-1.76080 (on pullbacks)
Target: 1.84419
Stop Loss: 1.74217
⚠️ Always apply proper risk management as volatility in EURAUD can be high.

EURAUDThis is the scenario I have beem waiting for. Price took out the 4H high and flipped 15min structure. 8 BARS DOWN, 55 BARS UP CONFIRMS SELLERS ARE IN A CONTROL AND I EXPECT THEM TO STEP IN AT 1.79000 CANDLE to push price lower into demand zone. Let's see.

EURAUDEURAUD is showing similar behavior to other EUR pairs — strong bullish move with a break in structure. Now just waiting for a retracement back down into the 4H demand zone before looking for long opportunities.
Would like to see price come into that zone, react, and show signs of strength again before considering buys. Just being patient and letting the setup come to me.

EURAUD, COUNTER TREND BUYSI'm currently in a buy trade on EUR/AUD.
Price made a strong push down, but now I’m looking for a move back up into the supply zone before looking for any sells.
This is a counter-trend setup, so the risk is higher and the probability lower — I’m keeping my position size small.
I liked how price reacted slowly from the 15min demand zone, showing some accumulation. Now I'm waiting for volume to kick in to push it higher.

EURAD POTENTIAL LONGLooking at EURAD on the 1h timeframe,currently looking to take a long position upon the retest of the recently formed 4h and 1h demand zone.A break below the recently formed swing low will invalidate the long.

EURAUD MULTI TIME FRAME ANALYSISStarting from the monthly, we’re seeing a potential bullish continuation off a flipped support zone, lining up with the 38.2% Fibonacci level.
On the weekly, price is rejecting from key fib support, with strong bullish structure in play.
The daily is holding structure above support and shows signs of continuation.
If we break above the current 1H/4H high, I’ll be watching for a clean pullback to enter long.
🎯 Bullish Bias for the week
🗓️ Timeframes used: Monthly ➝ Weekly ➝ Daily ➝ 4H ➝ 1H
📍Key Levels marked
📌 Setup ideas explained
📥 Comment your view on EUR/AUD — agree or disagree?
#forex #euraud #forexanalysis #priceaction #multiTimeFrame #tradingview #forextrader #marketbreakdown #technicalanalysis #smartmoney #tradingpsychology #forexeducation

BUY IDEA EURAUD Looking to buy EURAUD after pull back expecting bulls to continue pushing the market higher.

EUR/AUD | 15Min BTST Idea – 15 July 2025📌 EUR/AUD | 1H Idea – 15 July 2025
Bias: Bearish (Rejecting trendline & resistance)
CMP: 1.78002
Market Structure
• Price in consistent lower highs and lower lows under 1H downtrend line.
• Rejected major resistance zone near 1.7850 after retest.
Levels
│ R1 1.78526 │ R2 1.79000
│ S1 1.77308 │ S2 1.76284
Trade Plan
🔴 Breakdown Short → Entry on 1H close < 1.78000
Targets: 1.77308 / 1.76315 | SL: 1.78526
🟢 Reversal Long → Entry on 1H close > 1.78526 (breakout of trendline + resistance)
Targets: 1.79000 / 1.79350 | SL: 1.77950
Notes
• Price respected the 1H downtrend and rejected resistance cleanly.
• Ideal R:R setup with clear invalidation above resistance zone.
Set TradingView alerts at 1.78000 (breakdown) and 1.78526 (breakout); risk ≤ 1% capital.
#PriceAction #EURAUD #1H #GLOBALTRADESECURITIES

EURAUD | 1hr Idea – 14 Jul 2025📌 EURAUD | 1hr Idea – 14 Jul 2025
Bias: Bearish below box and trendline
CMP: 1.7765
Market Structure
• Series of lower highs and lows
• Currently consolidating in a box below trendline resistance
Levels
│ R1 1.7800 │ R2 1.7855
│ S1 1.7680 │ S2 1.7628
Trade Plan
🔴 Breakdown Short → Entry on 1hr close < 1.7745
Targets 1.7680 / 1.7628 | SL 1.7805
🟢 Breakout Long → Entry on 1hr close > 1.7805
Targets 1.7855 / 1.7900 | SL 1.7750
Notes
• Bearish trend unless breakout above 1.7800
• Box acting as indecision zone — avoid until clear move
Set alerts at 1.7805 and 1.7745. Risk ≤ 1 %.

Buy Trade - EUR/AUDGreetings to everyone!
You can place a buy trade on EUR/AUD and check out my chart for the ideal entry, stop-loss & target placement.
Remember :-
* Move your SL to breakeven once the trade reaches 1:1 R.
* Aim for a minimum reward of 1:1.5 R.
* Don't risk more than 3% of your total margin.
Let's execute this trade smartly! 🚀
💬 About Me:
I am a professional trader with over four years of experience in the markets. I focus on swing trading using the 4H timeframe, mainly in the forex space. The trades I share here are the actual positions I’m executing. I post them as a small gesture to give back to the trading community that’s been a big part of my journey.
Cheers! 🙏

EURAUD quantum decode - sell set up u folding for the day
**Pair:** EURAUD
**Bias:** Strong Sell
**Entry Zone:** 1.75330
**Target:** 1.74600
**Stop Loss:** 1.76000
📉 **Technical Breakdown:**
EURAUD has printed a **clear exhaustion at the top**, showing signs of fading bullish momentum. We’re seeing:
✅ A clean **double top formation** on the 1H
✅ Rejection from a **key supply zone** (1.7530 – 1.7550)
✅ Bearish divergence on RSI + MACD crossover
✅ Weak volume on the last push up — signs of a trap
This pair is now primed for a **quantum drop** toward 1.74600 — a level where smart money is likely positioned.
---
🧠 **Why It Matters:**
At XYZER, we don’t predict — **we decode moves that already exist in the future**.
This sell setup isn’t a guess — it’s a high-probability **alignment of momentum, structure, and liquidity logic**.
---
🔔 **Watch This:**
If EURAUD fails to break above 1.7555 again today, this trade could turn into a textbook reversal.
The confirmation comes with a strong bearish candle below 1.7520.
---
📌 **#XYZER Insight:**
This isn’t just another trade. It’s a precision-aligned move.
We're not here to catch noise — we're here to **sync with the inevitable**.
FXHUNTER / EURAUDHello, I'm FXHUNTER. In this post, we will examine the EURAUD symbol. Given that this symbol is forming lower highs and lows, it means that the trend is down. In downtrends, we look for weak bullish block orders to place our order on. You can place an order with more confidence by forming a choch in the 1-minute time frame.

EUR/AUD Bullish Channel Trade Setup –Demand Zone Bounce Strategy📉 1. Downtrend Ends
🔽 Price was falling earlier (left side of chart)
🔄 Then it reversed at the bottom of the channel (yellow dot)
➡️ Trend Change Begins
📈 2. Uptrend Channel Forms
📊 Channel consists of:
🔵 Resistance Line (upper blue)
🟢 Support Line (lower blue)
🔁 Price is bouncing between these two lines like a pinball:
🔵 Resistance Line
| 🔼
🟢 Support Line
💠 3. Key Trading Zone
🔷 DEMAND ZONE: (Bright blue box)
🟦 Between 1.74697 and 1.75349
👉 Buyer interest expected here
🎯 4. Trade Setup (Bullish Idea)
🟢 Entry Point:
📍 1.75349
✨ Near support zone and channel bottom
🔻 Stop Loss:
🚫 1.74710
📉 Below the demand zone, protects from downside
🎯 Target Point:
🎯 1.77800
📈 Near the resistance line at the top of the channel
📊 Strategy Flow (Emoji Dots Path)
📉 🔽 🔽 🔽
🟡 Bottom found
⬆️ 🔼 🔼 🔼
📈 Enters channel
🟦 Price enters DEMAND ZONE
🔽
🔵 Entry: 1.75349
🔼
🎯 Target: 1.77800
✅ Final Thoughts
This is a clean bullish setup within a rising channel
✅ Wait for price action confirmation (like a bullish candle 🕯️) in the demand zone
🔒 Protect with your stop loss
🚀 Potential reward is strong if it bounces up

ICT HUNTER EURAUDHello, I am FXHUNTER. Analysis of the EURAUD symbol. The trend of this symbol is bullish and we have a bearish block order that has managed to break its previous ceiling and also create liquidity. This is an important area. If the price reaches it, we can enter a BUY position if CHOCH is formed on the 1m time frame. / Follow us

ICT New analysisHello, I'm FXHUNTER. New analysis on the EURAUD symbol. This symbol is likely to be supported by the specified price area due to its consolidation with the GBPAUD symbol.

ictHello, I'm Forex Hunter. Analysis of the Euraud symbol. In this chart, we have a downtrend and I have identified a block order that has broken its previous low, which could push the price down.

EURAUD BUYSAs you can see, the price is approaching the daily demand zone — our potential buy area. The green box marks the zone where inefficiency is filled, as well as the last candle before a strong upward move. We also have the 1.72000 level, a round number that can naturally attract price action due to institutional orders and interest.
The grey circles highlight the low and high of my daily trading range. What I like about the current price action is the impulsive move to the upside, followed by a steady and controlled pullback as the price approaches the buy zone.
This setup presents a strong trading opportunity — now we wait and see.

"EUR/AUD Bearish Channel with Key Support Ahead"📉 Market Structure Analysis (Bearish Bias)
Current Trend:
The pair is trading within a well-defined descending channel, indicating a bearish trend. Price action is forming lower highs and lower lows, adhering to the channel boundaries.
Moving Averages (EMA):
EMA 50 (Red) at 1.77491 is above the price, acting as dynamic resistance.
EMA 200 (Blue) at 1.73338 is close to current price, likely to act as a support area in the short term.
The bearish crossover between the 50 EMA and current price supports the continuation of downward momentum.
🔍 Key Zones:
Weak Resistance Zone:
Located around 1.7740 – 1.8000, previously a support area, now acting as resistance.
Price rejection from this zone multiple times indicates sellers' strength.
Support Zone:
Located around 1.6950 – 1.7100, where demand may return.
This zone coincides with the lower boundary of the descending channel, making it a likely reaction zone.
📊 Forecast / Expectation:
The chart projects a bear flag / corrective pullback before another leg downward toward the support zone.
If price breaks and sustains below the EMA 200, it will likely accelerate bearish pressure.
The descending channel suggests potential continuation to the downside unless price breaks out of the upper boundary with momentum.
✅ Trade Implications:
Bearish Setup:
Look for short opportunities on intraday pullbacks near the resistance or EMA 50.
Bullish Invalidations:
A breakout above the descending channel and sustained move above 1.7800 would invalidate the bearish outlook.
Conclusion:
This chart presents a technically clean bearish setup. The confluence of a descending channel, EMA rejection, and defined resistance/support zones suggests the EUR/AUD may continue lower, especially if it loses the 1.7300 level decisively.

EURAUD Short Setup – Bearish Breakdown & Retest of Key Structure📋 Pair: EURAUD
Timeframe: 4-Hour
Bias: Bearish
Strategy Type: Supply & Demand + Trendline Break + BOS (Break of Structure) + Retest Confirmation
🧠 Market Structure Analysis:
Price has formed a series of lower highs and lower lows, confirming a bearish trend on the 4H chart.
A clean descending trendline has been respected multiple times, adding confluence to the bearish pressure.
Recently, price broke below a strong horizontal support zone (~1.7580), which had acted as a demand area multiple times in the past.
After the breakdown, price pulled back to retest this previous support as resistance, perfectly tapping into a supply zone before rejecting.
🧱 Key Zones:
Supply (Resistance): 1.7580 – 1.7674
Entry Zone (Trigger): Inside rejection candle from supply
Target Demand (Support): 1.7100 – 1.7120 (clean untested demand + price imbalance)
🎯 Trade Plan:
Entry: 1.7570 (after confirmation of rejection from supply)
Stop Loss: 1.7680 (above the supply zone + trendline)
Take Profit 1: 1.7350 (minor structure)
Take Profit 2: 1.7120 (major untested demand zone)
Optional TP3: 1.7099 (full imbalance fill)
⚖️ Risk-to-Reward (R:R):
TP1: ~1:2
TP2: ~1:4
TP3: ~1:5+
✅ Confluences Supporting the Setup:
✅ Break and Retest of major 4H support (turned resistance).
✅ Bearish trendline acting as dynamic resistance.
✅ Liquidity sweep before rejection (stop hunt above minor highs).
✅ Bearish candle confirmation from retest zone.
✅ Target aligns with clean demand + imbalance, likely to attract buyers.
⚠️ Invalidation Criteria:
If price breaks and holds above 1.7680, structure is invalidated.
Watch out for fakeouts around FOMC or major AUD/Euro news.
💡 Pro Tip (Optional):
You can scale in on lower timeframes (15M–1H) after a CHoCH (change of character) within the retest zone for tighter entries and smaller stops.
Disclaimer: This analysis is for educational purposes only and not financial advice. Manage your risk wisely.

EURAUD EYES A REBOUND - CAN THE BULLS HOLD THE SUPPORT?Symbol - EURAUD
Amid a broader global bullish trend, the EURAUD pair is currently undergoing a corrective phase, approaching the support zone of the established trading range. Market participants are observing efforts by buyers to defend the 1.7750 level.
The pair remains within a broad consolidation range. Price action near the lower boundary has exhibited signs of a false breakout and subsequent liquidity absorption, which could potentially trigger a rebound toward the midpoint of the range or even a move toward the upper resistance levels.
Sustained consolidation above the 1.7750 mark, coupled with the emergence of a local reversal pattern, may serve as a catalyst for renewed upward momentum. While the overarching trend remains bullish, the current move reflects a local correction. Fundamentally, conditions remain uncertain. However, the US Dollar Index continues to correct after a recent sharp decline.
Key Resistance Levels: 1.7855, 1.7987
Key Support Levels: 1.7750, 1.7695
Should bullish momentum prevail and price remain above the critical 1.7750 support - marking the lower boundary of the range, there is potential for a rebound targeting liquidity pools situated above resistance levels.

EURAUDPrice action trading is a methodology in financial markets where traders make decisions based on the actual price movements of an asset over time, rather than relying heavily on technical indicators or fundamental analysis. It involves observing and interpreting patterns and trends in price charts to predict future price movements.
