Exelixis (EXEL) – Oncology Innovation & Growth Potential Company Overview:
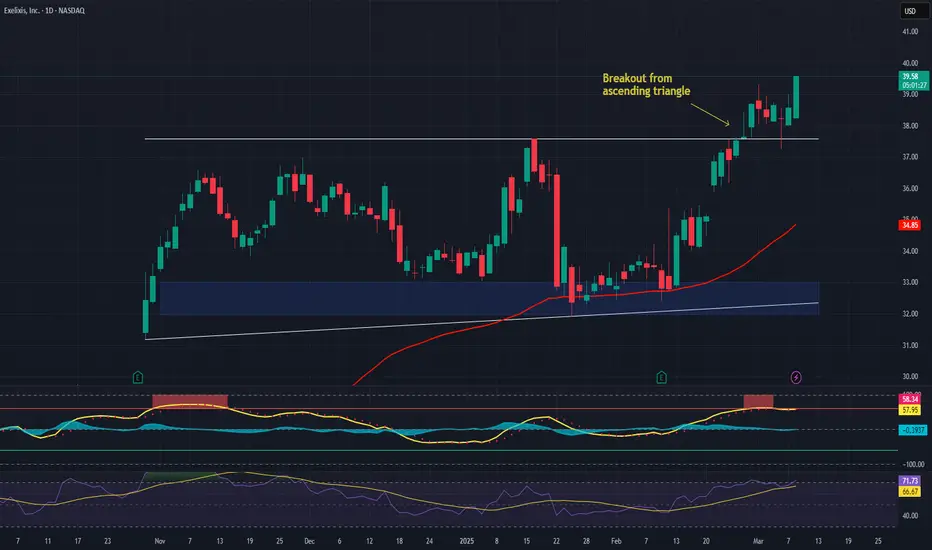
Exelixis NASDAQ:EXEL is a biotech leader in oncology, with its flagship drug cabozantinib generating $1.81B in U.S. revenue for FY 2024.
Key Catalysts:
Pipeline Strength & Upcoming Data Readouts 🔬
Zanzalintinib (XL092): Pivotal 2025 trial results could position it as a next-ge
Next report date
—
Report period
—
EPS estimate
—
Revenue estimate
—
1.83 EUR
503.53 M EUR
2.09 B EUR
260.65 M
About Exelixis, Inc.
Sector
Industry
CEO
Michael M. Morrissey
Website
Headquarters
Alameda
Founded
1994
ISIN
US30161Q1040
FIGI
BBG000BL32G5
Exelixis, Inc. operates as an oncology company, which focuses on discovering, developing, and commercialization of new medicines for difficult-to-treat cancers. Its products include cabometyx, cometriq, and cotellic. The company was founded by Stelios Papadopoulos on November 15, 1994, and is headquartered in Alameda, CA.
Related stocks

An aggregate view of professional's ratings.
Neutral
SellBuy
Strong sellStrong buy
Strong sellSellNeutralBuyStrong buy
Neutral
SellBuy
Strong sellStrong buy
Strong sellSellNeutralBuyStrong buy
Neutral
SellBuy
Strong sellStrong buy
Strong sellSellNeutralBuyStrong buy
Displays a symbol's price movements over previous years to identify recurring trends.
Curated watchlists where EX9 is featured.

Frequently Asked Questions
Depending on the exchange, the stock ticker may vary. For instance, on FWB exchange Exelixis, Inc. stocks are traded under the ticker EX9.
We've gathered analysts' opinions on Exelixis, Inc. future price: according to them, EX9 price has a max estimate of 51.08 EUR and a min estimate of 29.80 EUR. Watch EX9 chart and read a more detailed Exelixis, Inc. stock forecast: see what analysts think of Exelixis, Inc. and suggest that you do with its stocks.
Yes, you can track Exelixis, Inc. financials in yearly and quarterly reports right on TradingView.
Exelixis, Inc. is going to release the next earnings report on Nov 4, 2025. Keep track of upcoming events with our Earnings Calendar.
EX9 earnings for the last quarter are 0.64 EUR per share, whereas the estimation was 0.57 EUR resulting in a 12.31% surprise. The estimated earnings for the next quarter are 0.58 EUR per share. See more details about Exelixis, Inc. earnings.
Exelixis, Inc. revenue for the last quarter amounts to 482.40 M EUR, despite the estimated figure of 489.98 M EUR. In the next quarter, revenue is expected to reach 502.30 M EUR.
EX9 net income for the last quarter is 156.92 M EUR, while the quarter before that showed 147.54 M EUR of net income which accounts for 6.36% change. Track more Exelixis, Inc. financial stats to get the full picture.
No, EX9 doesn't pay any dividends to its shareholders. But don't worry, we've prepared a list of high-dividend stocks for you.
As of Oct 5, 2025, the company has 1.15 K employees. See our rating of the largest employees — is Exelixis, Inc. on this list?
EBITDA measures a company's operating performance, its growth signifies an improvement in the efficiency of a company. Exelixis, Inc. EBITDA is 663.44 M EUR, and current EBITDA margin is 33.14%. See more stats in Exelixis, Inc. financial statements.
Like other stocks, EX9 shares are traded on stock exchanges, e.g. Nasdaq, Nyse, Euronext, and the easiest way to buy them is through an online stock broker. To do this, you need to open an account and follow a broker's procedures, then start trading. You can trade Exelixis, Inc. stock right from TradingView charts — choose your broker and connect to your account.