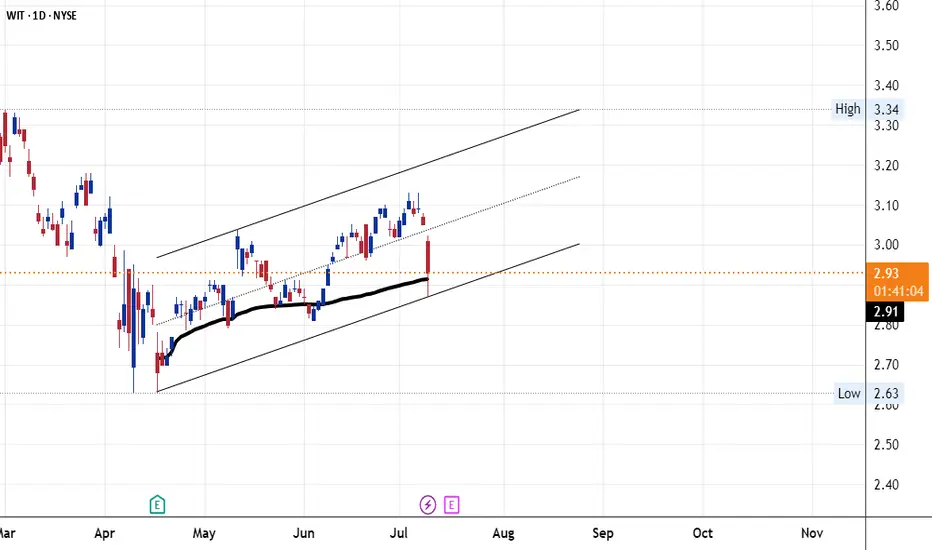
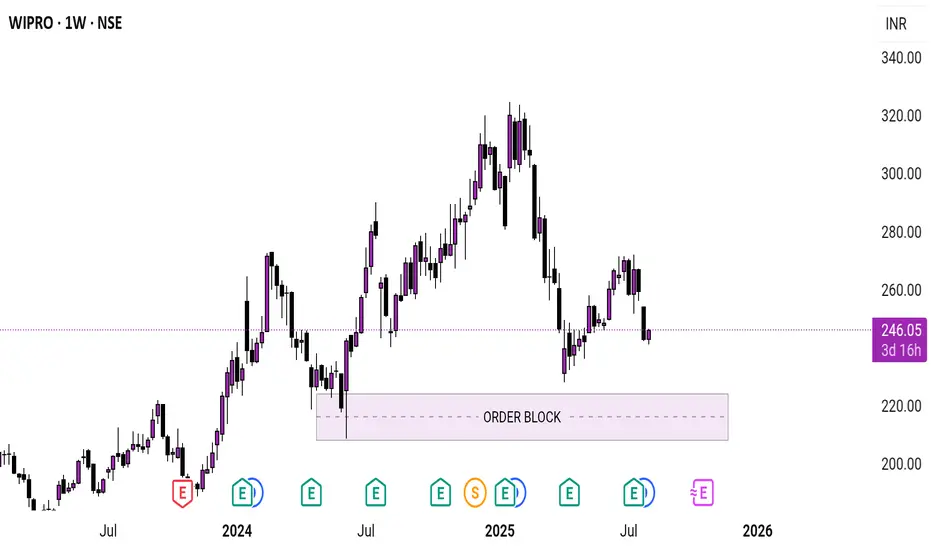
WIPRO 1 Week Time Frame🔍 Key levels
Current price (approx): ₹ 236.49.
Recent weekly low zone / support: around ₹ 235–238. (Recent lows noted ~₹ 236.00)
Near-term resistance / recent highs: around ₹ 243–245.
Technical sentiment: The 1-week technical rating from one source shows a “Sell” bias.
🎯 Implication for the next week
If WIPRO holds above the support ~₹235-238, it could attempt a bounce toward ~₹243-245.
If support breaks below ~₹235, next downside risk could open up (so watch for a break).
Because sentiment is weak (Sell bias), expect any rebound to be modest unless strong catalyst appears.
Trade ideas
The Gann Fan is a powerful technical analysis tool (WIPRO)The Gann Fan is a powerful technical analysis tool created by W.D. Gann that combines price + time + geometry to identify support, resistance, and potential reversal points.
Your Wipro chart already has a perfectly drawn Gann Fan — let’s decode exactly how to use it step-by-step for real trading.
1. How the Gann Fan is drawn (what you see on Wipro)
Starting point (Swing Low): 6 Feb 2025 @ ₹211.00
Ending point (Swing High): 20 Feb 2025 @ ₹339.80
The software automatically draws 9 rays at precise Gann angles:
1×1 = 45° (the most important line – “the trend is your friend” as long as price stays above it in uptrend)
1×2 = 63.75° (steeper)
2×1 = 26.25° (flatter)
1×3, 1×4, 1×8, 3×1, 4×1, 8×1
2. Current situation on Wipro (8 Nov 2025)
Price has fallen from ₹339 → ₹236.49 (-30% in 9 months)
It is now sitting exactly on the 1×1 Gann line (the thick middle line)
This 1×1 line has acted as dynamic support 4 times already (Apr, Jun, Aug, Oct)
3. How to trade using this Gann Fan RIGHT NOW
BULLISH SCENARIO (High-probability bounce)
Entry rules:
Wait for a daily close above ₹240 with strong green candle
Or wait for a 3-day higher-high higher-low pattern above the 1×1
Target levels (using Gann Fan rays):
First target: 1×2 line → ₹265-268 (already touched in Oct, strong resistance)
Second target: 2×1 line → ₹295-300
Third target: 1×3 line → ₹316 (previous breakdown level)
Stop-loss:
Any daily close below ₹230 (below 1×1 + baseline zone) → trend officially broken
BEARISH SCENARIO (Breakdown trade)
If price closes below ₹230:
Target 1×4 line → ₹195-200
Final target 1×8 line → ₹150-160 (measured move = height of triangle)
4. Gann Fan Golden Rules (works on any stock)
1×1 is King
Bullish as long as price stays above 1×1
Bearish below 1×1
Time + Price = Square
Gann said when a stock falls below 1×1 for exactly the same number of days it rose, reversal is due.
Wipro rose from 6-Feb to 20-Feb = 14 days
It has now fallen for 260+ days → extreme oversold in Gann terms → high probability of sharp bounce
50% + 1×1 confluence = Magic
50% retracement of 211-339 = ₹275
Look: the 1×2 Gann line is exactly at ₹268-270 → double confluence coming soon
5. Ready-made trading plan for Wipro (Nov 2025)
BUY ZONE: ₹232 – ₹238 (current price sitting on 1×1)
STOP-LOSS: ₹229 (daily close basis)
TARGET 1: ₹268 (1×2 line) → +14%
TARGET 2: ₹295 (2×1 line) → +25%
TARGET 3: ₹316 (RDL-80%) → +35%
RISK:REWARD = 1:4
6. How to draw Gann Fan yourself (step-by-step)
Identify a clear swing low to swing high (or high to low)
In TradingView → Tools → Gann Fan
Left-click on low → drag to high → release
Right-click on fan → Settings → make 1×1 visible and thick
Done!
Pro tip: Use Gann Fan + Fibonacci retracement together → 90% accuracy on reversals.
Wipro is at a textbook Gann 1×1 support after 260 days of correction.
Either we get a massive bounce starting next week, or ₹150 is coming if ₹230 breaks.
Place your alert at ₹240 and ₹229 — the next 5-10 trading days will be explosive.

WIPRO 1 Week View📊 Current Price & Context
The last closing price is around ₹242.98.
The stock has a 52-week range of ~ ₹228.00 (low) to ~ ₹324.60 (high).
Weekly pivot/structure is showing neutral-to-bearish trend unless a strong breakout occurs.
🔍 Weekly Frame Key Levels
Based on multiple technical sources:
Pivot zone (~ decision area): ~ ₹240-243 (weekly pivot level)
Upside resistance levels:
R1: ~ ₹243.80
Further resistance likely near ₹247-₹252 zone (derived by projection)
Downside support levels:
S1: ~ ₹238.08
S2/S3: ~ ₹234.82, ~ ₹230.37
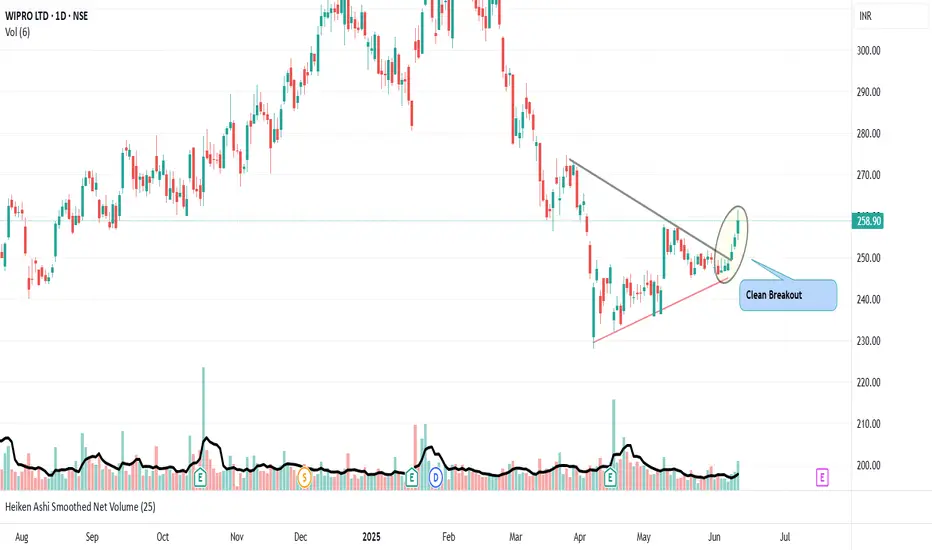
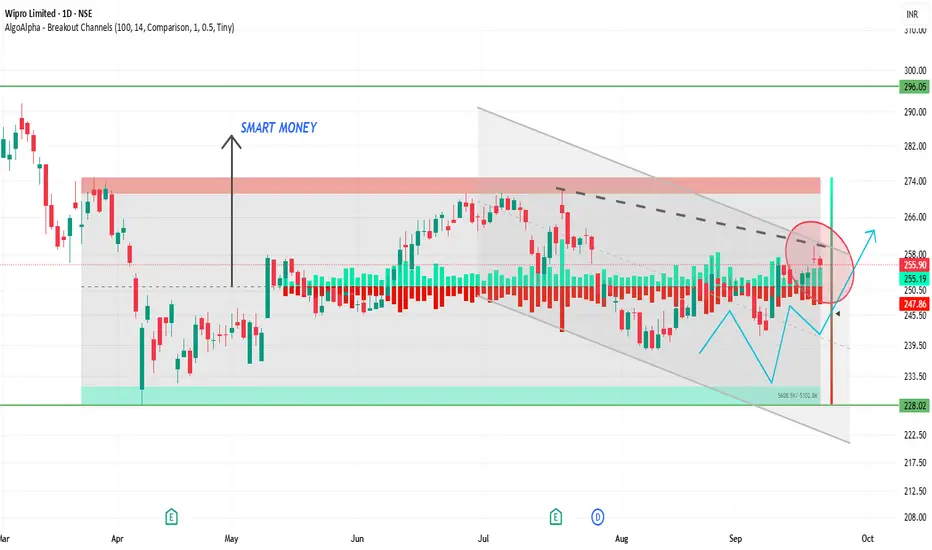
Wipro clean breakoutWipro 258 has given a clean breakout. Target 278
Volume increase with Price shows strength.
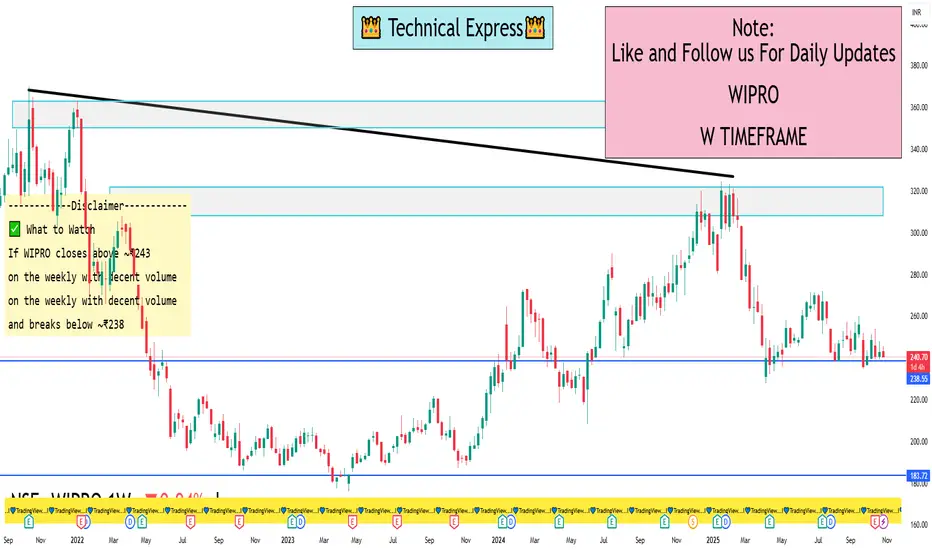
WIPRO Bullish Pattern - Falling Wedge - Short TermWipro is gearing up for a bullish movement if it can break the upper trendline. Probably will be a pull back to below trendline before triggering the breakout.

View On Wipro (Bullish For Next 6 Months)## Wipro Limited
breakdown of Wipro’s business model — **how it creates value**, **how it delivers it**, and **how it earns money** — along with some of the strategic shifts it’s making.
---
### 1. What Wipro does & value proposition
* Wipro offers **IT services**, **consulting**, **engineering & R&D services**, and **business process outsourcing (BPO)**. ( )
* It positions itself as a partner for clients undergoing digital transformation: cloud migration, enterprise modernization, application services, data & AI, IoT/embedded engineering, etc. ( )
* Wipro has adopted frameworks like its “4M delivery framework” (Model, Machinery, Man, Metrics) to help clients with managed services, operational efficiency, cost optimization.
* In essence: help organizations become “future-ready” by leveraging technology, improving operations, enabling new business models. ( )
---
### 2. How Wipro organizes itself (key segments / business lines)
* As of 2023, Wipro restructured its business into **four strategic global business lines (GBLs)** to align better with client needs and growth areas.
The four business lines are:
1. **Wipro FullStride Cloud** – full-stack cloud services: cloud native apps, architecture, migration. ( )
2. **Wipro Enterprise Futuring** – large-scale enterprise transformation: data/insights, applications, digital operations, cybersecurity. ( )
3. **Wipro Engineering Edge** – engineering, R&D, embedded systems, IoT, product engineering. ( )
4. **Wipro Consulting** – strategy consulting, business advisory, domain consulting (including acquisitions like Capco, Designit). ( )
* The idea: simplify, sharpen focus, deliver “One Wipro” across these lines rather than a more fragmented structure. ( )
* Geographically and across industries, Wipro serves clients globally in many sectors: finance, healthcare, manufacturing, retail, telecom. ( )
---
### 3. Revenue streams & how it monetises
* Main revenue source: IT services (outsourcing, system integration, application services, etc.). ( )
* Other streams: Consulting/advisory services; Engineering & R&D; Business process services; some product/licensing revenue but smaller. ( )
* Pricing / monetization approach:
* For large transformation/consulting … value-based or outcome-oriented models.
* For outsourcing/BPO … often contractually fixed or variable based on services delivered.
* Also, usage-based / subscription elements likely in cloud/digital offerings (though detailed public data is limited).
* According to one case-study summary: ~60% of revenue from IT services, ~30% from consulting/outsourcing, ~10% from products/licences. ( )
* Wipro emphasises cost-effectiveness, scalability for clients — enabling them to improve operations while Wipro earns through long-term engagement.
---
### 4. Key resources & activities
* **People/talent**: large global workforce; engineering talent, domain experts, consultants.
* **Technology/IP**: Platforms and frameworks (ex: 4M delivery), innovation labs, R&D capabilities.
* **Global delivery model**: Offshore/on-shore mix, global delivery centers', partnerships with clients across geographies.
* **Domain and industry expertise**: Being able to serve specific industries (healthcare, manufacturing, telecom, etc) adds value.
* **Partnerships/ecosystem**: Cloud providers, tech partners, co-innovation with clients.
* **Brand/reputation**: As a large and established IT services player from India, global presence.
---
### 5. Cost structure & profit drivers
* Major cost buckets: Employee costs (high), delivery infrastructure, training/upskilling, technology & tools, global delivery centers.
* Profitability drivers:
* Utilisation of staff (keeping billable rates high).
* Mix of high-margin services (consulting, transformation) vs lower-margin ones (basic outsourcing).
* Automation and digitalization in delivery to reduce cost per unit of service (Wipro emphasises frameworks for managed services).
* Strategic focus on higher-growth segments (cloud, engineering, consulting) which often command better margins.
* For example, restructuring into business lines is part of cost/efficiency and margins story.
---
### 6. Strategic challenges & opportunities
**Opportunities:**
* Growing demand for cloud, AI, data analytics, digital engineering, IoT/embedded systems gives Wipro a large addressable market.
* Move from “services only” to more value-added, outcome-based engagements.
* Engineering/R&D services (via Engineering Edge) is a growth area as physical products become more software-driven.
* Global expansion beyond legacy markets (USA) into Europe, Asia, new geographies.
**Challenges:**
* Intense competition from other global IT services firms (both Indian and global).
* Pressure on pricing (outsourcing rates often fall).
* Need to continuously upskill workforce, pivot to newer technologies.
* Client environments are changing: shorter contracts, more flexible models, increased demand for measurable outcomes.
* Margin pressure especially if service mix shifts to lower-margin segments.
---
### 7. Summary of business model in one line
Wipro’s business model is: “Leveraging global talent, delivery infrastructure and domain expertise to provide IT‐services, consulting, engineering and business-process solutions to enterprises, monetised via long-term contracts, outcome-oriented engagements and scalable delivery, while transitioning into higher-margin growth segments like cloud, data/AI and engineering services.”
---
thanks

Wipro Wipro Now Bearish Pattern ABCD.. So follow this pattern right now, Pattern cnfm B Bellow Close
Stoploss C Above close.
Bullish pattern cnfm Butterfly pattern B (258) break above only

WIPRO 1D Time frameCurrent Price: WIPRO is trading near the 520 – 525 zone (recent levels).
Current Trend: Stock is moving sideways after a sharp move earlier, showing consolidation.
Support Zone: Strong support at 510 – 515. Buyers likely to defend this area.
Resistance Zone: Key resistance around 530 – 535. A breakout above 535 can lead to upward momentum.
Indicators: Daily candles indicate indecision; volumes are stable, showing accumulation at lower levels.
Outlook:
Above 535 → bullish momentum possible toward 550+.
Below 510 → weakness may extend toward 495.
👉 In short:
Range: 510 – 535.
Neutral to bullish tone if it breaks above resistance.
WIPRO 1D Time frameCurrent Price
₹251.50
🔹 Market Snapshot
Day’s Range: ₹249.60 – ₹251.79
Previous Close: ₹251.94
52-Week Range: ₹228.00 – ₹324.60
Market Cap: ₹2.64 lakh crore
P/E Ratio (TTM): 19.53
P/B Ratio: 3.20
Dividend Yield: 2.39%
Book Value per Share: ₹78.57
EPS (TTM): ₹12.84
WIPRO 1D Time frameCurrent Price & Trend
Price: ₹251.95
Trend: Neutral; trading approximately 22.5% below its 52-week high of ₹324.60, reached on July 2, 2025.
Momentum: Indicators suggest a neutral to slightly bearish outlook.
Bullish Scenario
Breakout Above ₹257: A sustained move above ₹257 could target ₹265 – ₹270 in the short term.
WIPRO 1D Time frame📊 Current Status
Price around ₹252–₹255
Showing recovery from recent support
🔑 Key Levels
Support: ₹242 → ₹240 → ₹230
Resistance: ₹255 → ₹260 → ₹265
✅ Outlook
If WIPRO sustains above ₹255–₹260, more upside is possible. Falling below ₹240 may push price back toward ₹230.
WIPRO 1D Time frame🔢 Current Level
Trading around ₹252.91
🔑 Key Resistance & Support Levels
Resistance Zones:
₹254.00 – ₹255.00 (recent highs; breakout above this may lead to further upside)
₹260.00 – ₹262.00 (stronger resistance above)
Support Zones:
₹250.00 – ₹251.00 (immediate support; failure to hold above this may lead to a decline)
₹245.00 – ₹246.00 (short-term support; a break below this could indicate weakness)
₹240.00 – ₹242.00 (deeper support zone if price dips further)
📉 Outlook
Bullish Scenario: If Wipro holds above ₹251.00, upward momentum may continue. Break above ₹255.00 can open the way toward ₹260.00+.
Bearish Scenario: If it falls below ₹245.00, risk increases toward ₹240.00 – ₹242.00.
Neutral / Range: Between ₹251.00 – ₹255.00, Wipro may consolidate before a directional move.
WIPRO 1D Time framw📈 Price Action
Previous Close: ₹255.75
Today's Close: ₹256.50
Daily Range: ₹253.00 – ₹257.00
Volume: 804,499 shares (significantly higher than the 50-day average of 369,496 shares)
52-Week Range: ₹228.00 – ₹324.55
🔧 Technical Indicators
Relative Strength Index (RSI): 63.59 — Indicates bullish momentum.
MACD: Positive — Suggests upward trend.
Moving Averages:
5-day MA: ₹254.50
50-day MA: ₹249.00
200-day MA: ₹265.00
Trend: Bullish, as the stock is trading above short-term moving averages.
Stochastic Oscillator: 76.47% — Indicates overbought conditions, suggesting potential for a pullback.
Average True Range (ATR): ₹0.05 — Indicates low volatility.
📊 Support & Resistance Levels
Immediate Support: ₹253.00
Immediate Resistance: ₹257.00
Pivot Point: ₹255.00
🧠 Trend Analysis
Trend: Bullish
Momentum: Positive
Volatility: Low
Summary: Wipro's stock is exhibiting a bullish trend with positive momentum. The current overbought condition, as indicated by the stochastic oscillator, suggests that the stock may experience a short-term pullback before continuing its upward trajectory. Traders should monitor the support and resistance levels for potential entry and exit points.

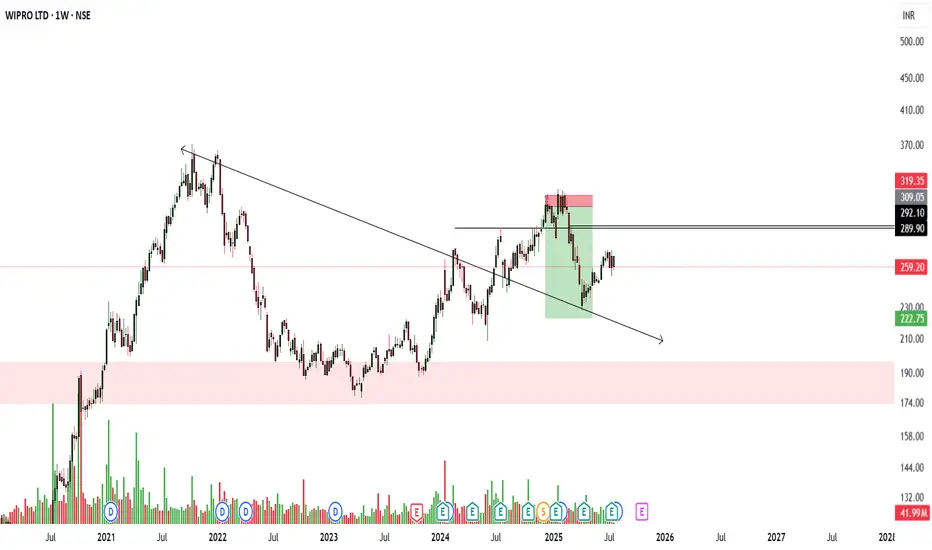
Wipro: Covid Trendline + 200W MA Enough for Breakout?After topping at ₹369.90 in 2021, Wipro corrected for nearly three years through a W–X–Y structure. The decline finally found support around ₹187.52 along the Covid-low trendline, where a fresh impulsive-looking rally started.
The first leg from that low advanced in five waves, peaking near ₹320. What followed was an expanded flat correction — Wave B overshot the prior high at ₹320, and Wave C terminated at ₹228. This aligns well with the textbook characteristics of an expanded flat.
That ₹228 level now stands as the key support and invalidation marker . Price has since rebounded, and the structure suggests the early stages of Wave C/3 .
Support / SL: ₹228 (below this, the bullish count breaks down)
Target zone: Above ₹320, with potential to extend further if momentum builds
Technical confluence: Covid-low trendline support + 200-week MA + completed corrective structure + impulsive rally foundation
The setup looks constructive, but confirmation comes only with sustained strength above 271–289 . Until then, keep alternate counts in mind.
Disclaimer: This analysis is for educational purposes only and does not constitute investment advice. Please do your own research (DYOR) before making any trading decisions.

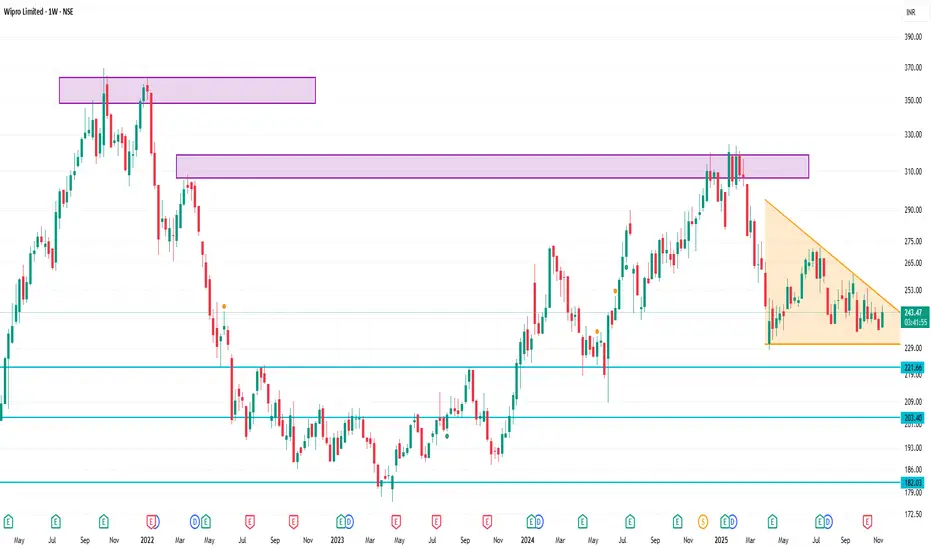
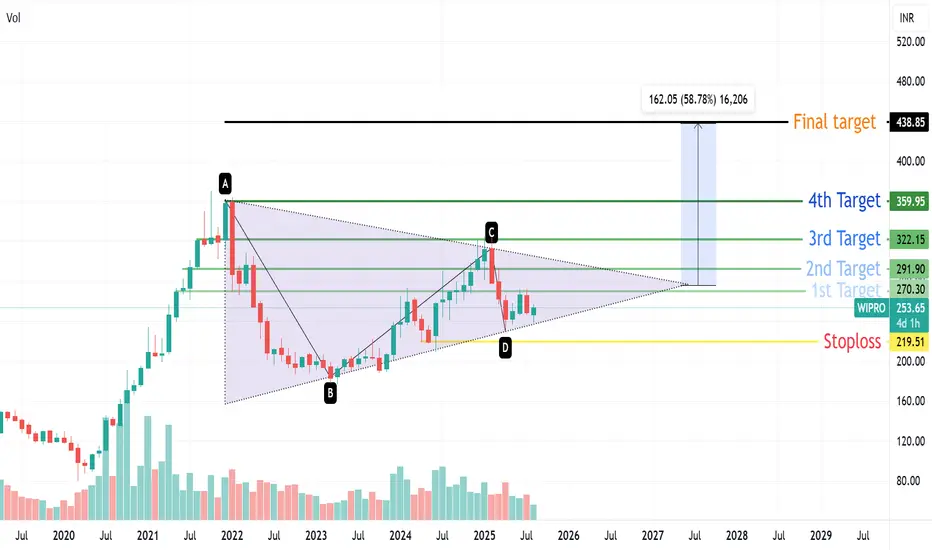
Symmetrical triangle Pattern in Wipro on monthly chartWipro is forming Symmetrical triangle Pattern on monthly chart ,its a consolidation pattern.
If breakout happened final target will be arround 430, keep a stoploss arround 220.Rest short term target mention on chart.
It's not a buy or sell call ...Just for education only.
Wipro Trade ideaWipro 246 is in the last leg of butterfly pattern
According to the pattern the target is expected at 203.
Volume breakout suggests short term trend is positive.
Support is at 244 and resistance at 252.

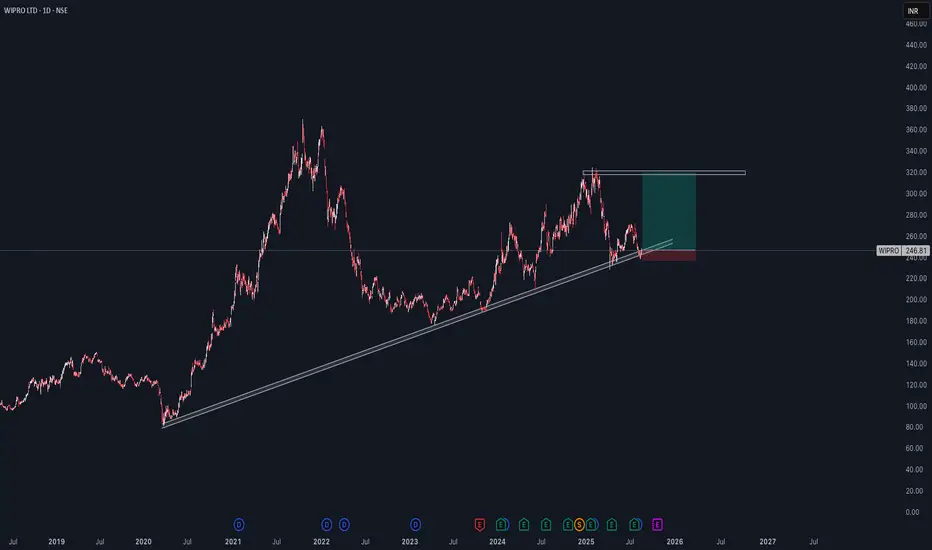
Wipro – Long Setup from Trendline Support Wipro has been respecting a long-term trendline since 2020.
Price recently bounced from this trendline support near ₹240, showing strong buying interest.
The current structure suggests a possible trend continuation towards the higher resistance zone.
Trade Setup
Entry Zone: Around ₹245–250 (near trendline support)
Stop Loss: Below ₹230 (trendline breakdown level)
Target: ₹320 (previous supply zone / resistance level)
This gives a risk-to-reward ratio of approx. 1:3, which is favorable.
🔍 Technical Factors Supporting Bullish View
Price is consolidating above the long-term support trendline.
Multiple rejections from the downside show strong demand zone near ₹240.
If the momentum continues, buyers may push price towards the ₹320 resistance area.
⚠️ Risk Management
A daily close below ₹230 will invalidate this setup.
This is a positional swing trade, so patience is required.
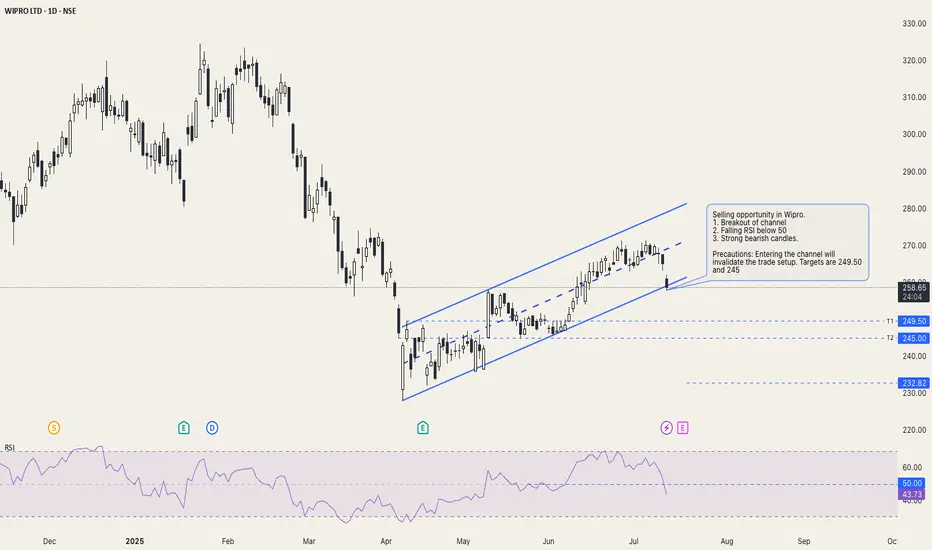
Channel breakout in Wipro: BearishSelling opportunity in Wipro.
1. Breakout of channel
2. Falling RSI below 50
3. Strong bearish candles.
Precautions: Entering the channel will invalidate the trade setup. Targets are 249.50 and 245
(ignore the 232 line)
If it comes down to support then it might boomIt has strong support from where it might bounce back up
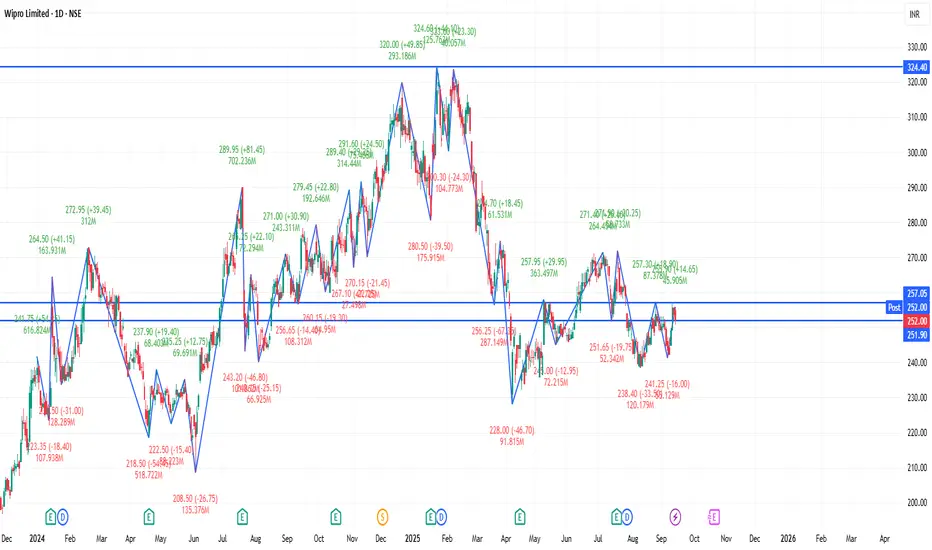
Wipro BearishWipro 242 is giving bearish pattern with breakdown at 250. We expect Wipro will drop to 232 in coming days.

Will Wipro Bounce Back !?💸 Dividend Insight:
Wipro has announced an upcoming dividend, which may bring short-term interest. However, buying just for dividends during a downtrend can be risky.
📊 Technical Summary:
Resistance: ₹290–₹319
Support: ₹222, major at ₹190
Dividend: Watch out for announcement dates & record day
🔔 Pro Tip: Wait for price action near key zones before entering. Don't chase just for dividends if the structure is weak.
💬 Tell us below – are you eyeing Wipro for the dividend or waiting for a better entry?
Wipro bearishWipro 270 is showing weakness in chart with Bearish Volume increase with price move high.
Daily and intraday PCR around 0.74 suggests active call writing.
Fair Value gap is at 250-251. We expect Wipro will return to it FVG before continuing its trend.

Wipro Is Still Strong Why ? Wipro is Still Strong Bcz price Is Attract VWAP
This Is An Opportunity to Buy
& There Is No Reason To Fear