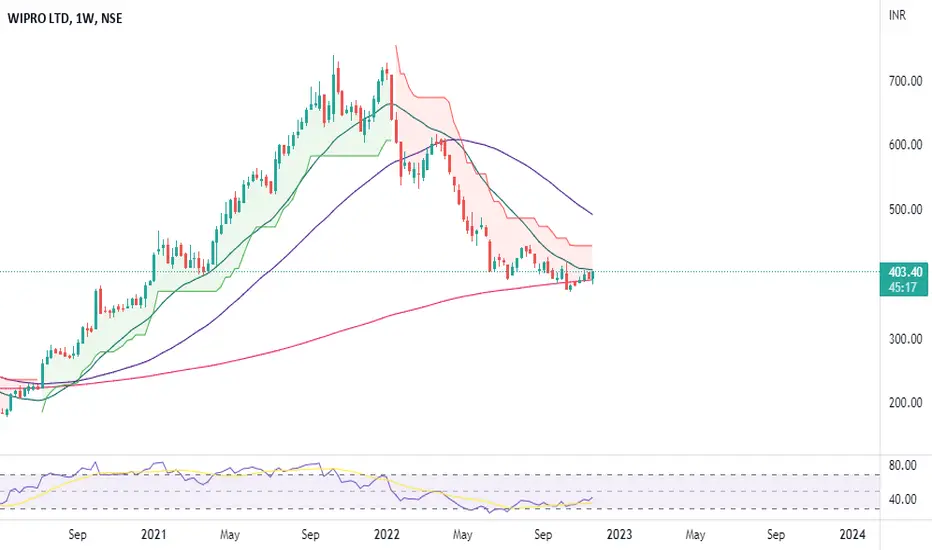
Wipro Head & Shoulders PatternsWipro is forming Head & Shoulders Patterns on weekly charts.
Resistance breakout
IT Index in Bullish Trend
Trade ideas

WIPRO | Investment Pick📊 Details
Wipro Ltd is a global Information technology, consulting and business process services (BPS) company.
Disclaimer: This analysis is solely for educational purposes and does not make me a SEBI registered analyst.
If you found this analysis helpful, I encourage you to like and share it. Your observations and comments are also welcomed below. Your support, likes, follows, and comments motivate me to consistently share valuable insights with you.
🔍 More Analysis & Trade Setups 🔍
For more technical analysis and trade setups, make sure to follow me on TradingView: www.tradingview.com

Wipro Stock long time investment 6 to 12 monthHi every one wipro
buy for mutual fund
SIP
wipro and ITNIFTY is bullish
I am heer to help you

WIPRO LONG TERM INVESTING OPPORTUNITYBullish on Wipro for the long term coz:
1. Rounding Bottom Pattern in Weekly TF.
2. Crossing 200 dema
3. Breaking 10-month-old resistance 2nd time in a daily timeframe with an increase in volume and holding on
4. Trend: UP Trend in daily pattern; making HHs and HLs over daily TF trendline
**BUY @ 417
**SL @ 395.75
**TGT 1 @ 610
**TGT2 @ 720
**Holding Period is approx 1 yr
**RR:13
**Growth Potential 72%
** Note: In rounding bottom pattern, speedy growth happens in the later phase, do not exit early. You can trail your SL but not very tightly as rounding bottom pattern may give deep pullbacks that may through you out of the trade.

Consolidated a Lot - Showing Bullish reversal signs now!The stock is making higher lows and volumes are picking up.
One can buy above 426 level for intraday 0.7-1% move and carry positional on day closing basis for first target 443. This is a strong resistance zone. Once this is broken next targets would be 460 and 475.
RSI also shows a bullish divergence.
Learn & Earn,
Dr. Tanya Kumar

Trend Reversal in Wipro1. Wipro recently broke the Bearish Trendline.
2. After that Stock is Forming "Higher Highs" and "Higher Low" indicating Bullish trend.
3. Momentum is also supporting the Trend as per MACD.
4. Recent price action shows Volatility Squeeze by formation of Pennant.
5. Buy Trade can be initiated with stop loss of 400.

Bullish Alert !!Exciting Bullish Pattern Alert!
📊 Pattern: Rising Channel
📌 Symbol/Asset: Wipro
🔍 Description: Stock near support level.
👉 Remember: Technical patterns are just one piece of the puzzle. Consider conducting further research, consulting with a financial advisor, and managing your risks appropriately.

Wipro- Looks to get back on track.Buy between- 400-410
Keeping SL- 395 on closing basis.
Target- 423, 432, 440.
Note- Only for educational purposes.

At important junctureThe level today seems like a possible high resistance area. A rejection & a break down from here could lead to a lower levels.
But a break out from here could again catapult to higher ranges.


BullishAfter strong consolidation in that region if region breaks in upcoming days wipro stock is sees at 600-700 levels so consider this region as strong supporting region and invest money for long-terms

Wipro Consolidation Phase Conditional BuyThe stock has been consolidating for a while and the RSI is moving up on a weekly time frame
If you look at the Support levels its hovering around 200day EMA
Aim for Buying either breaking out of the box range or retesting those levels again
Target 1 520
Target 2 626
Stop Loss 350s

WIPRO reversal ideaWIPRO may reverse from weekly 200MA
looking good cmp 403 with SL of 380 for target of 422/444 short term
WIPRO: Forming Reversed Head & Shoulder PatternWipro is forming a reversed Head & Shoulder Pattern.
#Current Price - 414
#Breakout Price - 425
#Expected Target - 495
#Resistance Based Targets
- Target 1 - 443
- Target 2 - 481
#Support Based Targets
- Target 1 - 414
- Target 2 - 399 (Stop Loss)
Pattern is forming on daily chart.
Disclaimer:
This idea is only for education purpose, Please consult your financial advisor.
I am not SEBI registered.
Please give a Like if you like.


WiproWipro is in consolidation phase since June-22 but now its trying to come out with an inverse H&S pattern on weekly time frame. RSI is also in sync with price action so may be we can see 500 level. The content provided is for educational and informational purposes only.

[Basket] Wipro Buy IdeaNote -
One of the best forms of Price Action is to not try to predict at all. Instead of that, ACT on the price. So, this chart tells at "where" to act in "what direction. Unless it triggers, like, let's say the candle doesn't break the level which says "Buy if it breaks", You should not buy at all.
=======
I use shorthands for my trades.
"Positional" - means You can carry these positions and I do not see sharp volatility ahead. (I tally upcoming events and many small kinds of stuff to my own tiny capacity.)
"Intraday" -means You must close this position at any cost by the end of the day.
"Theta" , "Bounce" , "3BB" or "Entropy" - My own systems.
=======
I won't personally follow any rules. If I "think" (It is never gut feel. It is always some reason.) the trade is wrong, I may take reverse trade. I may carry forward an intraday position. What is meant here - You shouldn't follow me because I may miss updating. You should follow the system I share.
=======
Like -
Always follow a stop loss.
In the case of Intraday trades, it is mostly the "Day's High".
In the case of Positional trades, it is mostly the previous swings.
I do not use Stop Loss most of the time. But I manage my risk with options as I do most of the trades using derivatives.
=======

WIPRO - Weekly AnalysisIn the Weekly Chart of WIPRO ,
we can see that; after multiple rejection at 410-415 level, it is now ready to take upmove.
resistance has become weak.
Expected momentum is shown in chart.

Wipro Analysis#Wipro is facing resistance between 410-425 once crosses these levels with conviction then can ride to 440/485/500/550 in long term.

Wipro Inverted Head and Shoulder Breakout (Daily)Wipro Technical Analysis - Potential Inverted Head and Shoulder Breakout (Daily)
Pattern Observation:
The daily chart of Wipro (Ticker: WIPRO) shows the formation of an inverted head and shoulders pattern. This pattern suggests a potential bullish reversal from the existing downtrend.
Key Points:
Inverted Head and Shoulders Breakout:
1. An inverted head and shoulders pattern has formed on the daily chart.
2. This pattern includes a left shoulder, head, and right shoulder.
3. The neckline, formed by connecting the highs of the shoulders, serves as a resistance-turned-support level.
4. A breakout above the neckline is a significant bullish signal, indicating potential upward movement.
Higher Lows:
Notably, the recent price action is characterized by creating higher lows.
Higher lows can suggest increasing buying interest and a potential shift in sentiment.
Fake Breakout and Fresh Buying:
A prior resistance level might have seen a fake breakout attempt.
The subsequent fresh buying interest near this resistance-turned-support level is indicative of increased demand.
Such behavior often signifies strong conviction among buyers.
Potential Strategy:
Considering the technical aspects observed:
1. Traders and investors could consider a long (buy) position in Wipro, subject to their risk tolerance and investment horizon.
2. An entry could be sought on a pullback toward the neckline support (previous resistance) after the breakout.
3. Use a suitable stop-loss strategy to manage risk, placing it below the neckline to guard against potential false breakouts.
Important Considerations:
Technical patterns are not foolproof guarantees and should be considered alongside fundamental analysis and broader market trends.
Risk management is crucial. Determine an appropriate position size based on your risk tolerance.
Stay updated with company news and market developments that could impact the stock's movement.
Remember, individual investment decisions should always be based on a comprehensive understanding of the market, including technical, fundamental, and sentiment analysis, as well as your personal financial situation and risk appetite.
I am not a SEBI registered analyst, this analysis is only for educational purpose

Wipro possible Cup and Handle in formation ..Would need to wait for another month for confirmation, but good time to start accumulating in small quantities.

Wipro analysis This is only for education purpose only. I am not SEBI register. This equity scrip is subject to market risk. Please check your own analysis before you take a trade.

WIPRO Hourly Chart suggest 9% upsideWIPRO Hourly Chart suggest 9% upside in 20-30 days
LTP 407
SL 398
Target - 425 / 440+
Timeframe - 20-30 days
