WIPRO LONG VIEWI am people I am looking to buy a side above 410, In a one-day time frame inverted h&s making also near 200ema, consolidation near EMA so the potential is for buying long.
Trade ideas

Wipro making bullish head and shoulder patternWipro making bullish head and shoulder pattern in day time frame.
wait for neckline breakout then take entry... target 1st resistance, 2nd resistance and so on... and stoploss will be last swing low.

WIPRO - Weekly AnalysisIn the Weekly Chart of WIPRO ,
we can see that; after continuous selling, we saw a W shape recovery at bottom.
Also it has taken its support and shown an up move..
Also, it has respected the cross Trendline multiple times.
Let it create a Halt or Red candle next week, then we can enter with SL and Target.

buy wipro and holdgood opportunity to invest now and hold till 550 . at fib level will see a trend change

wipro its in a middle of breakout or breakdown
chart overall bearish however a bounce shouldnt be ruled out
Wipro bullish reversal patternWipro on 1H time frame
Respected Support ✅
Retest ✅
Pattern on 1H : Bullish Harami completed (2 candles)
0.10 points away from completing bullish pattern 'Three inside up' (3 candles)
ENTRY : At CMP
Target: 387 - 390 (short term)
Disclaimer:
I'm not a registered financial advisor.
All information found here is for educational purposes only and should not be construed as personal investment advice.
Conduct your own due diligence, or consult a licensed financial advisor or broker before making any and all investment decisions. Any investments, trades, speculations, or decisions made on the basis of any information found on this published idea, expressed or implied herein, are committed at your own risk, financial or otherwise.

WIPRO @ 379IT: WIPRO @ 381.30 | 17-JUN-2023
Sector: IT Services & Consulting
BETA: 1.04
FACE VALUE: 2
DIVIDEND YIELD: 0.26
BOOK VALUE: 119.39
SUP: 346
As long as this support holds, we can see 600/700/1000+

Wipro- Head n Shoulder breakdown - 3% downside potentialWipro has formed Head and Shoulder pattern and given breakdown at the trendline support around 396 with good volumes.
Target: 385-382 levels.
SL: Hrly candle close above 398

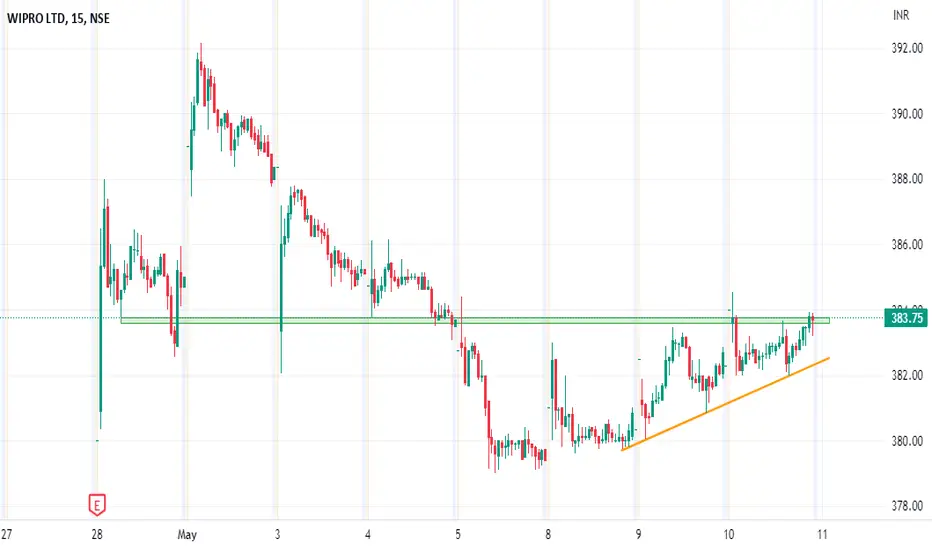
WIPRO 15MINAFTER TAKING STRONG SUPPORT WIPRO GOING UPWARD..
WIPRO Looking good for upside..
When it break level 383 and sustain.. it will go upside...
BUY @ 383
Target
1st 386
2nd 392
Enjoy trading traders.. Keep add this STOCK in your watch list..
Investor are welcome..


@Wipro bullWipro once it breakout the resistance then target is 426.55 and next target is 445.
buyer and seller are aggressive at resistance level but this time it will break the resistance level......

Trend Reversal - WiproWipro is seen may have turned the downside trend now and is bouncing back and stock has turned positive in super trend also so one can look to buy stock for 450 levels where stock has announced buy back with a stoploss of 373
PS - THIS IS JUST FOR EDUCATIONAL PURPOSE AND ONE SHOULD CONSULT ITS OWN ADVISOR BEFORE TRADING AND SHOULD TRADE ON ITS OWN RISK

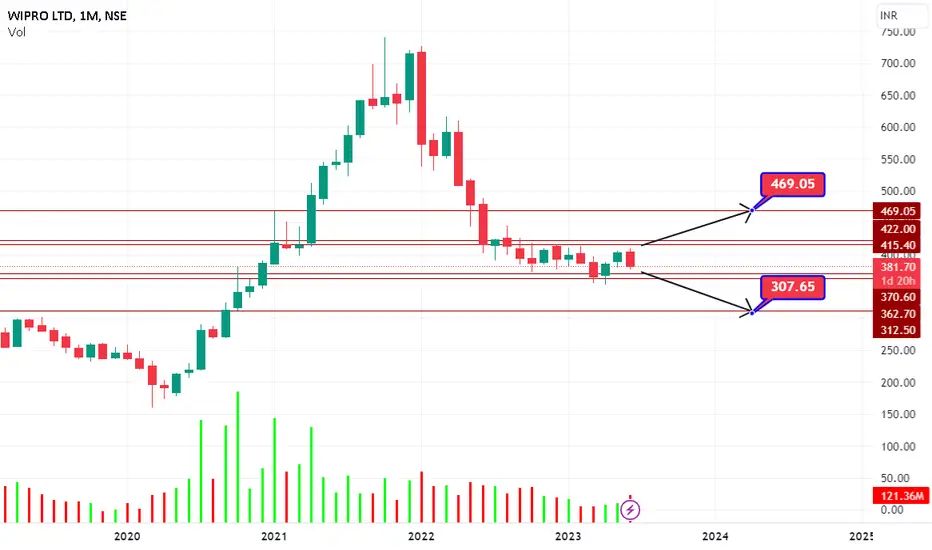
#Wipro cash : Looks good above 412.10#Wipro cash
04.06.2023
old call given at 390-392 tgt was 408-412
Found resistance
Fresh call -
Buy above 412.10
Stoploss 390
Tgt 438-440/470
Cmp 405

Bullish flag pattern breakout in WIPROWIPRO
Key highlights: 💡⚡
✅On 1 Hour Time Frame Stock Showing Breakout of Bullish flag Pattern .
✅ Strong Bullish Candlestick Form on this timeframe.
✅It can give movement up to the Breakout target of 420+.
✅Can Go short in this stock by placing a stop loss below 395-.

WIPROCharts shows that something positive is going on in the company. It can be looked into for long term but surely with previous month low as SL and that is aroung 379

Wipro Smart Buy Wipro In the weekly time frame is on last week's brake flowing wage pattern.
this week it was breaking it with the ( High Volume +15.50 ) this is a very positive sign for Entry on the Wipro
.
.
CONDITION ONE - Price will hit 443price after that the next target is 495price is the 2nd Target If the buyers are taking more interest in it Or Wipro's more positive News is also helping to push the price to the Next level AND upcoming next week's price will take a Headly retest 392price level zone after that it will More volume bullish and hit August high.
CONDITION TWO - Price will go up for some time and after that, all buyers enter the market after that seller volume is coming and trap all the buyers who already enter the market seller can hit all the buyers stop loss, and push the price down.
So, it is a good time to Enter the Wipro But this is up to you what type of trader and Investor you are
ACCORDING TO ME - I will take the position you see on the Chart and I also give you my SL and TP

History Repeats for wiproLooking at similar pattern in 2001 , It is repeating now in 2023.
So this can take a while to hit the ATH , so its really tough time for investor for who bought at high price. but as the inflation is high and considering the % of Breakout the consolidation range can be shorten then the previous pattern. So in upcoming days if the trend line is broken it can go up to 300 in worst case even below that. and can consolidate with in a range.

WIPRO - SHORT- 1D - Channel PatternWipro is currently on a Downtrend for over a year now. The IT sector overall looks bearish and on Wipro, you can spot a beautiful channel pattern forming and price-making lower Highs.
It has a roughly 1:3 RW Ratio.
Entry - (382-384)
SL - 390
Tar - 360

WIPRO SELL ONLYWIPRO Wait for supprot to break and retest after pull back go short.
FOLLOW ME FOR MORE TRADING SIGNALS😊

Wipro First 5 Waves rise from bottomWipro has clean 5 wave rise we can expect minimum 422-448 in next leg up risk reward is very good for this trade.

#Wipro cash : Tech stocks looking good for upside#Wipro cash
22.05.2023
Looks good at 390-392
Stoploss 380
Tgt 408-412
Strong breakout once close above 412 levels
Cmp 395.75

#WIPRO AnalysisStock is trading near downward channel BO, keep watch BO level for entry, IT stocks are moving well with strong NASDAQ sentiment.

WIPRO - #intraday Chart Analysis || 11th May,2023 #stocksAnalysis Criteria Used:
1. Please find the Chart Analysis done for the Intraday Trade Idea levels for 11th May, 2023
2. The analysis for the Trade ideas, has been done based on Trend analysis and Chart Patterns with Volume Buildups
Focus On:
1. Always keeping your Risk Management in play
2. Using a Stop Loss; because it is your Best Friend
3. Always Plan your Trade and stick to your Plan
4. Dont overthink or overanalyse
5. Treat this as your Business and get serious about it
#sharemarket #stockmarket #nifty #sensex #investing #trading #nse #bse #stockmarketindia #stocks #indianstockmarket #investment #stockmarketnews #banknifty #finance #money #intraday #intradaytrading #investor #niftyfifty #dalalstreet #sharemarketindia #sharemarketnews #stockmarketinvesting #business #sharemarkettips #stock #india #indiansharemarket #rakeshjhunjhunwala #bhfyp #mumbai #share #wealth #investment #market #invest #trading #investing #finance #FinancialFreedom #investor #trader #stocks #profit #investors #economy #equity #shares #nifty #stockexchange
DISCLAIMER:
.
* Please do your own research and/or contact your financial advisor before taking any trading opportunities
** We will not be responsible for your profit or loss
*** We are NOT SEBI REGISTERED
______________________
best stocks to buy today
best stocks to buy now
best stocks to buy
best stocks for Intraday tomorrow
best stocks for long term investment
best stocks to buy today india
best stocks for swing trading
swing trading strategies
swing trading beginners
what is swing trading
swing trading stocks
swing trading stock selection
swing trading kya hai
nifty analysis
nifty view
bank nifty analysis
top stocks to buy now
strong stocks
nifty view
nifty prediction
stock market view tomorrow
bank nifty Levels
bank nifty prediction
share news
stock market news
best stocks to buy now
profit booking stocks
multibagger stocks in discount
breakout stocks
best short term stocks
best short term shares
next multibagger stocks