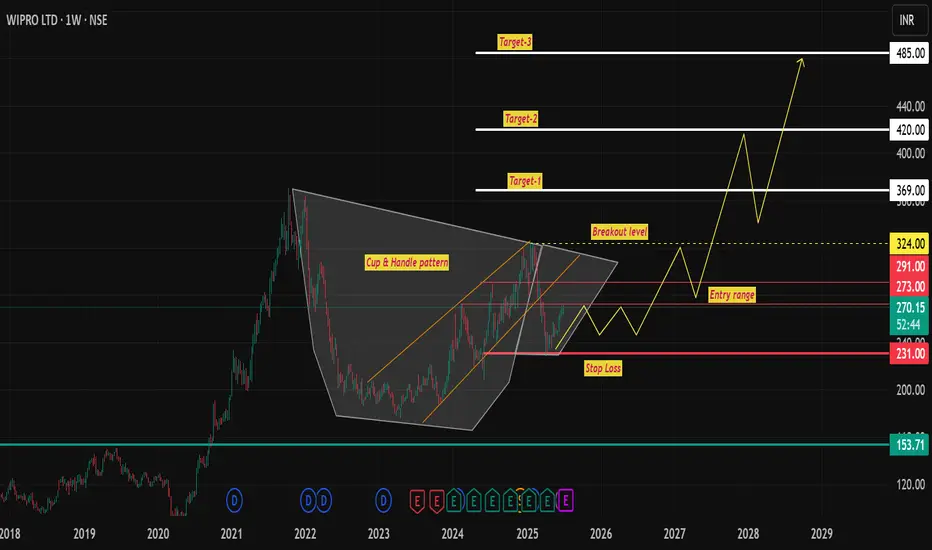
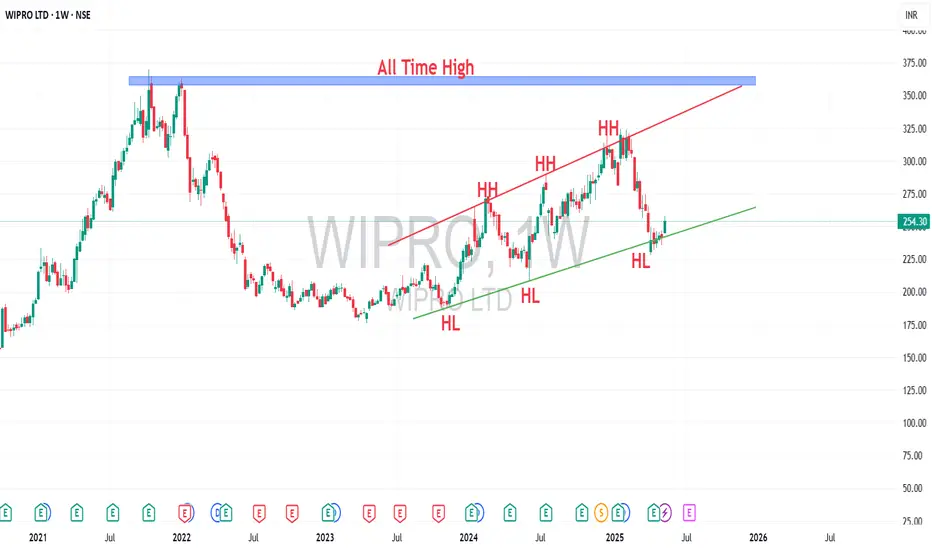
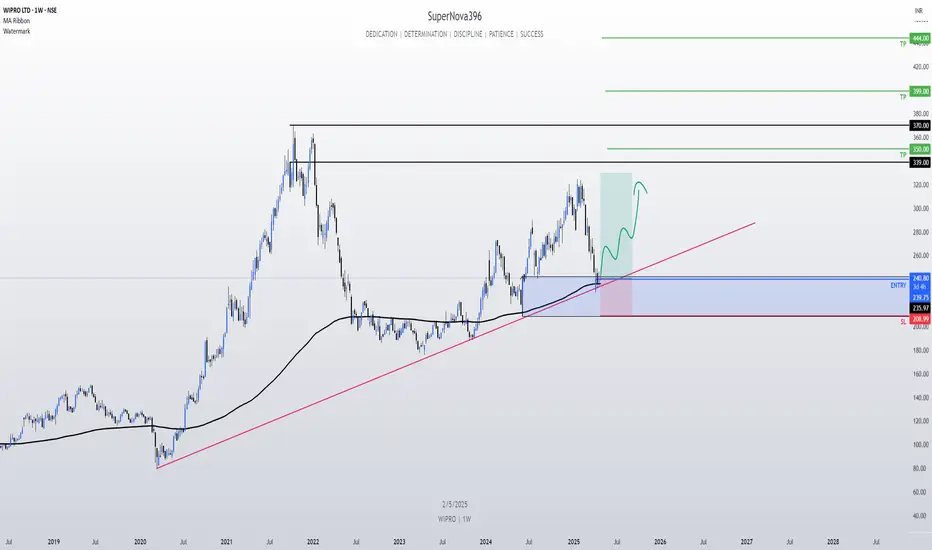
Wipro - Weekly Cup & HandleWipro forming Cup & Handle pattern in weekly time frame. Entry, stop loss Targets mentioned in chart.
Please note: This chart is only for educational purpose, I am not recommending any trades. If your are taking any trades, please do necessary financial assessment before investing/Trading. I am not a certified stock analyst.
Trade ideas
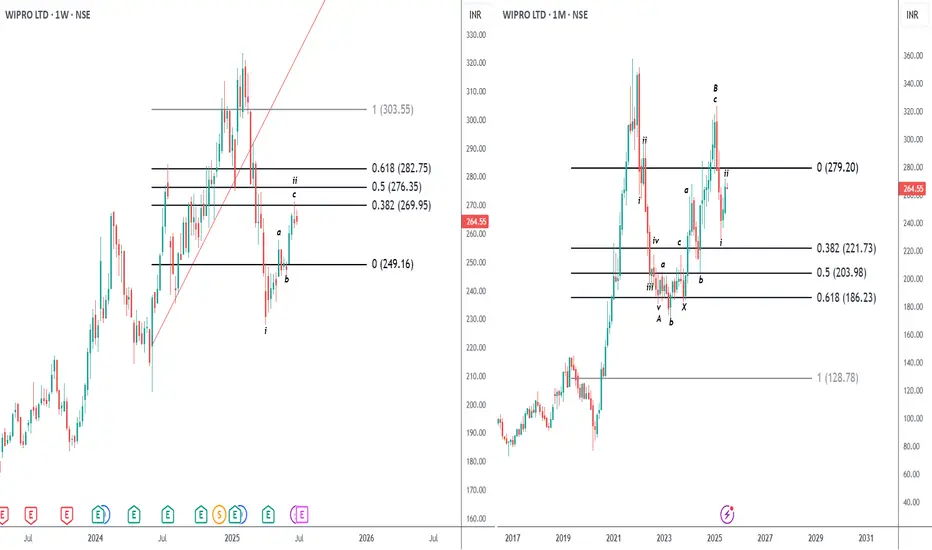
Avoid buying IT stocksWipro CMP - 264.55
Elliott - The rally is the 2nd wave of C and is done. Now the 3rd wave of C will start and will be sharper than the 1st wave. If we take a conservative tgt then 186 is the minimum for 3rd wave and will come in quick time.
Fibs - on the weekly charts the 270 is a strong resistance and hence to me the rally is over.
Conclusion - It seems a bigger correction is coming in IT stocks. Hence avoid fresh buying.
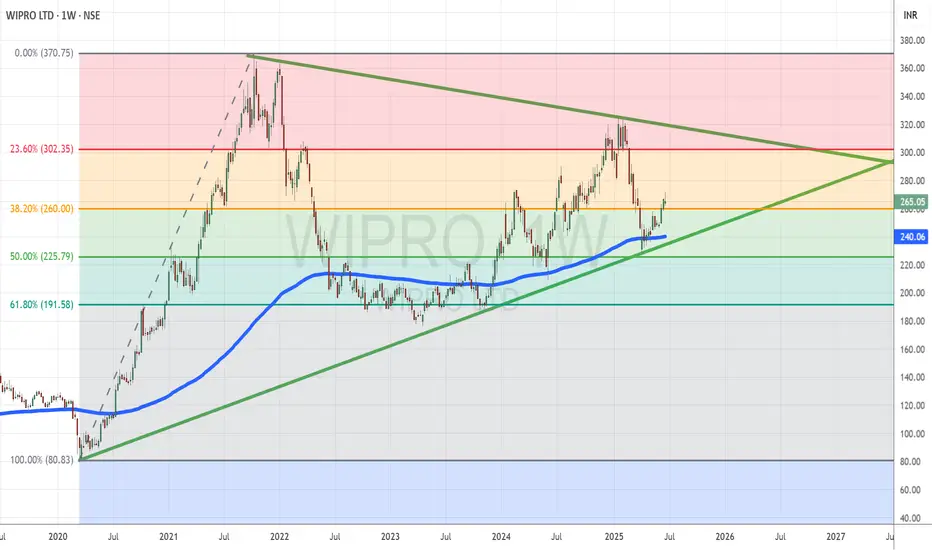
Wipro Trades in a Tight Wedge After Support-Led ReversalTopic Statement:
Wipro, a lagging IT stock, has shown signs of reversal after strong support at the 50% retracement level, with a wedge pattern hinting at a decisive breakout ahead.
Key Points:
* The stock retraced to the 50% Fibonacci level at 225, where it found strong support and reversed
* Price had dipped below the 180-day EMA during the correction, further reinforcing the significance of the support zone
* A wedge pattern is now forming, and a breakout on either side could define the next major move
Wipro Long_WatchlistWIPRO LONG:
Price crossing above 200 Daily EMA
20 Daily EMA crossed above 50 EMA recently
As of now, this stock shall be put in watchlist and
take a decision based on how it performs in the upcoming sessions.

Wipro: Short-Term Trend Shift Likely – Watch for UpsideDescription:
Wipro is forming a potential short-term reversal near a key support zone and price action shows early signs of bullish momentum. A bounce toward the 285 level looks likely if support holds.
Disclaimer:
Not financial advice. Do your own research before trading.
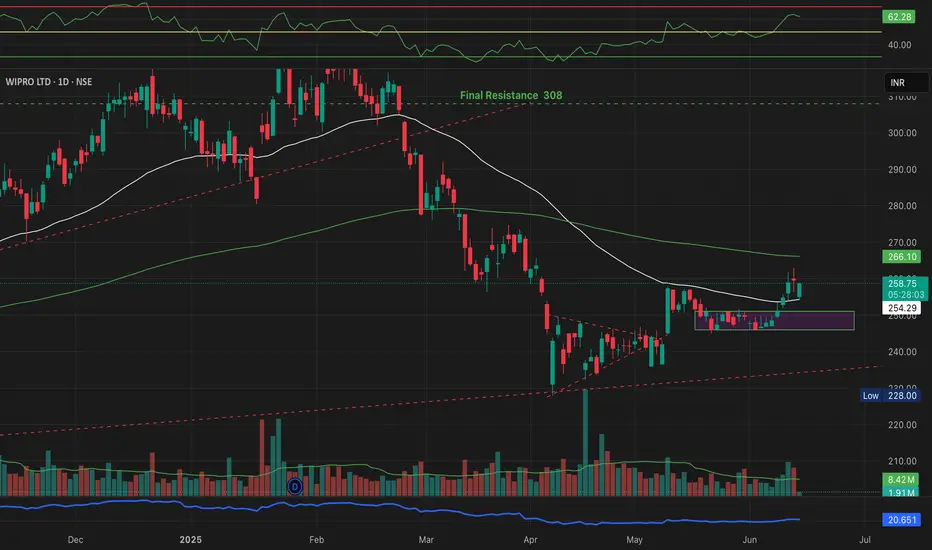
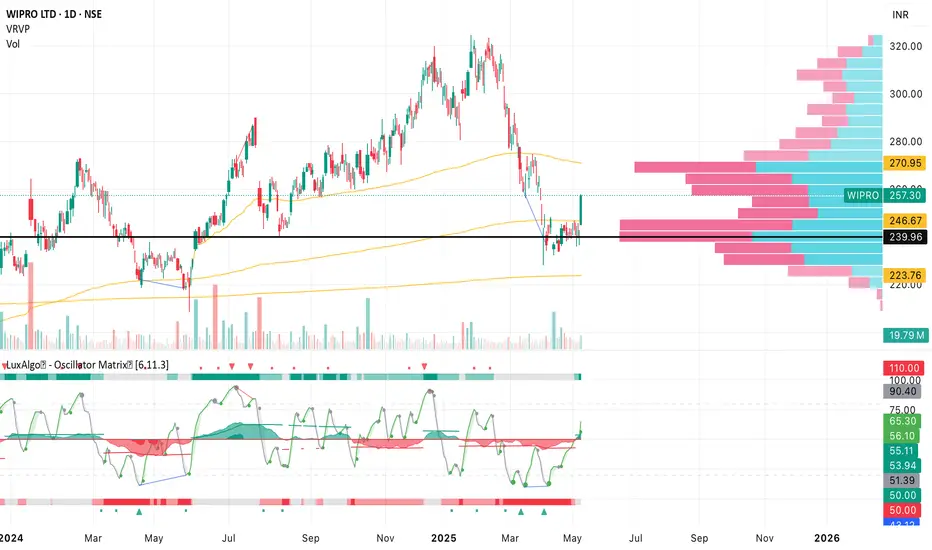
Wipro Ltd – Is the Stock Showing Strength in a Volatile Market?Wipro Ltd (NSE: WIPRO) is currently showing relative strength in a volatile market environment. The stock has taken strong support from the 50 EMA, indicating the bulls are defending key levels.
The recent price action suggests a potential trend continuation pattern, especially since it is holding above the breakout zone.
🔍 RSI is supportive, maintaining above neutral levels — hinting at sustained momentum.
💼 Despite broader market volatility, Wipro’s price structure is stable, and the volume patterns also show participation near key levels.
⸻
🔍 Key Technical Levels:
• 📉 Immediate Support: 254
• 📈 Next Resistance: 266 / 308
• 🔄 Breakout Retest Zone: ~254-256
• ✅ RSI: Above 60 (Strength)
⸻
Analysis By Mayur Jayant Takalikar --For
LEARNING & OBSERVATIONAL USE ONLY.
⚠️ Disclaimer:
I am not a SEBI-registered advisor. This post is purely for educational purposes and should not be treated as financial advice. Please consult a SEBI-registered financial advisor before making any investment decisions.
IT stocks looking attractingAfter a long time, IT stocks has made the base and ready for reversal from their support area, as we can see the daily chart of Wipro, 250 is a strong support area which is being defended from last one month, so one can take position in cas as well as in options also. Infy, TCS, LTIM, LTTS are also looking good for next 6 months.

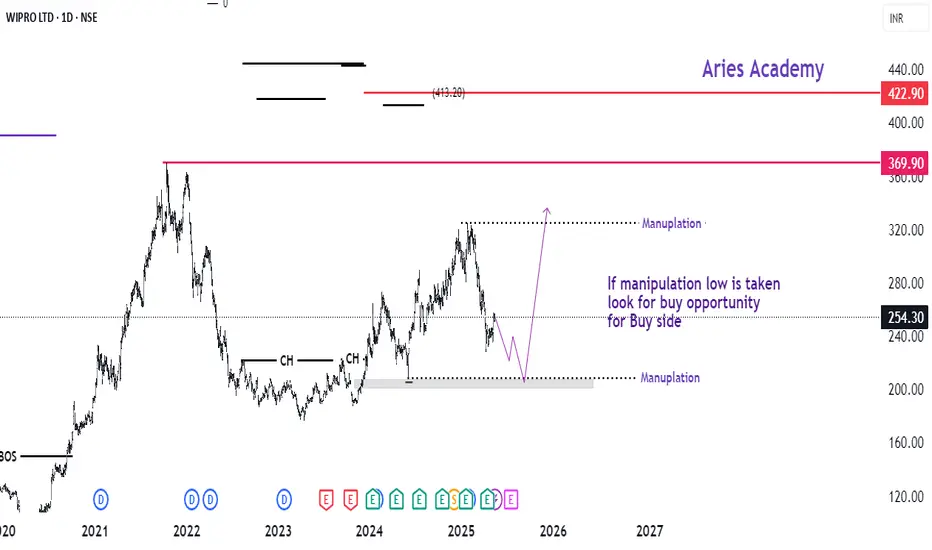
Wipro Buy sideAs per the previous experience, the market will always create some manipulation levels which either one taken if will move fast towards the other side
WIPRO LTD WIPRO LTD
Wipro Stock Analysis - Rebounding with Strong Q4 Performance
Technical Analysis: Building Momentum Towards New Highs
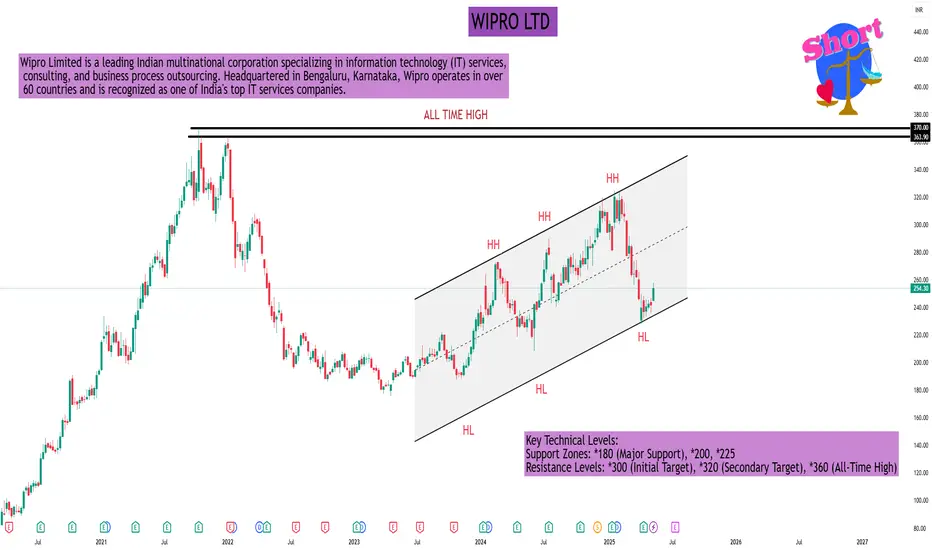
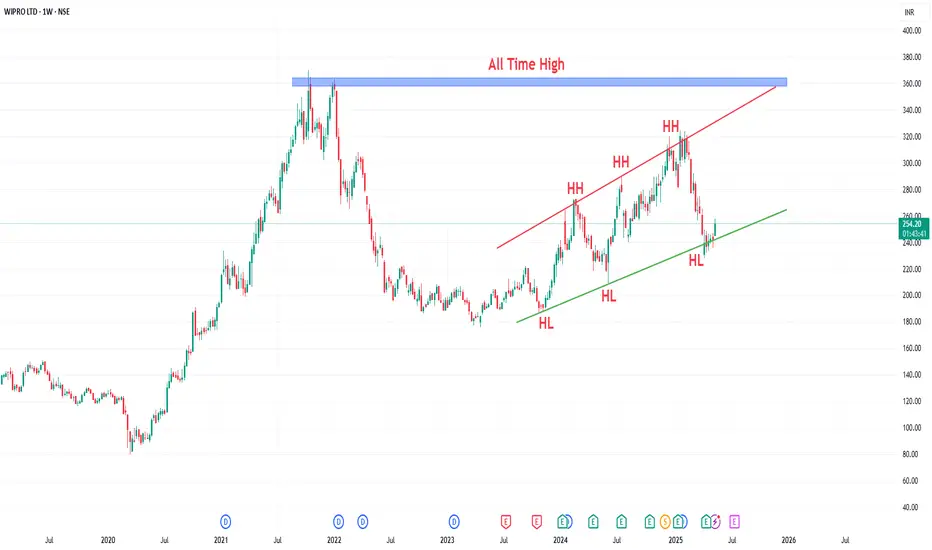
Wipro's stock has demonstrated a significant uptrend since the COVID-19 lows in April 2020, surging from ₹100 to an all-time high of ₹360 by October 2021. Following this peak, the stock underwent a substantial correction, retracing nearly 50% to reach the *180 level. This zone has since acted as a robust support, with the stock forming a series of higher highs and higher lows-a classic bullish pattern.
The recent Q4 FY25 results, announced on April 16, 2025, have further bolstered investor confidence, leading to a positive price movement. Currently trading around *250, the stock is poised to test higher resistance levels.
Key Technical Levels:
Support Zones: *180 (Major Support), *200, *225
Resistance Levels: *300 (Initial Target), *320 (Secondary Target), *360 (All-Time High)
Investors should monitor these levels closely. A sustained move above ₹300 could signal a continuation of the bullish trend, while a breach below *180 may indicate further downside.
Fundamental Analysis: Solid Q4 Performance with Strategic Wins
Wipro's Q4 FY25 results reflect a strong financial performance, with notable improvements across key metrics:
Q4 FY25 Key Financial Highlights:
22,319 Cr in Q3 FY24 and
22,208 Cr in Q4 FY24)
Total Income: *22,504 Cr (vs Total Expenses: *17,880 Cr (vs 17,779 Cr in Q3 FY24 and 17,828 Cr in Q4 FY24) Total Operating Profits: *4,624 Cr (vs ₹4,540 Cr in Q3 FY24 and 4,380 Cr in Q4 FY24)
Profit Before Tax: *4,743 Cr (vs 4,453 Cr in Q3 FY24 and ₹3,862 Cr in Q4 FY24) Profit After Tax: *3,588 Cr (vs ₹3,367 Cr in Q3 FY24 and Diluted Normalized EPS: *3.41 (vs 3.20 in Q3 FY24 and
Additional Insights:
2,858 Cr in Q4 FY24) 2.71 in Q4 FY24)
Net Profit Growth: Achieved a 26% YoY increase in net profit, indicating strong operational efficiency.
Large Deal Wins: Secured $4 billion in deal wins during Q4, including a significant $650 million contract with Phoenix, showcasing robust client acquisition.
Operating Margins: Expanded by 110 basis points YoY, reflecting effective cost management.
Cash Flow: Generated net operating cash flow of nearly $2 billion for FY25, representing 128.3% of net income, underscoring financial stability.
Despite the strong Q4 performance, Wipro has provided a cautious outlook for Q1 FY26, projecting a sequential revenue decline of 1.5% to 3.5%, attributed to macroeconomic uncertainties and client caution.
Reuters
Conclusion
Wipro's robust Q4 FY25 results, marked by significant profit growth and strategic deal wins, have reinforced its market position. The stock's technical setup suggests potential for further upside, provided it maintains key support levels. However, investors should remain vigilant regarding the company's cautious Q1 FY26 outlook and monitor upcoming economic indicators that may impact client spending.
Wipro Stock Analysis – Rebounding with Strong Q4 Performance📊 Technical Analysis: Building Momentum Towards New Highs
Wipro's stock has demonstrated a significant uptrend since the COVID-19 lows in April 2020, surging from ₹100 to an all-time high of ₹360 by October 2021. Following this peak, the stock underwent a substantial correction, retracing nearly 50% to reach the ₹180 level. This zone has since acted as a robust support, with the stock forming a series of higher highs and higher lows— a classic bullish pattern.
The recent Q4 FY25 results, announced on April 16, 2025, have further bolstered investor confidence, leading to a positive price movement. Currently trading around ₹250, the stock is poised to test higher resistance levels.
Key Technical Levels:
Support Zones: ₹180 (Major Support), ₹200, ₹225
Resistance Levels: ₹300 (Initial Target), ₹320 (Secondary Target), ₹360 (All-Time High)
Investors should monitor these levels closely. A sustained move above ₹300 could signal a continuation of the bullish trend, while a breach below ₹180 may indicate further downside.
📊 Fundamental Analysis: Solid Q4 Performance with Strategic Wins
Wipro's Q4 FY25 results reflect a strong financial performance, with notable improvements across key metrics:
Q4 FY25 Key Financial Highlights:
Total Income: ₹22,504 Cr (vs ₹22,319 Cr in Q3 FY24 and ₹22,208 Cr in Q4 FY24)
Total Expenses: ₹17,880 Cr (vs ₹17,779 Cr in Q3 FY24 and ₹17,828 Cr in Q4 FY24)
Total Operating Profits: ₹4,624 Cr (vs ₹4,540 Cr in Q3 FY24 and ₹4,380 Cr in Q4 FY24)
Profit Before Tax: ₹4,743 Cr (vs ₹4,453 Cr in Q3 FY24 and ₹3,862 Cr in Q4 FY24)
Profit After Tax: ₹3,588 Cr (vs ₹3,367 Cr in Q3 FY24 and ₹2,858 Cr in Q4 FY24)
Diluted Normalized EPS: ₹3.41 (vs ₹3.20 in Q3 FY24 and ₹2.71 in Q4 FY24)
Additional Insights:
Net Profit Growth: Achieved a 26% YoY increase in net profit, indicating strong operational efficiency.
Large Deal Wins: Secured $4 billion in deal wins during Q4, including a significant $650 million contract with Phoenix, showcasing robust client acquisition.
Operating Margins: Expanded by 110 basis points YoY, reflecting effective cost management.
Cash Flow: Generated net operating cash flow of nearly $2 billion for FY25, representing 128.3% of net income, underscoring financial stability.
Despite the strong Q4 performance, Wipro has provided a cautious outlook for Q1 FY26, projecting a sequential revenue decline of 1.5% to 3.5%, attributed to macroeconomic uncertainties and client caution.
Reuters
✅Conclusion
Wipro's robust Q4 FY25 results, marked by significant profit growth and strategic deal wins, have reinforced its market position. The stock's technical setup suggests potential for further upside, provided it maintains key support levels. However, investors should remain vigilant regarding the company's cautious Q1 FY26 outlook and monitor upcoming economic indicators that may impact client spending.
Disclaimer: lnkd.in
Wipro Stock Analysis – Rebounding with Strong Q4 Performance📊 Technical Analysis: Building Momentum Towards New Highs
Wipro's stock has demonstrated a significant uptrend since the COVID-19 lows in April 2020, surging from ₹100 to an all-time high of ₹360 by October 2021. Following this peak, the stock underwent a substantial correction, retracing nearly 50% to reach the ₹180 level. This zone has since acted as a robust support, with the stock forming a series of higher highs and higher lows— a classic bullish pattern.
The recent Q4 FY25 results, announced on April 16, 2025, have further bolstered investor confidence, leading to a positive price movement. Currently trading around ₹250, the stock is poised to test higher resistance levels.
Key Technical Levels:
Support Zones: ₹180 (Major Support), ₹200, ₹225
Resistance Levels: ₹300 (Initial Target), ₹320 (Secondary Target), ₹360 (All-Time High)
Investors should monitor these levels closely. A sustained move above ₹300 could signal a continuation of the bullish trend, while a breach below ₹180 may indicate further downside.
📊 Fundamental Analysis: Solid Q4 Performance with Strategic Wins
Wipro's Q4 FY25 results reflect a strong financial performance, with notable improvements across key metrics:
Q4 FY25 Key Financial Highlights:
Total Income: ₹22,504 Cr (vs ₹22,319 Cr in Q3 FY24 and ₹22,208 Cr in Q4 FY24)
Total Expenses: ₹17,880 Cr (vs ₹17,779 Cr in Q3 FY24 and ₹17,828 Cr in Q4 FY24)
Total Operating Profits: ₹4,624 Cr (vs ₹4,540 Cr in Q3 FY24 and ₹4,380 Cr in Q4 FY24)
Profit Before Tax: ₹4,743 Cr (vs ₹4,453 Cr in Q3 FY24 and ₹3,862 Cr in Q4 FY24)
Profit After Tax: ₹3,588 Cr (vs ₹3,367 Cr in Q3 FY24 and ₹2,858 Cr in Q4 FY24)
Diluted Normalized EPS: ₹3.41 (vs ₹3.20 in Q3 FY24 and ₹2.71 in Q4 FY24)
Additional Insights:
Net Profit Growth: Achieved a 26% YoY increase in net profit, indicating strong operational efficiency.
Large Deal Wins: Secured $4 billion in deal wins during Q4, including a significant $650 million contract with Phoenix, showcasing robust client acquisition.
Operating Margins: Expanded by 110 basis points YoY, reflecting effective cost management.
Cash Flow: Generated net operating cash flow of nearly $2 billion for FY25, representing 128.3% of net income, underscoring financial stability.
Despite the strong Q4 performance, Wipro has provided a cautious outlook for Q1 FY26, projecting a sequential revenue decline of 1.5% to 3.5%, attributed to macroeconomic uncertainties and client caution.
Reuters
✅ Conclusion
Wipro's robust Q4 FY25 results, marked by significant profit growth and strategic deal wins, have reinforced its market position. The stock's technical setup suggests potential for further upside, provided it maintains key support levels. However, investors should remain vigilant regarding the company's cautious Q1 FY26 outlook and monitor upcoming economic indicators that may impact client spending.
⚠️ Disclaimer:
This report is for educational and informational purposes only and does not constitute investment advice. Please consult your financial advisor before making any investment decisions.
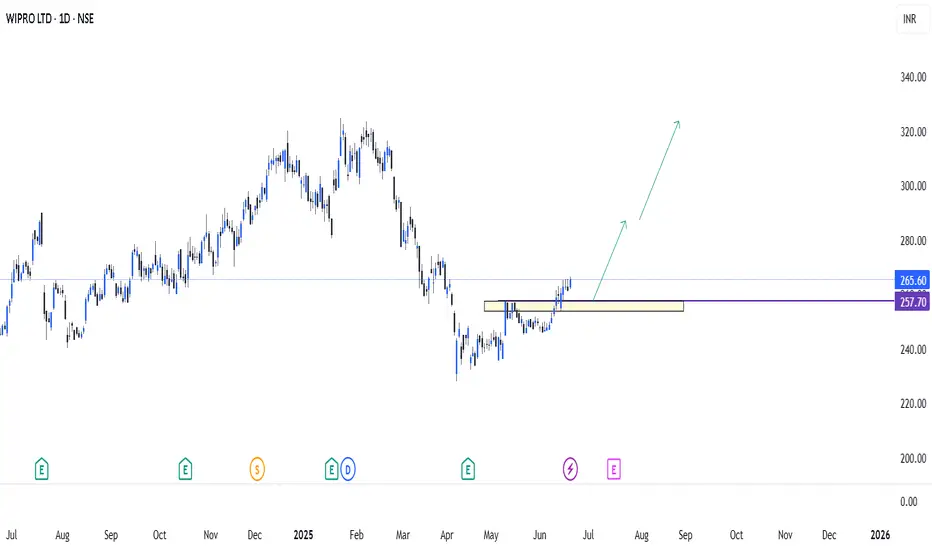
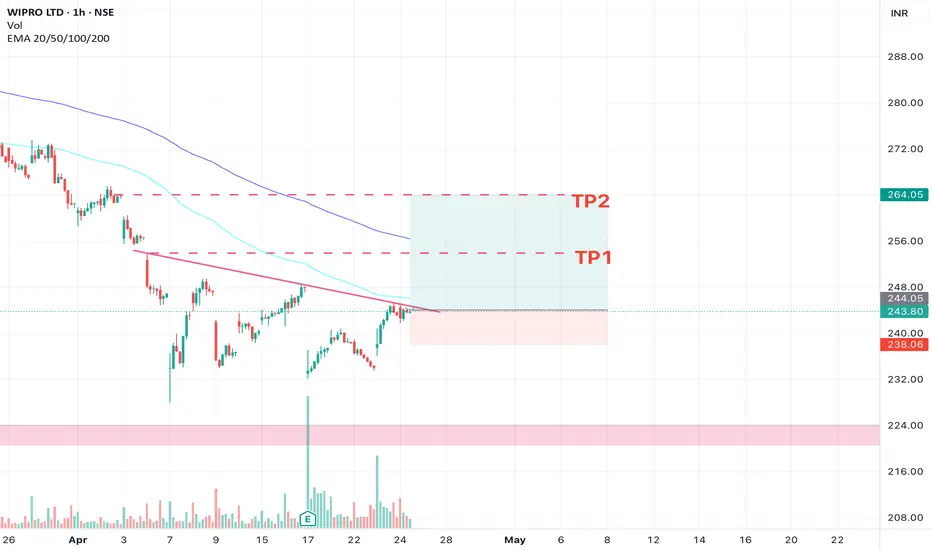
Wipro short term target for 266I will wait for wipro to slightly pull back till 251-252 and enter again for target of 266 .
Can see some big volume and bounce from good support level
WIPRO: Reversal Trade with 40% upside potential⚡️Price Analysis:
1️⃣ Price has tapped in the demand area
2️⃣ Price structure is bullish.
3️⃣ Price trading above EMAs.
4️⃣ Price is near the trendline support.
✨ Key Observations:
➡️ RRR favourable at CMP.
➡️ Volume strength is pending still.
➡️ Momentum is lacking so, it might take some time to go up.
⚠️ Disclaimer: This is NOT a buy/sell recommendation. This post is meant for learning purposes only. Views are personal. Please, do your due diligence before investing.⚠️
💬 Share your thoughts in the comments below! ✌️
🔥Follow me for more such awesome trade ideas.✅🚀
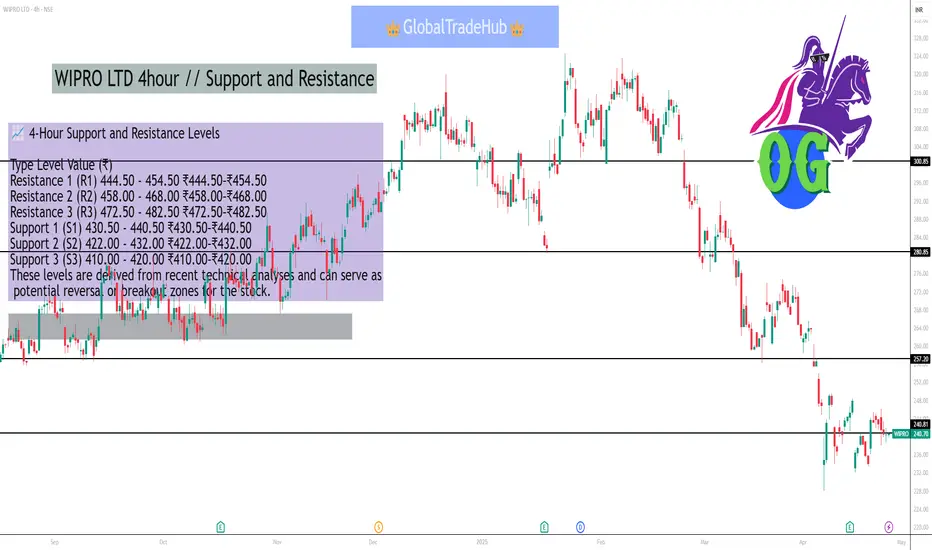
WIPRO LTD 4hour // Support and ResistanceAs of April 29, 2025, here are the key 4-hour support and resistance levels for Wipro Ltd (NSE: WIPRO) based on recent technical analyses:
📈 4-Hour Support and Resistance Levels
Type Level Value (₹)
Resistance 1 (R1) 444.50 - 454.50 ₹444.50–₹454.50
Resistance 2 (R2) 458.00 - 468.00 ₹458.00–₹468.00
Resistance 3 (R3) 472.50 - 482.50 ₹472.50–₹482.50
Support 1 (S1) 430.50 - 440.50 ₹430.50–₹440.50
Support 2 (S2) 422.00 - 432.00 ₹422.00–₹432.00
Support 3 (S3) 410.00 - 420.00 ₹410.00–₹420.00
These levels are derived from recent technical analyses and can serve as potential reversal or breakout zones for the stock.
📊 Additional Technical Indicators
Relative Strength Index (RSI): Approximately 60, indicating a neutral to slightly bullish momentum.
Moving Average Convergence Divergence (MACD): Currently in a bearish crossover, suggesting potential downward pressure.
Bollinger Bands: The stock is trading above the upper band, indicating high volatility and potential overbought conditions.
📌 Key Observations
Resistance Levels: If Wipro breaks above ₹444.50, it may face resistance at ₹458.00 and ₹472.50.
Support Levels: A decline below ₹430.50 could lead to further support at ₹422.00 and ₹410.00.
Trend Analysis: The stock is currently testing the upper resistance zone. A breakout above ₹444.50 could signal a continuation of the upward trend. Conversely, a drop below ₹430.50 may indicate a bearish reversal.
Please note that these levels are based on historical data and technical analysis, and actual market conditions may vary. It's advisable to conduct further research or consult with a financial advisor before making investment decisions.
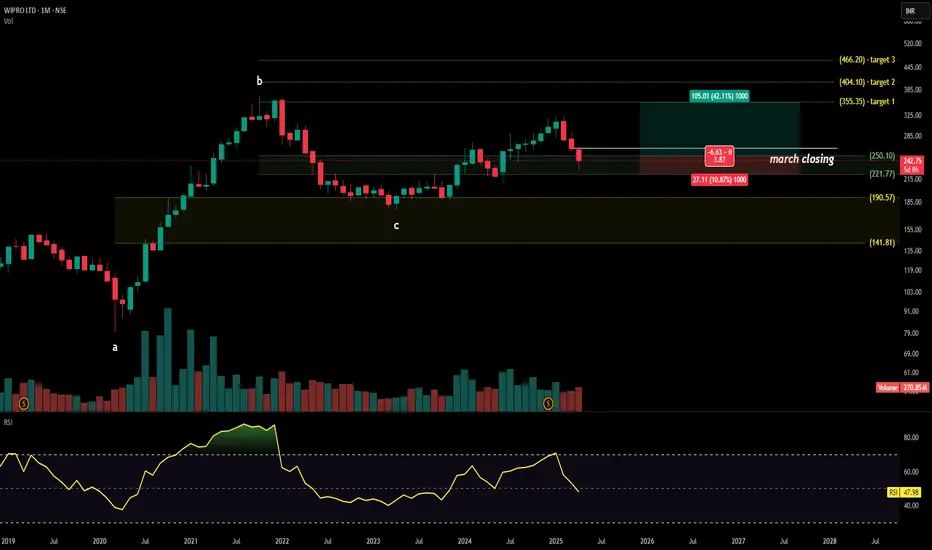
WIPRO technical analysisStock Overview: Wipro Ltd., traded on the National Stock Exchange of India (NSE), is currently priced at ₹376.90. The company is a leading global IT services provider, offering consulting, business process outsourcing, and digital transformation solutions.
Key Levels:
Support Zone: ₹141 - ₹190
Upside Swing Zone: ₹250
Possible Upside Levels: ₹335, ₹404, ₹466
Technical Indicators:
RSI (Relative Strength Index): At a value of 47.98, the RSI indicates neutral momentum, neither in overbought nor oversold territory.
Volume: Trading volumes exhibit steady activity with no significant spikes, suggesting a balanced buying and selling interest.
Sector and Market Context:
Wipro operates within the dynamic IT services sector, which is witnessing moderate growth driven by global digital transformation initiatives.
Compared to its peers, Wipro shows stable performance but lacks aggressive market positioning. The overall market sentiment is cautiously optimistic, with broader indices showing resilience despite macroeconomic pressures.
Risk Considerations:
Sector Challenges: Intense competition from Indian and international firms may weigh on margins and market share.
Stock-Specific Risks: Dependence on major clients and foreign exchange rate fluctuations could influence earnings.
Analysis Summary: Wipro Ltd. demonstrates steady technical and sectoral positioning, with support levels ensuring downside protection and potential upside levels offering room for growth. While the RSI and volumes suggest neutral momentum, broader sector dynamics highlight a cautiously optimistic outlook. Investors should consider macroeconomic and sectoral risks while evaluating Wipro's performance within their portfolio strategy.
WIPRO 1W 200EMA TOUCH AND BOUNCEWIPRO on weekly touched 200EMA, by falling almost 30%.
Price sustaining the lower level of 230 now.
To improve RR ratio; SL needs to be adjusted after price sustains the breakout and moves above 100EMA.
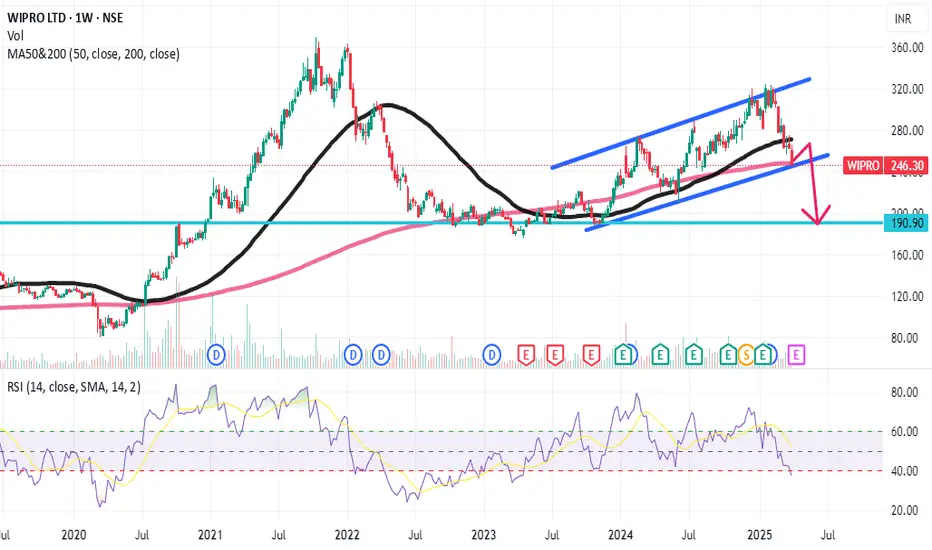
Wipro breakdown Higher probality?A very high probability that stock of Wipro can breakdown from the level. This says channel break. RSI also below 40 levels. This is for your educational purpose only.
WIPROWIPRO:- Time tested Stock. already 2X done smoothly within 4 years. If you are interested in this stock for long time, so remember weekly 50 SMA is more important parameters for long term holding. If the stock close below weekly 50 SMA by closing basic then please don't hold for long position.

WIPRO - 4HR CHARTWipro has reversed form the OB area, now there is probability of an upward move, it seems to be moving towards 323 to take buying side liquidity. Right now in buying zone, always trade with strict SL, risk management is utmost important.
If you like my analysis, please follow me as a token of appreciation :)
in.tradingview.com/u/SatpalS/
For learning and educational purposes only, not a trading advice. Pls consult your financial advisor before investing.

WIPRO staying below 320 headed for 280Attached: Weekly Price Chart as of 21st Feb 2025
Price has Topped out and broken below median of Pitchfork and can slide down to bottom of the Bottom of Pitchfork and even break below it completely
Staying below 320
Immediate Downside Target is 280

Wipro - Multi-year bullish pennant1. Wipro - Multi-year bullish pennant
2. High risk/reward
3. Might take 3-5 years to hit the target

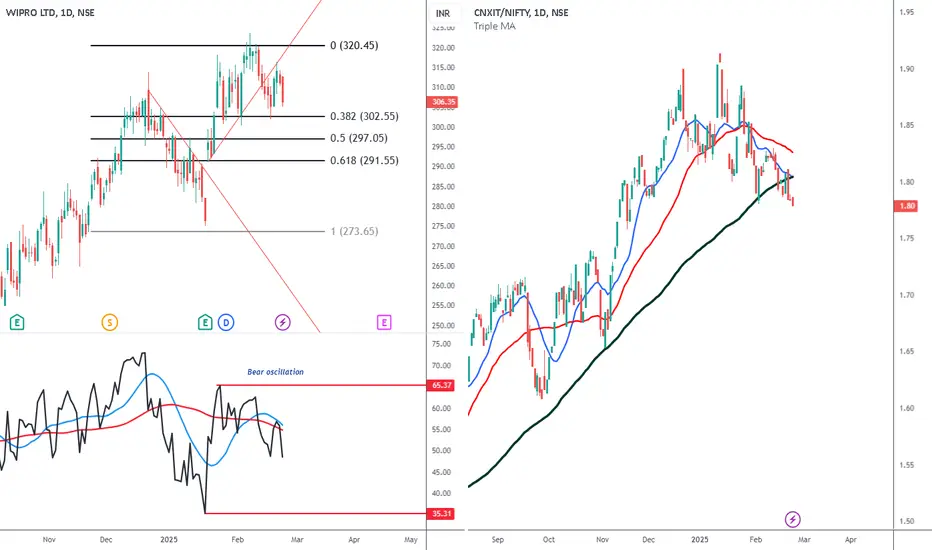
IT stocks about to correct sharplyLeft chart- Wipro
Right chart- Nifty IT Vs Nifty
Ratio Study- that the ratio is below all the three averages, is an indication that IT stocks will underperform Nifty. I had already stated that the correction in them is not over yet.
So three stocks which are a sell right now are Wipro, Infy and TechM, TCS will fall too but these are better bets as they have just started,
WIPRO - MULTI YEAR BREAKOUT - WEEKLY CHARTWipro has broken multiyear Resistance at weekly chart and consolidating.
It is also making VCP pattern at daily time frame.
It is looking strong. If it breaks 324 then there is probability of a good upside move. Keeping in mind the current market situation SL is must.
Finding right support and resistance are important.
If you like my analysis, please follow me as a token of appreciation :)
in.tradingview.com/u/SatpalS/
For learning and educational purposes only, not a trading advice. Pls consult your financial advisor before investing.
