WIPRO on RSI DiverganceWipro is consolidating over a couple of months and have slowly build RSI divergence on Weekly basis. expecting something good on short and great in long
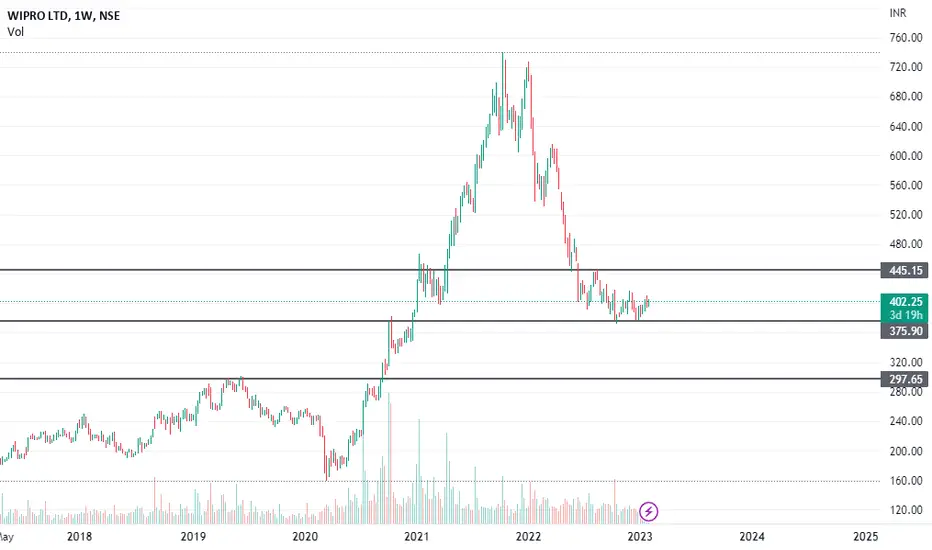
410 Price rage to watch
Trade ideas

WIPRO TARGET UPDATE 16-2-2023Look fresh in range 400-410 for upside 480 in med term and 550 in long term with SL 375..!!!

WIPRO LTD (Triple Confirmation Strategy)This study is to show the importance of a simple Triple confirmation Strategy in WIPRO that has generated a good return in the past and currently shows the same confirmation.
1. 200 Weekly Moving average – the stock must have tested the 200 Weekly Moving Average.
2. Rate of Change must be above 1
3. RSI must be at or above 50 or marginally lower.
In the Past:
Week starting 5th Aug 2013 with the same confirmation, the stock rallied 56.39% .Week starting 14th March 2017 with the same confirmation, the stock rallied 32.54% .Week starting 20th Aug 2018 with the same confirmation, the stock rallied 43.21% .Week starting 6th July 2020 with the same confirmation, the stock rallied 232.44%
Currently:
Wipro shows the very same 3 confirmations on Weekly chart, it has tested the 200 Weekly Moving Average and taking support beautifully.
-ROC is above 1
-RSI is very near to 50(Exaggerated Divergence Pattern Formed)
So it can be hoped that the stock is going to perform good in the weeks to come .The targets would be 449(Support & Resistance zone) next would be 535. Stop Loss very strictly below 375.
CHART & ANALYSIS
ADARSH DEY

Wipro Momentum IdeaKeep this stock in your watchlist
Soon we will see momentum on any side
But this stock for me is a buy on dips
Thanks

IT poor Fellow is retestingWIPRO the IT poor fellow is retesting the trendline support, Holding above 400-403 will accumulate volume and give fresh breakthrough

WIPROWIPRO trade for 10/02/2023 as we can see that price is moving in a channel even after going out of the channel price bounced back inside a range may be we can use this for F&O i highly suggest if you are buying the CE always buy some stocks of that company this way we can increase the volume and push the price more for our advantage in F&O atleast buy 4 shares of Wipro before Going for F&O
Information is only for educational purpose.//

WIPRO SHARE ANALYSIS Wipro share price going to high
Market now retracement complete to going up
It's time to buy opportunity
Target 1: 508.50
Target 2: 591.80

WIPRO FOR SHORT TO MEDIUM TERMDid a breakout came to retest the levels again broke the trendline and came for retesting the trendline
From 419 it can go till 453 within few days if market supports
with a stop loss around 380

wiprochannel is formed and hammer candel is formed at support. can take long from here
follow proper sl and dont expect a rally. keep target till resistance


SWING TRADE IDEASwing trade buy
WIPRO cmp 407.90
Sl 385
Tgt 448/500++
EXAMPLE TO BUYING QYT
Qty can buy on 3% sl rule on 50k capital is 68
Can buy qty as per own capital and risk ratio.

WIPRO MADE BULLISH HAMMERWipro made Bullish Hammer in Daily TF
Breakout with volumes in 15min and hourly TF
Above 397 trade will be confirmed further
Min Target 1:2

WIPROKey highlights: 💡⚡
✅On 1D Time Frame Stock Showing Breakout of Trendline .
✅ Strong bullish Candlestick Form on this timeframe.
✅It can give movement up to the Breakout target of 445.
✅Can Go long in this stock by placing a stop loss below 400.
✅ breakout this can give risk:reward upto 15%+

Wipro EWT Analysis Wipro 1 Hrs Time Frame Elliott wave Analysis Bullish Cycle
Micro Degree in progress in 1 hour time Frame for ((iii)) wave Target Price 440.
Sub Micro degree denoted by me in blue in color
Minuscule Denoted by red in color
.........................................................................................................................................................................................................................................................................................................................................................................................................................
Disclaimer
It is my personal research before invent in Wipro please do yourself study.
Thanks

WIPROIn the Daily chart of WIPRO,
we can se see that it has given break out and retesting is also done.


Wipro might go upWipro seems like taking support at 0.618 level from oct 2022 till Jan 23
Also strong support range 398-381


AccumulateStock has broke a trendline
Upside movement of 15%
Wait for the candle to close above the trend line
WIPRO has fallen 48% from its all time high
fundamentally good stocks to BUY and hold for long term
.
.
.
Not a SEBI registered
Trade of your own risk

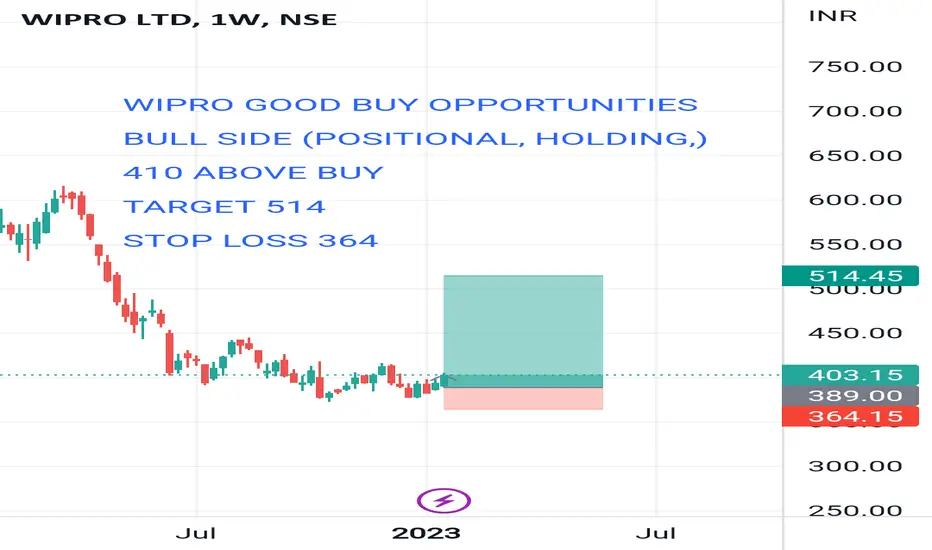
WIPRO BUYING OPPORTUNITY Wipro good buying opportunity
Big target
100% sure BULL SIDE
HOLDING,
GOOD TIME FOR INVESTMENT
Positional or Longterm Opportunity in WiproGo Long above 469.7 for Targets of 496.2, 522.7, 549.2, 575.7, and 602.2 with SL 443.2
Reasons to go Long :
1. On a Weekly timeframe if we draw the Fibonacci retracement tool from the recent swing low (point A) to the recent swing high (point B) then we see stock took support from the 0.5 Fibonacci level.
2. Also a bullish candlestick pattern Bullish Hammer (marked with orange color) is formed around 0.5 Fibonacci level.
3. In addition to this there is a strong demand zone (marked with purple color), from which the stock initially faced resistance but now is taking support and moving up.

Positional or Longterm opportunity in WiproGo Long above 396.4 for Targets of 416.5, 436.6, 456.7, 476.8, 496.9, and 517 with SL 376.3
Reasons to go Long :
1. On a Weekly timeframe if we draw the Fibonacci retracement tool from the recent swing low (point A) to the recent swing high (point B) then we see stock took support from 0.618 Fibonacci level.
2. In addition to this a bullish candlestick pattern Bullish Engulfing (marked with orange color) is formed around 0.618 Fibonacci level.
3. In addition to this there is a strong demand zone (marked with purple color), from which the stock initially faced resistance but now is taking support and moving up.
