Trade ideas

positional call buy wipro 560 above tgt 600/620 wipro very good move today but wipro showing strong Resistance back to back create new high
all the indics showing 600 minimum tgt 2-4 week .
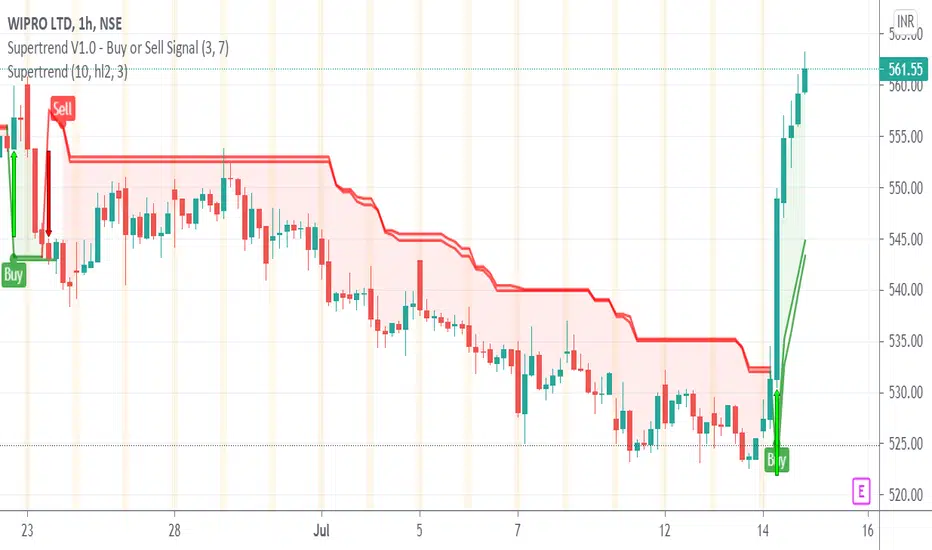
Wipro All the Target hit in just one session today 14-07-2021NSE:WIPRO
Hope you have made good profit.
All the Target hit in just one session today 14-07-2021
Avoid Intraday Trading tomorrow in Wipro.
If you are holding delivery of Wipro in cash market, then you can carry it. Trail your SL at 550.


Wipro Can give trade on both the sides. Green Lines = support. Consider it as your Target if you short/sell it after the mentioned level.
Red lines = resistance. Co NSE:WIPRO nsider it as your Target if you go long/buy it after the mentioned level.

Wipro - buy Buy from cmp to 521
easy taregt 532
tg2 - 544
Disclaimer : This is my personal analysis for study purpose not intended for trading


WIPRO: A Bullish Trend"
TECHNICAL ANALYSIS OF NSE:WIPRO
The LAST CLOSE PRICE of NSE:WIPRO is 547.5 . The PARABOLIC SAR is showing the BUY SIGNAL with TREND as UPTREND . The FIBONACCI LEVELS analysis shows that the CLOSEST FIBONACCI LEVELS is 0 at the FIBONACCI STOCK PRICE LEVEL of 547.5. From here, the Key Support and Resistance levels are SUPPORT 1 at 524.76, SUPPORT 2 at 500.49 with RESISTANCE 1 and RESISTANCE 2 at 564.05 and 581.9 respectively. The Key 50% FIBONACCI LEVEL stands at 535.23 which is the crucial Fibonacci Level determining whether the scrip will maintain the trend or not.
The STOC RSI has the values K and D as 11.73 and 14.93 respectively. At this level it the status is OVER SOLD. When we look at the Moving Averages, MACD is the crucial indicator to look into. With MACD VALUE at 9.06 and SIGNAL at 12.26 along with HISTOGRAM showing values of -3.21, the STATUS is clearly DOWNWARDS.
The best indicator to determine the Trend Reversal is FISHER TRANSFORM and currently the values of FISHER and TRIGGER stand at -0.32 and -0.1 with SIGNAL as TREND CHANGED TO BUY. A very important factor while making the investment is to see if there has been already too much of Buying or Selling, and that are we entering too late into the transaction or not. Thus, with WILLIAM's R% value at -0.5729 the STATUS is WITHIN OVER BOUGHT AND OVER SOLD RANGE.
No one wants to buy costly things, and thus always look for the bargain or appropriate price levels to buy things. Same applies to Stocks, however the only exception would be some Hot Stocks that one wants to have any price. Looking at this perspective, the P/E RATIO of the stock stands at 28.55 which signifies its Price Level to be OK.
>>> RECOMMENDATION is : BUY ."
Disclaimer:
The analysis is only for illustration purposes only. Please consult your financial advisor, agent, broker before acting on any information. We may or may not have positions in the stock and our actions may be contrary to the one mentioned here. This analysis may or may not be updated. We would not be responsible for the profit/loss resulting from this analysis.

Strong trndline act as resistance Three line I mentioned which is another another level support and the last support is a major support for this Wipro


wipro swing tradewipro forming a cup pattern in 1 hr time frame , neckline is broken it may retest or form handle too wait for it to break days low then enter

