Bullish Cup and Handle Pattern: Wipro Heading Towards 545Details:
Asset: Wipro Limited (WIPRO)
Pattern: Cup and Handle
Breakout Level: Above handle resistance (specific level not mentioned, assuming current resistance)
Potential Target: 545
Stop Loss: Below breakout level or as per risk tolerance
Timeframe: Short to medium-term
Rationale: Wipro Limited (WIPRO) is forming a cup and handle pattern, which is a bullish continuation pattern. A breakout from the handle could indicate the potential for a significant upward move towards the target of 545.
Market Analysis:
Technical Pattern: The cup and handle pattern is a bullish formation that typically signals further upside. Breaking out from the handle suggests a resumption of the prior uptrend.
Market Sentiment: Positive market sentiment or company-specific catalysts may be supporting the anticipated breakout in WIPRO.
Price Target:
The target for WIPRO is set at 545, based on the cup and handle pattern breakout.
Risk Management:
Implementing a stop loss strategy below the breakout level (handle resistance) is crucial to manage risk in case of unexpected price reversals.
Timeframe:
The projected move towards 545 is based on a short to medium-term outlook, but actual timing may vary based on market conditions.
Risk-Reward Ratio: Consider individual risk tolerance and adjust position size accordingly to maintain a favorable risk-reward ratio.
As with any investment opportunity, conduct thorough analysis and consider factors such as market trends, company fundamentals, and risk management strategies before making trading decisions.
Trade ideas

WIPRO Multiyear breakout#nifty50 Stock ready for rally 🔥
✍️High Potential 3-year Breakout
✍️Expecting 20 to 30 % within a year
🔥PE Ratio - 25
💵1 year CAGR- 30%
#BreakoutStock #stockmarket #StockMarketindia #multibagger #StocksToBuy #StocksToWatch
#gold


Long _WiproCurrently Wipro trading @ Good support in monthly timeframe.
Sep_2024 Futures is bet @ monthly timeframe.
Pros:- Bullish Engulfing @ Support.
Stock consolidation for almost 2 years and breakout above monthly high will give good rally
till 600.
Cons:- Nasdaq closed negative from ATH.
Happy Trading!! Only for educational purpose.

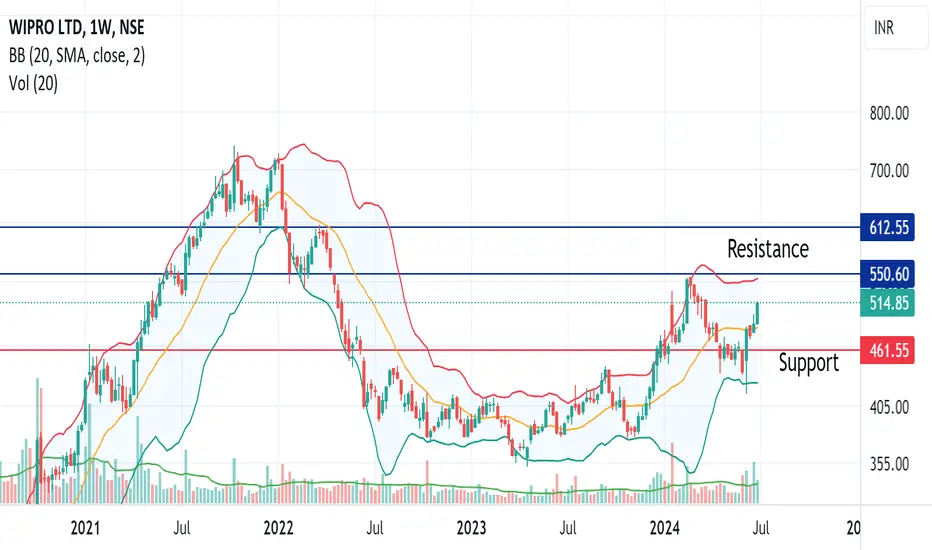
Breakout Stock: WIPROOn Weeklay Chart Wipro has given a Breakout
Strong Momentum: Price above short, medium and long term moving averages
Key Resistance: 550, 608
Support: 440
Wipro is ready to form Cup and handle pattern on weekly chartMajor stock in Nifty IT also showing uptrend after continous down fall. One can enter into it as swing or positional trading.

WIPRO, Technical Outlook (Keep this stock in the watch list)Today the price has closed on the resistance level with a RSI of above 60. All this indicates the price is in good momentum.
The breakout of 492 could open the higher levels of 545.
Disclaimer: This is my pre market analysis and my trading journal. Not a suggestion to buy or sell.

WIPRO reversal of trendThe downward trend seems to have ended although no one can be sure of it.
Technical factors
1. local ema support,
2. price action favouring bullish upcomming move(candles),
3. change in structure.

Wipro creating good swing trade in weekly time frame Wipro creating good swing trade in weekly time frame
Price consollidation near 200 EMA since 2 years and time to breakout consolidation upper zone.
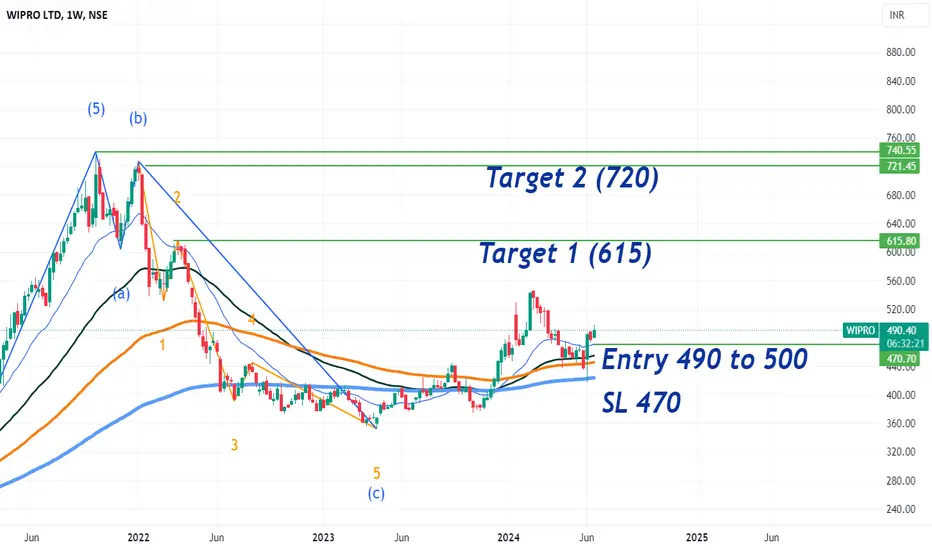
As per wave theory its ready to create fresh 12345 in weekly time frame and 5 of Monthly time frame.
Buy Wipro for a target of 540Wipro has given breakout from a strong resistance zone,Buy Wipro for a target of 540 in 10 trading sessions

Wipro-An amazing opportunity to enter a bluechip stock!Wipro had a strong resistance of 450 which broke and is now acting as a support.
Since Nifty IT is looking bullish, we can expect a reversal in this stock.
An amazing investment stock available at a very good price.


#Wipro important support and resistance levels#Wipro important support and resistance levels
Swing target 500/515/545
#swintrading #wipro


Wipro formed Big Bullish candle on Weekly TFIT Sector witnessed strong momentum in last week
Wipro took support around prev week lows & came near 480 level
It may come for retesting levels, track for Bullish pattern with all confirmations
Downside imp support is placed around 450
whereas upside hurde is at 495/495 zone
Learn and P ractice Price Action Setups

Trendline line Breakout in WIPROTrendline Breakout
RSI near 65 and rising
Trading above EMA50
Volume spurt
4 months of consolidation
Disc: for study, not a recommendation

Wipro @ SupportCurrently Wipro is showing Good possibility upside of 25 - 30% upside.
Bullish candle confirmation at Support along with Natural barrier 200 EMA.
Go long in Equity in next candle 🕯️ Open and wait for Entry in daily Timeframe to get opportunity in F&O.
Happy Trading!! Only for Educational Purpose.


Wipro Stock AnalysisIT Sector seems to be bottoming out and might be preparing for a bull run. That's why I have picked a WIPRO as the next stock to perform well.
In the recent months IT stocks have corrected after a bull run and also have consolidated for significant time.
Talking about the particular WIPRO stock. the consolidation phase may eliminate once the stock surpasses above 463.✅✅
Entry: 463✅✅
SL: 448❌❌
TGT 1: 493🔥🔥
TGT 2: 545📈📈
Note: Do your own analysis before executing a trade.

Wipro Technical Outlook | 20-May-2024
Daily tf: Trend Negative, as long as the price is below LTMA Band.
Weekly tf: Trend Neutral, Compression Zone
Disclaimer: This is my pre market analysis and my trading journal. Not a suggestion to buy or sell.

Wipro Bearish viewAs per Data analytics and price action it may retest 455 to 460 levels and take reversal and if it comes to 445 to 450 it will take support. Just a view not a reco..

1.5 years long bullish Inverted Head & Shoulder Breakout A Bullish Breakout of Inverted Head and Shoulder pattern is visible on the Daily chart of NSE:WIPRO
The shoulder is exactly at 0.236 fib retracement level. and the target is nearly at 0.50 fib level.
MACD gave Positive crossover on Daily, Weekly and Monthly chart. So, expecting the momentum to continue.
One can create a fresh position in the scrip as per the levels mentioned on the chart.
Risk Disclaimer:
The information provided in this analysis is based on my personal interpretation of market conditions and the available data at the time of writing. It is advisable to seek advice from a qualified financial professional and to conduct your own research before making any investment decisions.

