Elliott Wave Analysis – XAUUSD (October 29, 2025)
Momentum
• D1: Momentum remains compressed, but yesterday’s candle closed with a long lower wick — a clear sign of weakening downside pressure. A bullish daily close today would confirm a potential D1 reversal.
• H4: Momentum is preparing to turn down from the overbought zone, yet the current upward move is still weak. We need to monitor whether price can hold above the previous low once H4 momentum drops toward oversold.
• H1: Momentum is falling, but price is supported around 3953 and capped near 3994.
As long as price holds above 3927 and avoids breaking 3892, the next H4 oversold phase could confirm a stronger upside structure.
________________________________________
Wave Structure
• D1: The current decline equals 0.382 retracement of wave (3) yellow, a key Fibonacci level.
• H4: Wave (4) purple has already retraced 0.782 of wave (3) — unusually deep for a normal 4th wave (which typically stops around 0.382–0.5).
This suggests the ongoing correction may represent wave (4) yellow on the D1 timeframe.
If true, the market could now be forming wave W of a larger W–X–Y structure, meaning the upcoming recovery might only be a slow, overlapping X wave before another decline.
• H1: The 5-wave black structure seems completed.
A break above 3995, followed by a test of 4050, would confirm the end of wave (5) black and the start of a corrective move upward.
________________________________________
Summary
Price volatility is still high — avoid limit orders for now and watch how price reacts at key zones.
• 🔹 Support: 3953 – 3927 – 3892
• 🔹 Resistance: 3994 – 4050
Trade ideas

XAUUSDWe have a consolidation at the bottom of the week. Selling momentum is down.
Friday could be reversal. Taking out the previous week low liquidity and then reversal.

Gold Breaks Trendline: 4000 Back in FocusYesterday's trading session brought further downside pressure as gold pushed lower to test the 3880 zone, which is just above the monthly open. We have seen a decent recovery bounce from there, suggesting some buying interest is emerging at these lower levels. However, it's important to maintain perspective here while we're seeing short-term stabilization, the reversal signs on higher timeframes haven't materialized yet. We need to see more convincing price action and stronger closes on the larger timeframes before we can confidently call this as reversal to bullish case.
Also today we have extremely narrow CPR positioned at 3954. When we see such tight CPR levels, it often signals either an impending trend reversal or the potential for a high volatility session ahead. The early Asian session has already given us something to work with price is attempting to reclaim this CPR zone, which is a constructive development. Adding to the bullish case, we've also seen a breakout from the descending trendline structure that had been capping rallies over the past few sessions.
From a tactical perspective, the immediate support zone to monitor is 3900-3910.... If buyers can defend and sustain price action above this level, we could see gold make an attempt toward the first meaningful hurdle at 4000-4010. This target zone is particularly significant as it aligns with today's R1 pivot and the prior week's low, creating a confluence resistance area. A daily close above 4000-4010 would be an encouraging sign that momentum is genuinely shifting back in favor of the bulls and could open the door for further upside.
As for my positioning, I'm maintaining my existing buy positions and continuing to manage them as the price action develops. The risk-reward from these levels still appears favorable given the technical setup unfolding.

Gold Gathers Momentum Ahead of Fed's Move as Bulls Aim $4070Gold is in a bullish consolidation as prices made sharp upward bounce back off the lows of 3915 and reached a tad higher at 3982 which again faces intermediate resistance.
This may be an attempt to reset institutional order flows for some recovery towards 4050-4100-4150 before any major breakthrough in the directional move or a correctional A-B-C before the next impulse.
Intraday perspective shows buying dips around 3945-3935 as long as swing low of 3915 is intact, with potential upside move in the pipeline.

XAUUSD | Gold to drop 2000PIPS, where is the best sell zone?🔍 Market Context
After breaking the medium-term upward structure at the main Trendline , gold has formed a distinct series of Lower High – Equal Low (EqL) , indicating a phase shift from bullish to bearish.
Currently, the price is fluctuating around the 3,960–3,970 USD zone – this is a temporary liquidity accumulation area before moving up to retest the resistance at 4,015–4,050 USD , which was previously a Demand Zone now turned into Supply Zone .
If a strong bearish reaction occurs here, the price is likely to extend its decline towards the Order Block 3,945–3,960 USD zone, or even deeper to the Premium Zone 3,884 USD .
💎 Key Technical Structure
Main Trendline: broken, confirming a structural change (ChoCH).
Resistance Zone: 4,010–4,015 → quick reaction resistance.
Supply Zone: 4,043–4,060 → strong technical retracement zone.
Premium Zone: 3,884–3,900 → discount zone, potential temporary bottom.
📈 Trading Scenarios
1️⃣ SELL Zone 1 – Scalp Reaction at Resistance Zone
Entry: 4,010 – 4,015
SL: 4,025
Take Profit : 4,005 - 3,995 - 3,975 - 3,965 - Open
➡️ Quick scalp reaction at nearby resistance – suitable for trading during London/NY sessions.
2️⃣ SELL Zone 2 – Major Retest at Supply Zone
Entry: 4,043 – 4,060
SL: 4,065
Take Profit : 4,050 - 4,040 - 4,030 - 4,020 - 4,010/Open
➡️ Main setup – retest of confluence supply zone with broken trendline, high probability if strong rejection on H1/H4.
3️⃣ SELL Continuation – Break & Retest below 3,945 USD
Entry: 3,945 – 3,950
SL: 3,965
TP: 3,884
➡️ Setup breaks EqL bottom confirming continuation of downtrend, targeting Premium Zone.
4️⃣ BUY Setup – Reversal at Premium Zone 3,900 USD
Entry: 3,900
SL: 3,880
TP1: 3,910 - 3,920 - 3,930 - 3,940 - 3,950/Open
✅ Condition:
Only buy when a strong reaction candle appears (long-tail rejection / ChoCH bullish on M15–H1).
➡️ This is the final discount zone before major capital can return to the market – technical reversal setup, low risk / high reward.
⚠️ Risk Management
Prioritise SELL at supply zones, BUY at Premium – avoid trading in the middle of the range.
Reduce volume on scalp setups (Sell 1).
If price closes above 4,070 → short-term downtrend is invalidated.
💬 Conclusion
Gold is still under short-term bearish pressure, however, the 3,884–3,900 USD zone may serve as strong support.
The appropriate strategy is to utilise the two resistance zones for Selling and observe technical Buying at the Premium bottom.
👉 Comprehensive Strategy:
Sell 4,010–4,015 | SL 4,025 | TP 4,005 → 3,965 🎯
Sell 4,043–4,060 | SL 4,065 | TP 4,050 → 4,010 🎯
Buy 3,900 | SL 3,880 | TP 3,910 → 3,950 🎯
🔥 “Trade with patience, react at precision zones — that’s how consistency is built.”
⏰ Timeframe: 1H
📅 Update: 28/10/2025
✍️ Analysis by: Captain Vincent

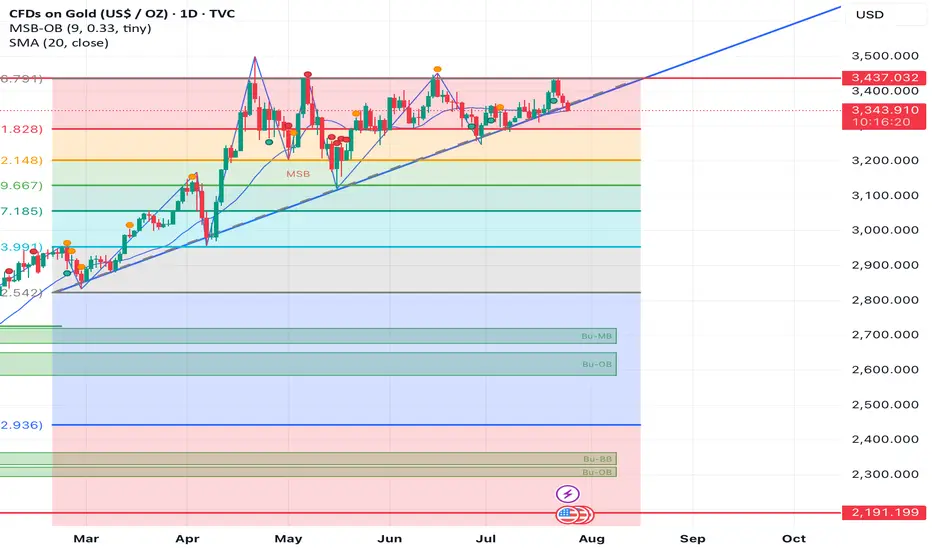
Gold breakdown?After a prolonged uptrend, gold has formed a triangle at the top and on the verge of breakdown. if breaks today and follows on Monday, can give a decent move
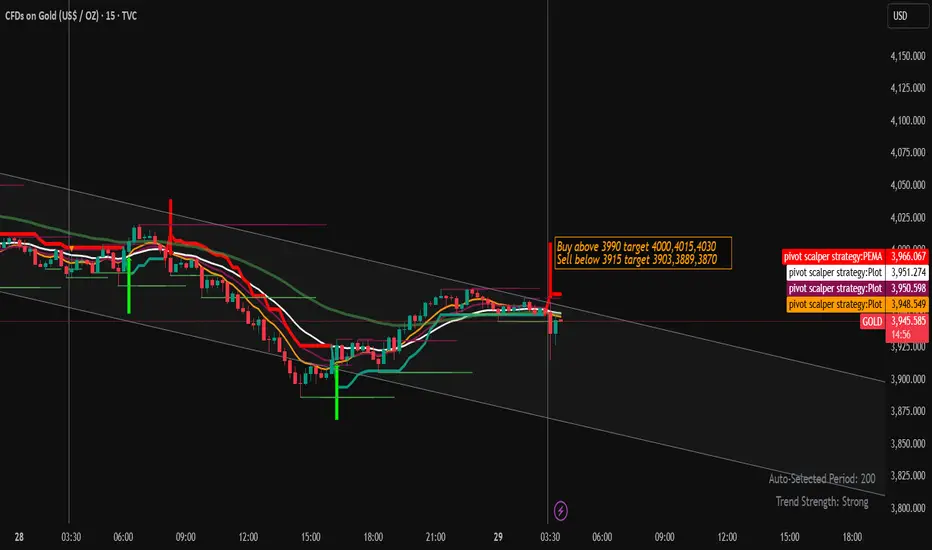
Gold Trading Strategy for 29th October 2025 (IST)🪙 TVC:GOLD Intraday Trading Plan
📈 Buy Setup:
🔹 Entry: Above the high of 15-min candle (Close > $3990)
🎯 Targets: $4000, $4015, $4030
🛑 Stop Loss: Below $3975 (or below candle low for confirmation)
📉 Sell Setup:
🔹 Entry: Below the low of 15-min candle (Close < $3915)
🎯 Targets: $3903, $3889, $3870
🛑 Stop Loss: Above $3930 (or above candle high for confirmation)
⚠️ Disclaimer:
Trading in gold or any commodity involves substantial risk. This plan is for educational and informational purposes only — not financial advice. Always assess your own risk before entering any position. 📊
XAU/USD Completing Wave Y: Final Dip Before RallyGold has completed its major 5-wave rise and is now finishing a corrective W-X-Y pattern. The recent drop looks like the final leg of this correction, meaning sellers are getting weaker. Price may show a small bounce up and then one last dip to complete the correction. After that final drop, a strong new uptrend is expected to start again. In short: correction ending soon, last dip big bullish move ahead.

XAUUSDI was waiting to short gold found this short trade.
Break of Trendline and supply zone plus downtrend this 3 confluence and entered the trade.

Gold Trading Strategy | October 28-29✅ 4-Hour Chart Analysis
Gold remains within a clear downward channel. Since falling from the 4381 level, the price continues to trade below major moving averages (MA5, MA10, MA20), meaning the bearish trend structure is still intact.
Moving Averages:
MA5 and MA10 have formed a bearish crossover and continue to diverge downward, indicating that bearish momentum remains dominant.
MA20 sits above 4050, acting as a strong mid-term resistance.
If price fails to break above MA10 (around 3990), weak downward consolidation is likely to continue.
Bollinger Bands:
The lower band is expanding downward, and gold has remained near the band’s lower edge, signaling continuation of bearish pressure.
The middle band near 4050 remains a key resistance — failure to reclaim it will keep price under downside pressure.
✅ 1-Hour Chart Analysis
After reaching the 3886 low, gold has seen a technical rebound, but price is currently hovering only between MA5 and MA10, showing that upward momentum is limited.
Price is now testing the Bollinger Bands middle line (3960–3970) — a key short-term resistance zone.
If gold breaks and holds above this level, the rebound may extend toward MA20 (3985–3990).
If it fails to break above and pulls back, the rebound concludes and price may retest 3900 or even make a new low.
🔴 Resistance Levels: 3960–3970 / 3985–3990 / 4050
🟢 Support Levels: 3930–3925 / 3885–3890 / 3800
✅ Trading Strategy Reference:
🔰 If gold rebounds to 3985–3990 and shows rejection, consider scaling into short positions, targeting 3930-3925.
🔰 If gold drops to 3880–3890 and stabilizes, consider light-lot long positions, targeting 3930-3950.
✅ Summary
There is short-term rebound demand, but the upside remains limited.
As long as price fails to break above 3990-4000, the bearish structure remains intact.
If gold drops back below 3930, the downtrend is likely to resume with momentum.

Golden Rally Losing Steam!Following an extended bullish run, gold seems to have completed a double top formation, signaling exhaustion of upward momentum. The emerging head and shoulders pattern reinforces the bearish outlook, with a projected downside target around 3600.

“Gold Rebounds from Demand Zone — Short-Term Recovery Ahead”Analysis:
Gold (XAU/USD) on the 4-hour chart shows a strong corrective decline after forming an SMC trap near the 4,250–4,300 zone, where liquidity was swept before a sharp selloff. Price has now reached the High Probability POI (Point of Interest) around the 3,850–3,880 region, showing early signs of a bullish reaction.
The recent candle structure indicates buyers are stepping in from this demand zone, confirming a potential short-term reversal. If momentum sustains, the first target zone lies around 3,950–3,980, aligning with minor resistance and previous imbalance fill.
Outlook:
📈 Bias: Bullish correction (short-term)
🧭 Key Support: 3,850 – 3,880
🎯 Target: 3,950 – 3,980
⚠️ Invalidation: Break below 3,840 may reopen bearish continuation toward 3,780


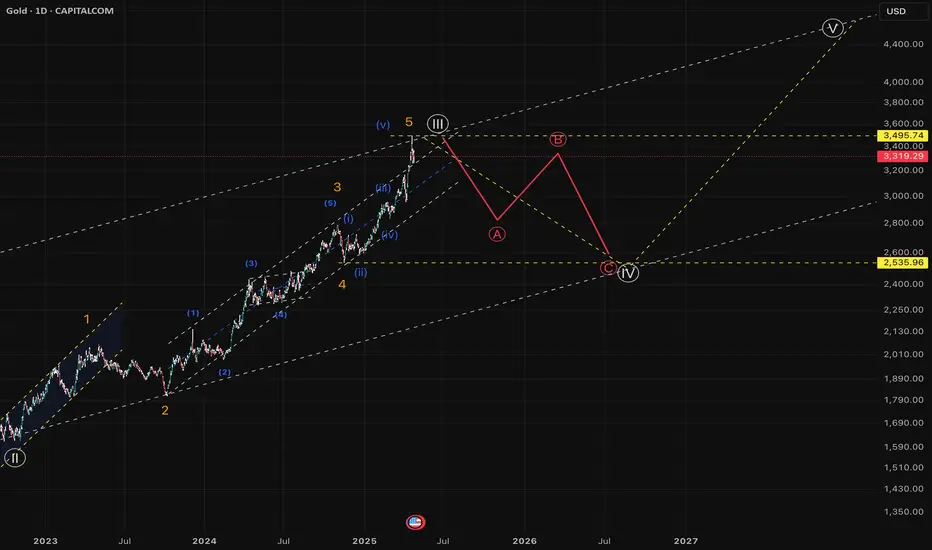
Is GOLD headed to ~2500 as part of correction ?Gold had a good run up from ~1600 levels to ~3500 level.
It seems to have completed Wave3 and has ended week with Shooting start candle.
Invalidation :
This view of correction is invalidated if Gold closes above 3500 as part of weekly close.
The correction time period may be around 6~8 months.,
Gold at Key Support — Will XAUUSD Bounce From 3900 - 3895?Gold is testing a crucial demand zone at 3900–3895, where buyers have previously stepped in.
If this level continues to hold, we could see a bullish intraday rebound play out.
📊 Trade Setup
Buy Zone: 3900 – 3895
Stop Loss: 3878
Target 1: 3924
Target 2: 3936
💡 Technical Outlook
Price action is hinting at renewed buying pressure around 3900, with candles showing wicks and slowing momentum on the downside.
This could indicate that bulls are defending this key zone, setting up for a short-term bounce toward the 3920–3935 area.
Watch for:
A bullish engulfing candle or strong rejection wick near 3895
Increasing volume confirmation on smaller timeframes (M15–H1)
🧭 Bias
✅ Expecting a bullish bounce from the 3900–3895 zone
❌ Invalidated if price closes below 3878
⚠️ Disclaimer
This is for educational purposes only — not financial advice. Always manage your risk and use proper position sizing.

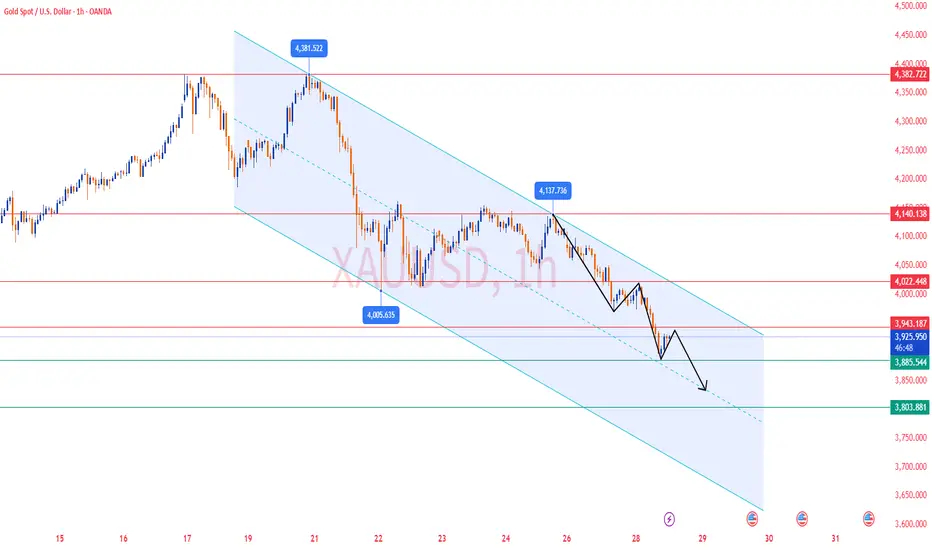
XAUUSD/GOLD 1H SELL LIMIT PROJECTION 28.10.251H Sell Limit Projection Chart for XAU/USD (Gold):
📝 Chart Summary (28.10.25)
Timeframe: 1 Hour
Setup Type: Sell Limit Projection
Market Structure: Bearish
📈 Key Levels:
Sell Limit Zone (Entry Area): Around $3,958 (Resistance R1)
Stop Loss: Around $3,982 (Top of FVG + Trendline)
Target 1 (TP1): Support S1 – around $3,920
Target 2 (TP2): Support S2 – around $3,883
📉 Technical Confluences:
🔹 1H Downtrend Line acting as dynamic resistance
🔹 FVG (Fair Value Gap) aligning with entry zone
🔹 Fibonacci retracement zone overlap
🔹 Resistance R1 matches previous supply zone
🧭 Trading Plan Idea:
Wait for price to retrace back to $3,958 zone.
Place Sell Limit order in the zone.
Stop loss: Above $3,982 zone to protect from fakeouts.
Take Profit: First target at $3,920 (partial booking), second target at $3,883 (runner).
⚠️ Risk Notes:
Watch for liquidity grabs above R1 before rejection.
Avoid market entry — wait for price confirmation near the zone.
Adjust SL if price structure shifts on lower timeframes.

Gold Analysis and Trading Strategy | October 28✅ From the daily chart of spot gold, the price is approaching the Fibonacci 0.618 retracement level near 3897, combined with the 3900 psychological level, forming a strong short-term support zone where intense buying and selling pressure is expected. However, it is important to note that gold has already broken below the head-and-shoulders neckline, confirming a structural shift into a bearish trend.
The measured move target lies near 3750, which overlaps with the 50% Fibonacci retracement around 3800, marking the potential target zone for the next phase of downside.
Overall, daily-timeframe bearish momentum remains dominant, and downside risk has not yet been fully released.
✅ From the Asian session through the European session, the market has remained in a unidirectional bearish move, with no meaningful rebound, showing clear bearish pressure.
Earlier in the European session, the price broke below the 1-hour consolidation rectangle, and the former key support at 3945 has now turned into resistance.
Gold is currently trading around 3900, still within a downward trend channel.
✅ In such a one-way drop with no pullback, where the 1-hour timeframe shows no rebound opportunity, trading should shift to the 5-minute / 15-minute short-term timeframes, using the Bollinger Bands middle line to follow the downtrend.
If the price breaks above the middle band on short timeframes, stop loss should be triggered immediately.
The ultimate target remains 3800, and long positions should be avoided against this extreme momentum.
🔴 Resistance Levels: 3930–3945
🟢 Support Levels: 3800–3805
✅ Trading Strategy Reference:
🔰 If gold rebounds to 3930–3945 and shows rejection, consider scaling into short positions, targeting 3850–3800.
🔰 If gold drops to 3800–3805 and stabilizes, consider light-lot long positions, targeting 3855–3880.
🔥Trading Reminder: Trading strategies are time-sensitive, and market conditions can change rapidly. Please adjust your trading plan based on real-time market conditions.
Gold Correction Done!!!Gold has retraced to the 0.65 Fibonacci level on the 4H timeframe, calculated from the previous swing low. This zone has historically acted as a strong inflection point deep enough to shake out weak hands, but often the launchpad for the next leg up.
Zooming into the lower timeframes (30M–1H), we’re seeing bullish engulfing candles and hammer formations, signalling a potential reversal. Momentum is shifting. If support holds, this could be the start of a solid upside move.
🔍 Multi-Timeframe Snapshot:
🕓 4H Chart:
Price parked at 0.65 Fib retracement.
No breakdown below structure.
Setup still valid unless support fails.
🕒 1H & 30M Chart:
Bullish engulfing + hammer candles.
Higher lows forming.
Volume starting to lean bullish.
🕒 15M Chart:
Microstructure shows swing low forming.
Use this for dynamic trailing or TP reference.
Entry Zone: Current Market price
Stop Loss : 3890
Target : Mentioned on the chart or follow the swing low in 15M TF

GOLD RETESTING SUPPLY BEFORE NEXT LEG DOWN🧭 DAILY TRADING PLAN – GOLD (XAU/USD)
Date: Oct 28, 2025
Main timeframe: M30 – H1
Strategy: SMC + Market Structure + Supply Zone
1. MARKET CONTEXT
Gold continues its bearish momentum after multiple CHoCH and BOS confirmations on lower timeframes.
Price is currently trading around 3935, after rejecting from several supply zones (4045–4047, 4011–4013, and 3975–3977).
Higher timeframe structure (H1–H4) remains bearish, with resistance forming between 4010–4050 and potential liquidity resting below 3928.
2. INTRADAY BIAS
Bias: Bearish
Expectation: Short retracement into supply → continuation down to support zone.
3. TRADING SETUP
Sell Zone #1: 3975 – 3977
Sell Confirmation: Price forms bearish CHoCH on M15–M30 near supply zone.
Entry: 3976
Stop Loss: 3982 (6 USD range)
Take Profit 1: 3940
Take Profit 2: 3928
R:R ≈ 1:4 — targeting liquidity below the previous swing low.
Avoid buying until clear BOS above 4013 is confirmed.
4. NOTES
If price closes above 4013, invalidates short bias and shifts to neutral — wait for fresh structure before entering again.
Monitor volume + reaction near Support Zone (3928–3940) for potential profit-taking.

XAUUSD SELL TRADE | WILL 4150 ACT AS A BARRIER?Yesterday, Gold experienced a significant sell-off after breaking below our previously identified positional sell level at 4185, triggering a sharp decline down to 4004.
Currently, Gold is showing signs of a retracement. The 4150 level is now acting as a strong resistance.
Trade Idea:
Sell Gold near 4150
Stop Loss: 4157.6
Target Levels: 4121, 4111, and 4101
Note: Monitor price action around these levels closely and manage risk accordingly.
Do you agree with this bearish outlook?
👍 Like if you’re ready to short!
💬 Comment your take or questions below — let’s build a powerful, informed trading community!
Your feedback drives our content and keeps everyone trading smarter. Let’s make those pips together! 🚀
Happy Trading,
– The InvestPro Team

Gold Breaks Key Support Zone — Bearish Momentum Builds Below $4,Analysis:
The XAU/USD (Gold vs. USD) 45-minute chart shows a clear breakdown below the established support zone, indicating a shift in market sentiment from consolidation to bearish momentum.
The support zone around $4,050 – $4,000 had previously held multiple times, acting as a strong demand area.
The recent breakout below this zone confirms a potential trend continuation to the downside.
Price action suggests a bearish pattern with lower highs and lower lows forming before the breakout.
A retest of the broken support (now resistance) may occur before the next leg lower.
The next major target lies near $3,900 – $3,850, aligning with the projected measured move.
Technical Outlook:
If gold fails to reclaim the $4,050 level, further downside pressure remains likely. However, a close back above this level could invalidate the bearish breakout and signal a possible false break.

GOLD (XAU/USD): SHORT OPPORTUNITY — RIDING THE FINAL BEAR LEG!1. MACRO VIEW: THE FED DECISION & MARKET TENSION
The Gold market is currently caught in a tug-of-war:
Downside Pressure (USD): Positive developments in the US-China trade talks are easing global risk concerns, which often reduces demand for safe-haven Gold.
Upside Support (Gold): Traders are fully pricing in a 25bps Fed rate cut on Wednesday, putting downward pressure on the US Dollar (which is supportive of Gold). Geopolitical tensions (Russia-US) add further safe-haven appeal.
Key Takeaway: While USD weakness is supportive, our Technicals strongly suggest a corrective move needs to conclude first. The FOMC decision is the ultimate game-changer.
2. TECHNICALS: STRUCTURE CONFIRMS THE BEARISH BIAS
Trend Shift: Gold’s strong previous rally has ended. The structure has been clearly broken, confirming a Bearish Shift for the short-term trend.
Expected Move: We are looking for a classic technical pullback (Retest) to the newly formed resistance zone. Following this retest, we expect sellers to push the price down to complete the correction.
3. 💡 TRADE STRATEGY (THE SHORT SETUP)
We are positioning for a SELL (SHORT) trade, anticipating the end of the corrective phase:
Ideal Entry Zone (Entry): 3,949.849 (Retesting the previous major Support, now acting as Resistance)
Take Profit (TP1): 3,929.793
Take Profit (TP2): 3,878.287 – 3,811.333 (The Major Demand Zone Target below)
Stop Loss (SL): Above 3,949.849 (Placed above the confirmed resistance)
⚠️ Important Note: The FED rate decision on Wednesday guarantees high volatility. Trade cautiously and ALWAYS prioritize risk management!
What is your view on Gold's bottom? Share your thoughts below! 👇
#Gold #XAUUSD #FOMC #TradePlan

LiamTrading - XAUUSD: SCENARIO AHEAD OF FOMCLiamTrading - XAUUSD: SCENARIO AHEAD OF FOMC - The $3840 Mark Awaits a Bottom Catch Reaction Wave
Hello trading community,
The Gold market is exhibiting a strong and sustainable downtrend. We are witnessing a crash after the price broke through key support zones. With the upcoming FOMC event, our strategy is to seek Buy opportunities at deep liquidity zones and continue to Sell when the price recovers to retest the broken trend.
📰 MACRO ANALYSIS & CASH FLOW CONTEXT
Gold is currently under dual pressure:
Bearish Pressure 🔴: Optimism about the US-China trade progress has significantly weakened the demand for Gold, traditionally a safe-haven commodity. Spot Gold prices have fallen below $3950, hitting a three-week low, down about 0.78% on the day (28/10).
Short-term Support 🟢: Bets on the possibility of Fed rate cuts continue to weaken the US Dollar (USD), which is the only factor that could potentially support this precious metal.
Conclusion: This tug-of-war makes bottom identification challenging. The bearish scenario remains the top priority.
📊 TECHNICAL ANALYSIS: THE DOWNWARD WAVE CONTINUES
Based on the H4 chart (image_5fa7fa.png):
Current Trend: The price has successfully broken the key liquidity support zone near $3950 and is continuing its downward momentum.
Current Fibonacci Level: The price is touching and reacting at the 1.618 Fibonacci level (around $3950).
Next Target: The next target for Gold will be the 2.618 Fibonacci area (around $3840), which is a large liquidity zone expected to see strong reactions.
Main Strategy: We focus on two scenarios: Catching the bottom reaction at 3840 and continuing to Sell when the price rebounds.
🎯 DETAILED TRADING PLAN (ACTION PLAN)
We have two detailed scenarios based on the current price level:
🟢 BUY Reversal Scenario
We wait for the price to hit the deep liquidity bottom at 3840 to execute a buy order with the expectation of a technical recovery.
Entry Zone: 3840
Stop Loss (SL): 3832 (tight SL)
Take Profit Targets (TP): TP1: $3872 | TP2: $3898 | TP3: $3925 | TP4: $3950
🔴 SELL Retest Scenario
If Gold recovers without breaking the downtrend structure:
Entry Zone: Watch for a Sell retest at $4091
Stop Loss (SL): $4099
Take Profit Targets (TP): TP1: $4065 | TP2: $4033 | TP3: $4004 | TP4: $3965
SUMMARY & DISCIPLINE (Steven's Note)
Gold is in a strong decline ahead of the FOMC, with significant volatility expected. Capturing deep Fibonacci and Liquidity zones is key.
Note: Always adhere to the set Stop Loss. Capital management is the top priority, risking only 1-2% of the account per trade.
Wishing traders a successful and disciplined new trading week!
