Crude oil next moveSL 1Hr candle close only, Target Trigger Price
All detail for chat. good entry at mark price only. and must stoploss minimum risk and good profit. risk ratio 1:1 to manage modified SL.
📌 This is not a buy/sell recommendation, just an educational trading idea.
📌 Market conditions can change; always conduct your own research.
📌 Understand risks before investing and take full responsibility for decisions.
WBS1! trade ideas

Crude mcx risky traders can buy at 5990 -95 SL 5940 Target 6195How to take trades using Harmonic pattern projection Trade setup is explained below :-
Entry : 1st SL point : 0% is recent top or bottom.
Trailing D: 11.4% is work as trailing SL of buy or sell trade if hit then we have to book profit
.If price goes below 2nd D 21.4% then early traders can make fresh reversals trade after breaking 1st D 11.4% safe traders can reversal trade after breaking 2nd D 21.4%
Targets :
Target T1 : 28.3% ( early trade if entry at 11.4% )
Target T1 : 35.1% to 38.2%
Target T3 : 50.1% to 53.2%
T3: 61.8% to 65.1% is our 3rd Target since this is reversal zone so must book profit if break then take fresh trade again
Target T4 : 76.4% to 79.7%
Next Targets are 100% , 127.2% ,141.4% and final Target 161.8%.
How to take reversal trade :
If price going upside/ downside then then buy or sell levels appear on Chart ( Automatically show when price reach any reversal zone of harmonic projection pattern based .
After showing reversal levels wait for confirmation until 21.4% or 28.3 % level not break if break then exit from current buy / sell trade and take fresh reverse trade buy/ sell .
Trailing SL:
After reach 1st Target trail SL to just above or below cost ( for example we are holding sell trade from 100 1st Target 110 hit then move trailing sl to 104-105 and move SL as price move upside or Downside)
Re- Entry :
For Re-entry in any pull back Point D ( 11.4% ) is used for re-entry then SL recent high or low Point D ( 0% ) .
Target is same as early 21.4% , 28.3 , 35.1 and so on
Blue Line is 1st support/ Resistance
Green line is 2nd support/ resistance
Red line is 3rd Support/ resistance

Crude falk from previous resistance area 6210 ,5970,5950 supportHow to take trades using Harmonic pattern projection Trade setup is explained below :-
Entry : 1st D point : 0% is recent top or bottom.
Trailing SL: 20.2% is work as trailing SL of buy or sell trade if hit then we have to book profit
.If price goes below 20.2% then early or risky traders can reversal trade ,
Targets :
Target T1 : 28.3%
Target T1 : 37.8 %
Target T3 : 48.1%
T3: 60.2% to 66.9 % is our 3rd Target since this is reversal zone so must book profit if break then take fresh trade again
Next Targets are 77.5 % , 88.1 % 100% , 113.5 % , 127.3% , 141.2% and 160.2 , 177.5. final Target 200%
160.2 to 177.5% if profit booking area so book full profit and wait for reversal.
How to take reversal trade :
If price going upside/ downside then then buy or sell levels appear on Chart ( Automatically show when price reach any reversal zone of harmonic projection pattern based .
After showing reversal levels wait for confirmation until 20.2 % or 28.3 % level not break if break then exit from current buy / sell trade and take fresh reverse trade buy/ sell .
Trailing SL:
After reach 1st Target trail SL to just above or below cost ( for example we are holding sell trade from 100 1st Target 110 hit then move trailing sl to 104-105 and move SL as price move upside or Downside)
Re- Entry :
For Re-entry in any pull back Point D ( 10.1% ) is used for re-entry then SL recent high or low Point D ( 0% ) .
Target is same as early 20.2% , 28.3 , 37.8 and so on
Blue Line is 1st support/ Resistance
Green line is 2nd support/ resistance
Red line is 3rd Support/ resistance

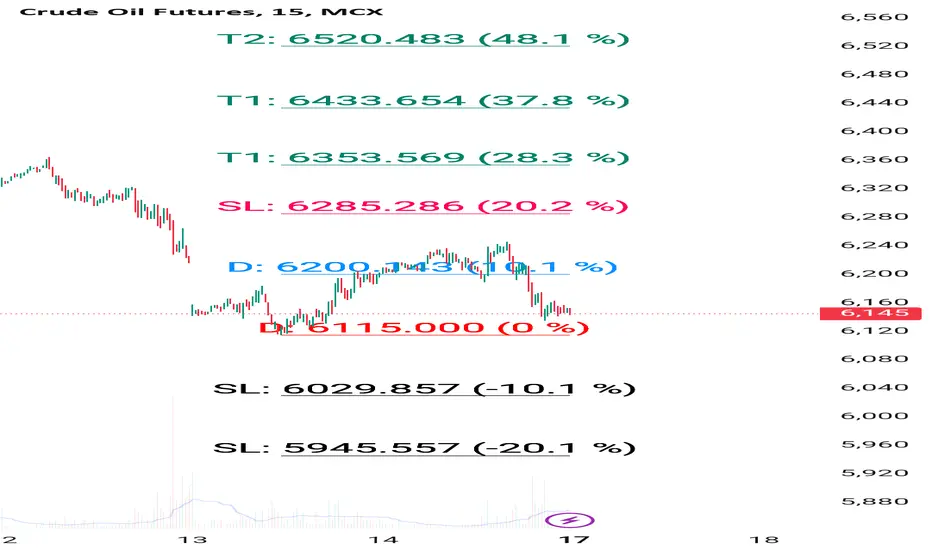
As said earlier 6100 will come in crude buy above 6145How to take trades using Harmonic pattern projection Trade setup is explained below :-
Entry : 1st D point : 0% is recent top or bottom.
Trailing SL: 20.2% is work as trailing SL of buy or sell trade if hit then we have to book profit
.If price goes below 20.2% then early or risky traders can reversal trade ,
Targets :
Target T1 : 28.3%
Target T1 : 37.8 %
Target T3 : 48.1%
T3: 60.2% to 66.9 % is our 3rd Target since this is reversal zone so must book profit if break then take fresh trade again
Next Targets are 77.5 % , 88.1 % 100% , 113.5 % , 127.3% , 141.2% and 160.2 , 177.5. final Target 200%
160.2 to 177.5% if profit booking area so book full profit and wait for reversal.
How to take reversal trade :
If price going upside/ downside then then buy or sell levels appear on Chart ( Automatically show when price reach any reversal zone of harmonic projection pattern based .
After showing reversal levels wait for confirmation until 20.2 % or 28.3 % level not break if break then exit from current buy / sell trade and take fresh reverse trade buy/ sell .
Trailing SL:
After reach 1st Target trail SL to just above or below cost ( for example we are holding sell trade from 100 1st Target 110 hit then move trailing sl to 104-105 and move SL as price move upside or Downside)
Re- Entry :
For Re-entry in any pull back Point D ( 10.1% ) is used for re-entry then SL recent high or low Point D ( 0% ) .
Target is same as early 20.2% , 28.3 , 37.8 and so on
Blue Line is 1st support/ Resistance
Green line is 2nd support/ resistance
Red line is 3rd Support/ resistance

Crude oilAll detail for chat. good entry at mark price only. and must stoploss minimum risk and good profit. risk ratio 1:1 to manage modified SL.
📌 This is not a buy/sell recommendation, just an educational trading idea.
📌 Market conditions can change; always conduct your own research.
📌 Understand risks before investing and take full responsibility for decisions.

Crude try to make double bottom buy near previous low How to take trades using Harmonic pattern projection Trade setup is explained below :-
Entry : 1st D point : 0% is recent top or bottom.
Trailing SL: 20.2% is work as trailing SL of buy or sell trade if hit then we have to book profit
.If price goes below 20.2% then early or risky traders can reversal trade ,
Targets :
Target T1 : 28.3%
Target T1 : 37.8 %
Target T3 : 48.1%
T3: 60.2% to 66.9 % is our 3rd Target since this is reversal zone so must book profit if break then take fresh trade again
Next Targets are 77.5 % , 88.1 % 100% , 113.5 % , 127.3% , 141.2% and 160.2 , 177.5. final Target 200%
160.2 to 177.5% if profit booking area so book full profit and wait for reversal.
How to take reversal trade :
If price going upside/ downside then then buy or sell levels appear on Chart ( Automatically show when price reach any reversal zone of harmonic projection pattern based .
After showing reversal levels wait for confirmation until 20.2 % or 28.3 % level not break if break then exit from current buy / sell trade and take fresh reverse trade buy/ sell .
Trailing SL:
After reach 1st Target trail SL to just above or below cost ( for example we are holding sell trade from 100 1st Target 110 hit then move trailing sl to 104-105 and move SL as price move upside or Downside)
Re- Entry :
For Re-entry in any pull back Point D ( 10.1% ) is used for re-entry then SL recent high or low Point D ( 0% ) .
Target is same as early 20.2% , 28.3 , 37.8 and so on
Blue Line is 1st support/ Resistance
Green line is 2nd support/ resistance
Red line is 3rd Support/ resistance

CrudeOil Mini 24 Feb 2025Kindly take note of the analysis for CrudeOil Mini on 24 Feb 2025. The blue bold line represents the resistance level,while the red bold line Ins the support level. The black dotted lines mark the targets on both sides should be carefully considered. It's crucial to develop a trading strategy based on this information. Please note that this is my personal view, and there may be possibility of error.

As expected after 6350 Target hit 6200 come ,buy near 6150How to take trades using Harmonic pattern projection Trade setup is explained below :-
Entry : 1st D point : 0% is recent top or bottom.
Trailing SL: 20.2% is work as trailing SL of buy or sell trade if hit then we have to book profit
.If price goes below 20.2% then early or risky traders can reversal trade ,
Targets :
Target T1 : 28.3%
Target T1 : 37.8 %
Target T3 : 48.1%
T3: 60.2% to 66.9 % is our 3rd Target since this is reversal zone so must book profit if break then take fresh trade again
Next Targets are 77.5 % , 88.1 % 100% , 113.5 % , 127.3% , 141.2% and 160.2 , 177.5. final Target 200%
160.2 to 177.5% if profit booking area so book full profit and wait for reversal.
How to take reversal trade :
If price going upside/ downside then then buy or sell levels appear on Chart ( Automatically show when price reach any reversal zone of harmonic projection pattern based .
After showing reversal levels wait for confirmation until 20.2 % or 28.3 % level not break if break then exit from current buy / sell trade and take fresh reverse trade buy/ sell .
Trailing SL:
After reach 1st Target trail SL to just above or below cost ( for example we are holding sell trade from 100 1st Target 110 hit then move trailing sl to 104-105 and move SL as price move upside or Downside)
Re- Entry :
For Re-entry in any pull back Point D ( 10.1% ) is used for re-entry then SL recent high or low Point D ( 0% ) .
Target is same as early 20.2% , 28.3 , 37.8 and so on
Blue Line is 1st support/ Resistance
Green line is 2nd support/ resistance
Red line is 3rd Support/ resistance

Crude bought at 6205 , profit booked at 6350 , re entry 6200 How to take trades using Harmonic pattern projection Trade setup is explained below :-
Entry : 1st D point : 0% is recent top or bottom.
Trailing SL: 20.2% is work as trailing SL of buy or sell trade if hit then we have to book profit
.If price goes below 20.2% then early or risky traders can reversal trade ,
Targets :
Target T1 : 28.3%
Target T1 : 37.8 %
Target T3 : 48.1%
T3: 60.2% to 66.9 % is our 3rd Target since this is reversal zone so must book profit if break then take fresh trade again
Next Targets are 77.5 % , 88.1 % 100% , 113.5 % , 127.3% , 141.2% and 160.2 , 177.5. final Target 200%
160.2 to 177.5% if profit booking area so book full profit and wait for reversal.
How to take reversal trade :
If price going upside/ downside then then buy or sell levels appear on Chart ( Automatically show when price reach any reversal zone of harmonic projection pattern based .
After showing reversal levels wait for confirmation until 20.2 % or 28.3 % level not break if break then exit from current buy / sell trade and take fresh reverse trade buy/ sell .
Trailing SL:
After reach 1st Target trail SL to just above or below cost ( for example we are holding sell trade from 100 1st Target 110 hit then move trailing sl to 104-105 and move SL as price move upside or Downside)
Re- Entry :
For Re-entry in any pull back Point D ( 10.1% ) is used for re-entry then SL recent high or low Point D ( 0% ) .
Target is same as early 20.2% , 28.3 , 37.8 and so on
Blue Line is 1st support/ Resistance
Green line is 2nd support/ resistance
Red line is 3rd Support/ resistance

Crude OiL long term levels, 6080-5985 strong support zoneHow to take trades using Harmonic pattern projection Trade setup is explained below :-
Entry : 1st D point : 0% is recent top or bottom.
Trailing SL: 20.2% is work as trailing SL of buy or sell trade if hit then we have to book profit
.If price goes below 20.2% then early or risky traders can reversal trade ,
Targets :
Target T1 : 28.3%
Target T1 : 37.8 %
Target T3 : 48.1%
T3: 60.2% to 66.9 % is our 3rd Target since this is reversal zone so must book profit if break then take fresh trade again
Next Targets are 77.5 % , 88.1 % 100% , 113.5 % , 127.3% , 141.2% and 160.2 , 177.5. final Target 200%
160.2 to 177.5% if profit booking area so book full profit and wait for reversal.
How to take reversal trade :
If price going upside/ downside then then buy or sell levels appear on Chart ( Automatically show when price reach any reversal zone of harmonic projection pattern based .
After showing reversal levels wait for confirmation until 20.2 % or 28.3 % level not break if break then exit from current buy / sell trade and take fresh reverse trade buy/ sell .
Trailing SL:
After reach 1st Target trail SL to just above or below cost ( for example we are holding sell trade from 100 1st Target 110 hit then move trailing sl to 104-105 and move SL as price move upside or Downside)
Re- Entry :
For Re-entry in any pull back Point D ( 10.1% ) is used for re-entry then SL recent high or low Point D ( 0% ) .
Target is same as early 20.2% , 28.3 , 37.8 and so on
Blue Line is 1st support/ Resistance
Green line is 2nd support/ resistance
Red line is 3rd Support/ resistance

Crude oilSL 1Hr candle close only, Target Trigger Price
All detail for chat. good entry at mark price only. and must stoploss minimum risk and good profit. risk ratio 1:1 to manage modified SL. This is not call, Just my idea. Please understand your risk and take full responsibility of your actions

Crude buy above 6200 sell below 6030 levels on chart descriptionHow to take trades using Harmonic pattern projection Trade setup is explained below :-
Entry : 1st D point : 0% is recent top or bottom.
Trailing SL: 20.2% is work as trailing SL of buy or sell trade if hit then we have to book profit
.If price goes below 20.2% then early or risky traders can reversal trade ,
Targets :
Target T1 : 28.3%
Target T1 : 37.8 %
Target T3 : 48.1%
T3: 60.2% to 66.9 % is our 3rd Target since this is reversal zone so must book profit if break then take fresh trade again
Next Targets are 77.5 % , 88.1 % 100% , 113.5 % , 127.3% , 141.2% and 160.2 , 177.5. final Target 200%
160.2 to 177.5% if profit booking area so book full profit and wait for reversal.
How to take reversal trade :
If price going upside/ downside then then buy or sell levels appear on Chart ( Automatically show when price reach any reversal zone of harmonic projection pattern based .
After showing reversal levels wait for confirmation until 20.2 % or 28.3 % level not break if break then exit from current buy / sell trade and take fresh reverse trade buy/ sell .
Trailing SL:
After reach 1st Target trail SL to just above or below cost ( for example we are holding sell trade from 100 1st Target 110 hit then move trailing sl to 104-105 and move SL as price move upside or Downside)
Re- Entry :
For Re-entry in any pull back Point D ( 10.1% ) is used for re-entry then SL recent high or low Point D ( 0% ) .
Target is same as early 20.2% , 28.3 , 37.8 and so on
Blue Line is 1st support/ Resistance
Green line is 2nd support/ resistance
Red line is 3rd Support/ resistance

Crude trying to make bottom if break 6200 then buy onlyHow to take trades using Harmonic pattern projection Trade setup is explained below :-
Entry : 1st D point : 0% is recent top or bottom.
Trailing SL: 17.5% is work as trailing SL of buy or sell trade if hit then we have to book profit
.If price goes below 17.5% then early or risky traders can reversal trade ,
Targets :
Target T1 : 28.3%
Target T1 : 37.8 %
Target T3 : 48.1%
T3: 60.2% to 66.9 % is our 3rd Target since this is reversal zone so must book profit if break then take fresh trade again
Next Targets are 77.5 % , 88.1 % 100% , 113.5 % , 127.3% , 141.2% and 160.2 , 177.5. final Target 200%
160.2 to 177.5% if profit booking area so book full profit and wait for reversal.
How to take reversal trade :
If price going upside/ downside then then buy or sell levels appear on Chart ( Automatically show when price reach any reversal zone of harmonic projection pattern based .
After showing reversal levels wait for confirmation until 17.5 % or 28.3 % level not break if break then exit from current buy / sell trade and take fresh reverse trade buy/ sell .
Trailing SL:
After reach 1st Target trail SL to just above or below cost ( for example we are holding sell trade from 100 1st Target 110 hit then move trailing sl to 104-105 and move SL as price move upside or Downside)
Re- Entry :
For Re-entry in any pull back Point D ( 9.3% ) is used for re-entry then SL recent high or low Point D ( 0% ) .
Target is same as early 17.5 % , 28.3 , 37.8 and so on
Blue Line is 1st support/ Resistance
Green line is 2nd support/ resistance
Red line is 3rd Support/ resistance
Crude not able to break 6260 zone , yesterday booked 80 points How to take trades using Harmonic pattern projection Trade setup is explained below :-
To take fresh trade in Buy/ Sell side we have to check if Price if Above / below 23.6 mentioned as D(23.6%)
Then we can take fresh buy or sell trade with SL or recent high/ low mentioned as point D( 0 %).
Targets :
T1: 35 % to 38.2 % level is our 1st Target
( This is reversal zone so if price taking support and not break zone then book profit. If breaking then hold trade with SL just above or below cost)
T2: 50% level is our 2nd Target
T3: 61.8% to 65 % is our 3rd Target
( This is also reversal zone so we have to book profit at this area and if break then take fresh entry with SL of 2nd Target 50% .)
Next Targets are 78.6 % , 88.9 % 100% , 113.5 % , 127.2% , 138.2% ,150% and 161.8% to 165%.
161.8 to 165% if profit booking area so book full profit and wait for reversal.
How to take reversal trade :
If price going upside/ downside then then buy or sell levels appear on Chart ( Automatically show when price reach any reversal zone of harmonic projection parlttern based .
After showing reversal levels wait for confirmation until 23 .6 % level not break if break then exit from current buy / sell trade and take fresh reverse trade buy/ sell .
Trailing SL:
After reach 1st Target trail SL to just above or below cost ( for example we are holding sell trade from 100 1st Target 110 hit then move trailing sl to 104-105 and move SL as price move upside or Downside)

Crude bought at 6225 booked at 6395 after that fall come buy dipHow to take trades using Harmonic pattern projection Trade setup is explained below :-
1st D point : 0% is recent top or bottom.
Trailing SL: 17.5% is work as trailing SL of buy or sell trade if hit then we have to book profit
.If price goes below 17.5% then early or risky traders can reversal trade ,
Targets :
Target T1 : 28.3%
Target T1 : 37.8 %
Target T3 : 48.1%
T3: 60.2% to 66.9 % is our 3rd Target since this is reversal zone so must book profit if break then take fresh trade again
Next Targets are 77.5 % , 88.1 % 100% , 113.5 % , 127.3% , 141.2% and 160.2 , 177.5. final Target 200%
160.2 to 177.5% if profit booking area so book full profit and wait for reversal.
How to take reversal trade :
If price going upside/ downside then then buy or sell levels appear on Chart ( Automatically show when price reach any reversal zone of harmonic projection pattern based .
After showing reversal levels wait for confirmation until 17.5 % or 28.3 % level not break if break then exit from current buy / sell trade and take fresh reverse trade buy/ sell .
Trailing SL:
After reach 1st Target trail SL to just above or below cost ( for example we are holding sell trade from 100 1st Target 110 hit then move trailing sl to 104-105 and move SL as price move upside or Downside)
Blue Line is 1st support/ Resistance
Green line is 2nd support/ resistance
Red line is 3rd Support/ resistance

Crude Oil Next move SL 1Hr candle close only, Target Trigger Price
All detail for chat. good entry at mark price only. and must stoploss minimum risk and good profit. risk ratio 1:1 to manage modified SL. This is not call, Just my idea. Please understand your risk and take full responsibility of your actions

Crude holding buy from 6225 buy on dip , levels on chartHow to take trades using Harmonic pattern projection Trade setup is explained below :-
1st D point : 0% is recent top or bottom.
Trailing SL: 17.5% is work as trailing SL of buy or sell trade if hit then we have to book profit
.If price goes below 17.5% then early or risky traders can reversal trade ,
Targets :
Target T1 : 28.3%
Target T1 : 37.8 %
Target T3 : 48.1%
T3: 60.2% to 66.9 % is our 3rd Target since this is reversal zone so must book profit if break then take fresh trade again
Next Targets are 77.5 % , 89.6 % 100% , 113.5 % , 127.3% , 141.2% and 160.2 , 177.5. final Target 200%
160.2 to 177.5% if profit booking area so book full profit and wait for reversal.
How to take reversal trade :
If price going upside/ downside then then buy or sell levels appear on Chart ( Automatically show when price reach any reversal zone of harmonic projection pattern based .
After showing reversal levels wait for confirmation until 17.5 % or 28.3 % level not break if break then exit from current buy / sell trade and take fresh reverse trade buy/ sell .
Trailing SL:
After reach 1st Target trail SL to just above or below cost ( for example we are holding sell trade from 100 1st Target 110 hit then move trailing sl to 104-105 and move SL as price move upside or Downside)
Blue Line is 1st support/ Resistance
Green line is 2nd support/ resistance
Red line is 3rd Support/ resistance

CRUDEOIL BULLISH VIEWCrude Oil Bullish View above 6400.
CMP 6390
Ready For Upside 6500-6600.
Weak Below 6290 ( 5 min CLB)
For Educational Purpose only.

crude short term update edu pur.crude stya abv 6350 looks up side 65--6600 in near terms where support 6270 if blw than more dwn fall til 6228--6170+++ one can take try to buy dips side with support sl

Crude Oil MCX Intraday Technical Analysis for 12th Feb., 2025🚀 Unlock the potential with my Crude Oil MCX Intraday Technical Analysis for 12th Feb., 2025!
✨ Boost, follow, and engage for updates. Your support means a lot! 🚀❤️
📍 Day Range Trigger Point (DRTP): 6237
📅 Expected Day Range: 69
📈 Long Position
🔹 Buy Above: 6234
🎯 Target 1: 6280
🎯 Target 2: 6306
⛔ Stoploss: 6211
📉 Short Position
🔹 Sell Below: 6217
🎯 Target 1: 6194
🎯 Target 2: 6168
⛔ Stoploss: 6240
✨ My strategies are backed by 6+ years of research and proven success in trading indices, commodities, and more. Connect to know more for Intraday Levels and Live Market Confirmations. 📈
#CrudeOil #MCX #IntradayTrading #NumroTrader 🚀

Crude buy holding from 6225 , levels on chartHow to take trades using Harmonic pattern projection Trade setup is explained below :-
1st D point : 0% is recent top or bottom.
2nd D Point : 13.5% is work as trailing SL of buy or sell trade if hit then we have to book profit
.If price goes below 13.5% then early or risky traders can reversal trade ,
Safe traders can wait for 27% levels break
Targets :
Target T1 is 27.3% if you are taken entry from 13.5% if taken entry from 27.3 then Target T1: 38.2 % level is our 1st Target
( 38.2% if also a reversal zone so if price reverse then we can make fresh entry also).
T2: 50% level is our 2nd Target
T3: 61.8% to 65 % is our 3rd Target
( This is also reversal zone so we have to book profit at this area and if break then take fresh entry with SL of 2nd Target 50% .)
Next Targets are 78.6 % , 88.9 % 100% , 113.5 % , 127.2% , 141.5% and 161.8% to 165%.
161.8 to 165% if profit booking area so book full profit and wait for reversal.
How to take reversal trade :
If price going upside/ downside then then buy or sell levels appear on Chart ( Automatically show when price reach any reversal zone of harmonic projection pattern based .
After showing reversal levels wait for confirmation until 13.5 % or 27 .6 % level not break if break then exit from current buy / sell trade and take fresh reverse trade buy/ sell .
Trailing SL:
After reach 1st Target trail SL to just above or below cost ( for example we are holding sell trade from 100 1st Target 110 hit then move trailing sl to 104-105 and move SL as price move upside or Downside)
Blue Line is 1st support/ Resistance
Green line is 2nd support/ resistance
Red line is 3rd Support/ resistance

Crude last week premium members booked 150 points profit Last week premium members booked huge profit
Gold 2150 points profit
Silver 2500 points profit
Copper 28 points profit
Natural gas 12 points.
Zinc 2 points.
Crude 150 points
How to take trades using Harmonic pattern projection Trade setup is explained below :-
1st D point : 0% is recent top or bottom.
2nd D Point : 13.5% is work as trailing SL of buy or sell trade if hit then we have to book profit
.If price goes below 13.5% then early or risky traders can reversal trade ,
Safe traders can wait for 27% levels break
Targets :
Target T1 is 27.3% if you are taken entry from 13.5% if taken entry from 27.3 then Target T1: 38.2 % level is our 1st Target
( 38.2% if also a reversal zone so if price reverse then we can make fresh entry also).
T2: 50% level is our 2nd Target
T3: 61.8% to 65 % is our 3rd Target
( This is also reversal zone so we have to book profit at this area and if break then take fresh entry with SL of 2nd Target 50% .)
Next Targets are 78.6 % , 88.9 % 100% , 113.5 % , 127.2% , 141.5% and 161.8% to 165%.
161.8 to 165% if profit booking area so book full profit and wait for reversal.
How to take reversal trade :
If price going upside/ downside then then buy or sell levels appear on Chart ( Automatically show when price reach any reversal zone of harmonic projection pattern based .
After showing reversal levels wait for confirmation until 13.5 % or 27 .6 % level not break if break then exit from current buy / sell trade and take fresh reverse trade buy/ sell .
Trailing SL:
After reach 1st Target trail SL to just above or below cost ( for example we are holding sell trade from 100 1st Target 110 hit then move trailing sl to 104-105 and move SL as price move upside or Downside)
Blue Line is 1st support/ Resistance
Green line is 2nd support/ resistance
Red line is 3rd Support/ resistance

Crude trying to make bottom until 6170 not break buy on dipHow to take trades using Harmonic pattern projection Trade setup is explained below :-
1st D point : 0% is recent top or bottom.
2nd D Point : 13.5% is work as trailing SL of buy or sell trade if hit then we have to book profit
.If price goes below 13.5% then early or risky traders can reversal trade ,
Safe traders can wait for 27% levels break
Targets :
Target T1 is 27.3% if you are taken entry from 13.5% if taken entry from 27.3 then Target T1: 38.2 % level is our 1st Target
( 38.2% if also a reversal zone so if price reverse then we can make fresh entry also).
T2: 50% level is our 2nd Target
T3: 61.8% to 65 % is our 3rd Target
( This is also reversal zone so we have to book profit at this area and if break then take fresh entry with SL of 2nd Target 50% .)
Next Targets are 78.6 % , 88.9 % 100% , 113.5 % , 127.2% , 141.5% and 161.8% to 165%.
161.8 to 165% if profit booking area so book full profit and wait for reversal.
How to take reversal trade :
If price going upside/ downside then then buy or sell levels appear on Chart ( Automatically show when price reach any reversal zone of harmonic projection pattern based .
After showing reversal levels wait for confirmation until 13.5 % or 27 .6 % level not break if break then exit from current buy / sell trade and take fresh reverse trade buy/ sell .
Trailing SL:
After reach 1st Target trail SL to just above or below cost ( for example we are holding sell trade from 100 1st Target 110 hit then move trailing sl to 104-105 and move SL as price move upside or Downside)
Blue Line is 1st support/ Resistance
Green line is 2nd support/ resistance
Red line is 3rd Support/ resistance
