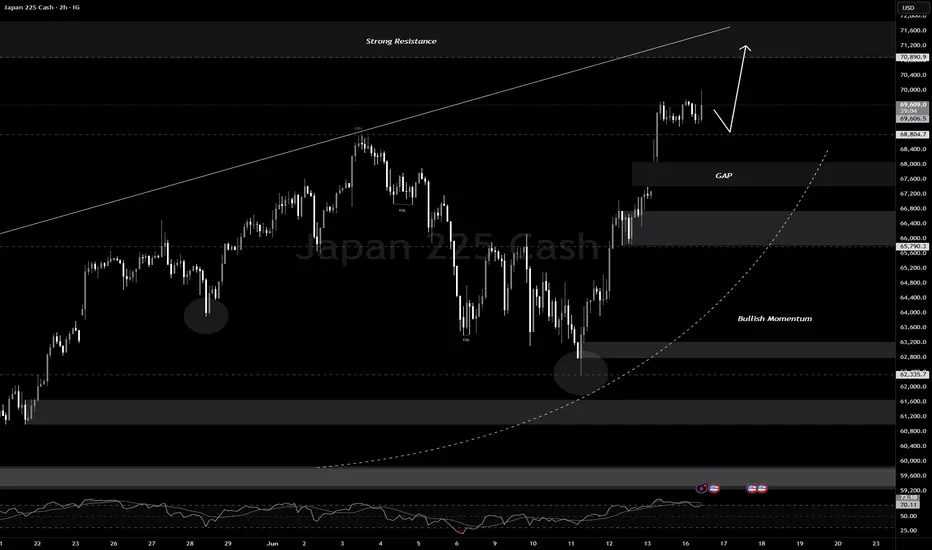
Japan 225 Daily Analysis | Key Buying Levels & Reversal ZonesJapan 225 is reacting from the Monthly Supply Zone and is now approaching key Daily Buying Levels. According to the Market Footprinting Trading Concept, the current decline appears to be a liquidity hunt rather than a confirmed trend reversal.
The highlighted demand zones could act as potential rev
Japan 225 Index
No trades
No trades
Compare with Japan 225
Japan 225 | Monthly ACS Uprising Curve | Bullish SetupJapan 225 Monthly Analysis | ACS Uprising Curve Near Monthly Supply | Bullish Continuation Setup
The Japan 225 Index is approaching a major Monthly Supply Zone while respecting the ACS Uprising Curve Pattern (Market Footprinting Trading Concept). Although price is testing a higher-timeframe supply
Nikkei Strengthens: BOJ's Interest Rate Hike DoctrineNikkei Strengthens: BOJ's Rate Hike Doctrine & Toichiro Asada's Dovish Faction Breakdown
The regular trading session on the Tokyo Stock Exchange on Tuesday afternoon, June 16, 2026, officially closed, locking in a powerful upward reversal (turns higher).
Japanese financial markets firmly resisted
Long term markets 📊 NASDAQ vs Nikkei 225 vs CNX500 — Long-term % returns tell the full story.
🔴 NASDAQ: +1,011% 🚀
🔵 Nikkei 225: +491% 📈
🟢 CNX500: +402% 💪
US tech compounded wealth like nothing else. Japan is surging back. India stays resilient.
The real flex? Staying invested long enough to see these numbers. 🧘♂️
#I
Nikkei Tries to Recover, Tests Nearby ResistanceThe Nikkei 225's decline below 63,600 on Wednesday, May 13, 2026, indicates that the Japanese stock market is beginning to suffer from the same "disease" as Wall Street: the dual pressures of energy inflation and potential monetary policy tightening.
------------------------------------------------
JPN225 – Premium Rejection + Equilibrium Breakout Short SetupJPN225 has tapped into a Premium zone, aligning with previous liquidity and a clear supply region. Price shows signs of rejection after sweeping upside liquidity and failing to hold above the premium levels.
After this sweep, price broke back below the equilibrium, indicating a possible shift in st
Japan Market (Intraday - Important Support and resistance lines)Chart reading skills are universal. A trader's enhanced learning curve comes to fore from exposure to different indices rather than focussing on a single index. From trading perspective its important not to assume the continuity of a trend from one index on to the other.
Japan 225 Micro picture - a gap in the opening next trading dayThe Index, recently has been moving differently.
To understand it, recently we tried to see one big picture in another post.
Then today trying to understand the recent corrections / changes so that we can predict on a daily basis.
When we move from Indian Index to Japan Index, i am astonished wi
Japan 225 Index key date and expectations tomorrow + 3 daysJapan 225 index has been in sideways move from oct 2024 onwards. On a daily chart, 19th Feb 25 is a key date and another on 25th Feb 2025. In between there are 2 trading days, 20th and 21st. So we expect market to move up from tomorrow till 25th Feb. Possibly on 25th Index may gap up and come down o
See all ideas
Displays a symbol's value movements over previous years to identify recurring trends.
Frequently asked questions
The champion of Japan 225 Index is TSE:285A — it's gained 1.80 K% over the year.
The weakest component of Japan 225 Index is TSE:3697 — it's lost −44.16% over the year.
Japan 225 Index is just a number that lets you track performance of the instruments comprising the index, so you can't invest in it directly. But you can buy Japan 225 Index futures or funds or invest in its components.
The Japan 225 Index is comprised of 225 instruments including TSE:8306, TSE:7203, TSE:9984 and others. See the full list of Japan 225 Index components to find more opportunities.