[CRYPTO] BUY KNCBTC AROUND 6070KNC looks good around 6070 these levels for marked targets with green lines until 4780 is intact on a closing basis.
To motivate me, Please like the idea If you agree with the analysis.
Happy Trading!
InvestPro India Team
KNCBTC trade ideas


The New Crypto Boom! Kyber Network Full Chart W/ Fib. LevelsKyber Network (KNC) Project Overview
Seamless Token Swaps, Anywhere
Kyber is an on-chain liquidity protocol that aggregates liquidity from a wide range of reserves, powering instant and secure token exchange in any decentralized application.
Kyber Network Crystal (KNC) is an ERC-20 token and an integral part of Kyber Network.
KNC is the glue that connects different participants in the Kyber Network ecosystem, including both liquidity contributors and the different entities that leverage on the liquidity network.
--
What is KNC used for?
KYBERRESERVES | Liquidity contributors
KNC facilitates the smooth operation of the reserves system in our liquidity network. To operate and provide token liquidity, 3rd party token reserves are required to purchase KNC to pay for their operation in the network. Kyber Network charges transaction fees, in KNC, from these reserves.
DAPPS / WALLETS / VENDORS | Entities that leverage on our liquidity network
By registering and plugging into our liquidity network, DApps (decentralized applications) and businesses earn commission in KNC after every transaction that they facilitate in Kyber Network. For instance, a DApp platform integrated with our APIs will receive referral fees in KNC for directing more users to our network and helping us generate greater adoption.
NETWORK FEES
In each transaction, a portion of the collected fees (in KNC) on Kyber Network are taken out of circulation forever.
Source/Website: kyber.network/
---
The New Crypto Boom!
Here we have the Kyber Network (KNCBTC) full long-term chart on Binance, we are looking at the weekly (W) timeframe.
KNCBTC bottomed in August 2019, when the altcoins market hit its first bottom.
From this month forward, KNCBTC and many other altcoins started to grow.
Many others, continued to print new bottoms, while others went on a very long consolidation phase.
KNCBTC is definitely moving ahead.
Since most altcoins that bottomed in August 2019 are also reversing, we can expect them to follow this same trend.
In less than 1 year (329 days), KNCBTC managed to only print higher highs and grow by as much as 1350%.
But, where are prices headed next?
What we see on this chart is very healthy/strong growth, which is extremely good as it opens the more for more.
The RSI remains strong and the MACD is on the bullish zone.
I marked all the future resistance levels based on Fibonacci proportions, we use these as our targets...
Where people sell for profits or where prices face resistance (stop/retrace) before any additional bullish action can take place.
I marked all the levels including a new ATH.
How far up do you think prices will go ❓❓❓
Share with us in the comments section below...
Namaste.


kyber weekly accumulationPicking up some KNCBTC in this range.
Volume is increasing on weekly timeframe, indicating accumulation in this price range.

KNC IS IN OVERSOLD CONDITION AND HAVE STRONG PREVIOUS SUPPORT KNC IS IN OVERSOLD CONDITION AND HAVE STRONG PREVIOUS SUPPORT WITH VERY CHEAP PRICE ... CAN HOLD KNC NOW ..... FOR APPROX 15-30% PROFIT

#KNC AnalysisKNC has retraced from last pump upto previous break out/resistance zone which is now acting as support.
good buy here

There is a possibility for the beginning of an uptrend in KNCBTCTechnical analysis:
. KyberNetwork/Bitcoin is in a range bound and the beginning of uptrend is expected.
. The price is above the 21-Day WEMA which acts as a dynamic support.
. The RSI is at 55.
. The price downtrend in the daily chart is broken, so the probability of the resumption of an uptrend is increased.
Trading suggestion:
. Price is in the support zone (0.000064 to 0.000054), traders can set orders based on Daily-Trading-Opportunities and expect to reach short-term targets.
Beginning of entry zone (0.000064)
Ending of entry zone (0.000054)
Entry signal:
Signal to enter the market occurs when the price comes to " Buy zone " then forms one of the reversal patterns, whether " Bullish Engulfing ", " Hammer " or " Valley " in other words,
NO entry signal when the price comes to the zone BUT after any of the reversal patterns is formed in the zone.
To learn more about " Entry signal " and the special version of our " Price Action " strategy FOLLOW our lessons:
Take Profits:
TP1= @ 0.00008680
TP2= @ 0.00010000
TP3= @ 0.00011750
TP4= @ 0.00013140
TP5= @ 0.00015900
TP6= @ 0.00018700
TP7= @ 0.00020600
TP8= @ 0.00023530
TP9= @ 0.00027380
TP10= @ 0.00033470
TP11= @ 0.00044000
TP12= Free


There is a possibility for the beginning of an uptrend in KNCBTCTechnical analysis:
. KyberNetwork/Bitcoin is in a downtrend and the beginning of uptrend is expected.
. The price is below the 21-Day WEMA which acts as a dynamic resistance.
. The RSI is at 39.
. While price downtrend in the Daily chart is not broken, bearish wave in price would continue .
Trading suggestion:
. There is a possibility of temporary retracement to suggested support zone (0.00006300 to 0.00005040). if so, traders can set orders based on Price Action and expect to reach short-term targets.
Beginning of entry zone (0.00006300)
Ending of entry zone (0.00005040)
Entry signal:
Signal to enter the market occurs when the price comes to "Buy zone" then forms one of the reversal patterns, whether "Bullish Engulfing" , "Hammer" or "Valley" in other words,
NO entry signal when the price comes to the zone BUT after any of the reversal patterns is formed in the zone.
To learn more about "Entry signal" and the special version of our "Price Action" strategy FOLLOW our lessons:
Take Profits:
TP1= @ 0.00008680
TP2= @ 0.00010000
TP3= @ 0.00011750
TP4= @ 0.00013140
TP5= @ 0.00015900
TP6= @ 0.00018700
TP7= @ 0.00020600
TP8= @ 0.00023530
TP9= @ 0.00027380
TP10= @ 0.00033470
TP11= @ 0.00044000
TP12= Free

There is a possibility for the beginning of uptrend in KNCBTCTechnical analysis:
. KYBERNETWORK/BITCOIN is in a downtrend bound and beginning of uptrend is expected.
. The price is below the 21-Day WEMA which acts as a dynamic resistance.
. The RSI is at 33.
Trading suggestion:
. The price is in a downtrend and we forecast the uptrend would begin.
. There is a possibility of temporary retracement to suggested support zone (0.000130 to 0.000109). if so, traders can set orders based on Price Action and expect to reach short-term targets.
Beginning of entry zone (0.000130)
Ending of entry zone (0.000109)
Entry signal:
Signal to enter the market occurs when the price comes to "Buy zone" then forms one of the reversal patterns, whether "Bullish Engulfing" , "Hammer" or "Valley" in other words,
NO entry signal when the price comes to the zone BUT after any of reversal patterns is formed in the zone.
To learn more about "Entry signal" and the special version of our "Price Action" strategy FOLLOW our lessons:
Take Profits:
TP1= @ 0.000161
TP2= @ 0.000187
TP3= @ 0.000207
TP4= @ 0.000235
TP5= @ 0.000274
TP6= @ 0.000313
TP7= @ 0.000369
TP8= @ 0.000440
TP9= Free

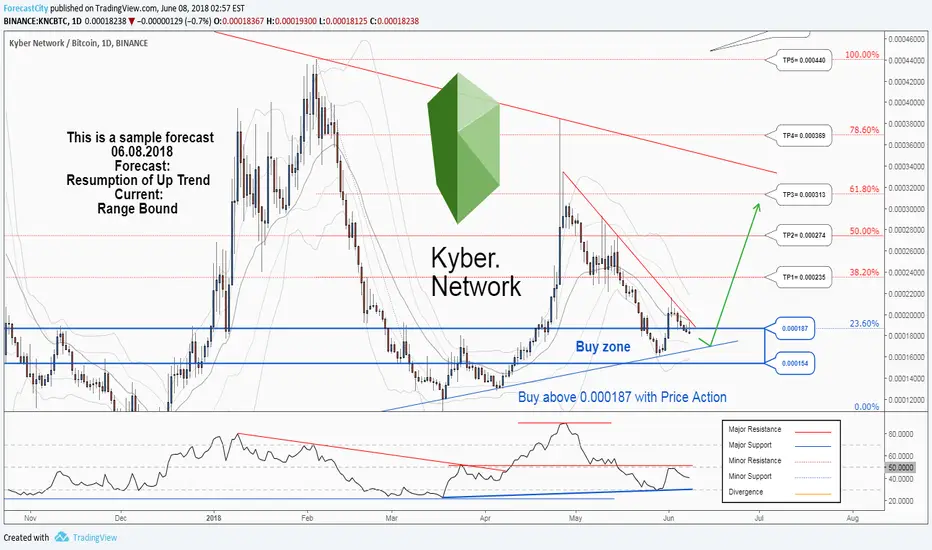
There is a trading opportunity to buy in Kyber Network...Technical analysis:
. KyberNetwork/BITCOIN is in a range bound and Resumption of uptrend is expected.
. The price is below the 21-Day WEMA which acts as a dynamic resistance.
. The RSI is at 40.
Trading suggestion:
. The price is in a range bound, but we forecast the uptrend would resume.
. There is a possibility of temporary retracement to suggested support zone (0.000187 to 0.000154). if so, traders can set orders based on Price Action and expect to reach short-term targets.
Beginning of entry zone (0.000187)
Ending of entry zone (0.000154)
Entry signal:
Signal to enter the market occurs when the price comes to "Buy zone" then forms one of the reversal patterns, whether "Bullish Engulfing" , "Hammer" or "Valley" , in other words,
NO entry signal when the price comes to the zone BUT after any of reversal patterns is formed in the zone.
To learn more about "Entry signal" and special version of our "Price Action" strategy FOLLOW our lessons:
Take Profits:
TP1= @ 0.000235
TP2= @ 0.000274
TP3= @ 0.000313
TP4= @ 0.000369
TP5= @ 0.000440
TP6= Free
A good opportunity to buy in KNCBTC , Don't miss it.KyberNetwork/Bitcoin
New trading suggestion:
The price is in an up trend and we forecast the uptrend would continue.
But there is possibility of temporary retracement to suggested support zone (0.000235 to 0.000187), if so, traders can set orders based on Daily-Trading-Opportunities and expect to reach short-term targets.
Beginning of entry zone (0.000235)
Ending of entry zone (0.000187)
Entry signal:
Signal to enter the market occurs when the price comes to "Buy zone" then forms one of the reversal patterns, whether "Hammer" or "Valley" , in other words,
NO entry signal when the price comes to the zone BUT after any of reversal patterns is formed in the zone.
To learn more about "Entry signal" and special version of our "Price Action" strategy FOLLOW our lessons:
Take Profits:
TP1= @ 0.000274
TP2= @ 0.000313
TP3= @ 0.000369
TP4= @ 0.000440
TP5= Free
