HDFC BANK CHART ANALYSISHdfc has Form Rectangle chart pattern and gave us a nice Breakout woth 1Day Candle if BankNofty going to his favour coming session HDFC BANK is gonna Big Move
0A7I trade ideas

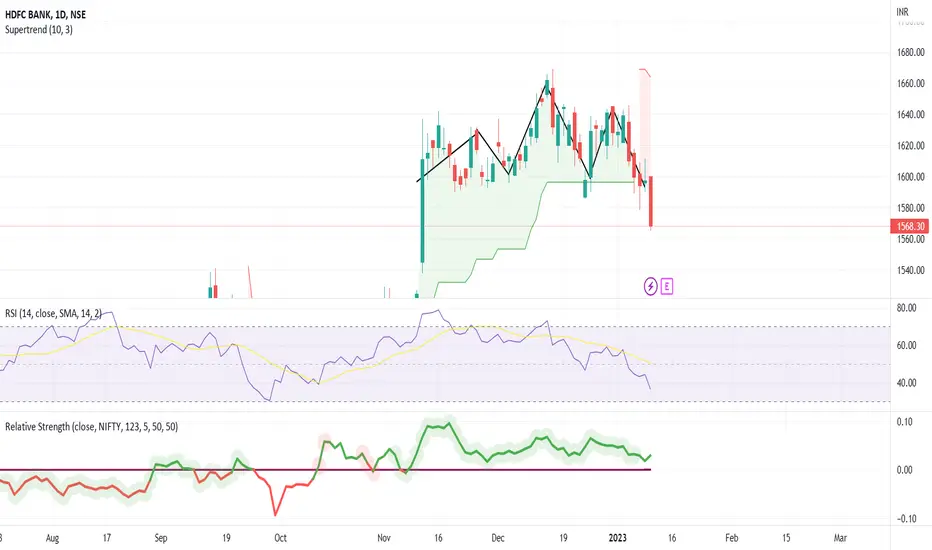
Compared HDFC Bank to the Nifty and its peers in the sector I compared HDFC Bank to the Nifty and its peers in the sector beginning October 18, 2021, and discovered that HDFC Bank just started outperforming both the Nifty and its peers in the sector. That means it's a first notification; keep an eye on HDFCBANK.

A sense of debtIn the previous two posts, we explored how assets are grouped in a company's balance sheet.
Part 1: Balance sheet: taking the first steps
Part 2: Assets I prioritize
Now let's deal with Liabilities and Stockholders' equity. Let me remind you that these are the sources of funds that give a company assets. And indeed, with what funds can a company have assets? Either with its own funds (stockholders' equity), or with funds borrowed (liabilities). For simplicity, we will call them Debts and Equity.
Debts can vary in maturity, so we've divided them into two categories in the balance sheet: Current liabilities and Non-current liabilities .
Current liabilities include:
- Current debts are debts that need to be paid back within a year after they are incurred. Do you remember our master took a loan from the bank to make a large batch of boots? That loan will be recorded in this item (assuming the loan is up to one year in repayment).
- Accounts payable (debts to suppliers of goods and services). You can borrow money not only from the bank, but also from your suppliers, for example. In other words he is giving you raw materials now, but is ready to accept payment later. Such debts are reflected in this item.
- Accrued liabilities (Provisions for future expenses on unpaid bills in the form of wages, rent, taxes). The word "debt" is in many ways synonymous with the word "liability." A company may have many such liabilities: payment of wages, rent and taxes. In essence, these are also debts to be paid during the year. For convenience, cash reserves are set aside for them. They are spent at the moment when the payment is due. Such reserves are recorded in this item.
- Other current liabilities . Debts or liabilities with a maturity of up to one year that are not included in the categories above are shown here.
Non-current liabilities include:
- Long term debt - these are debts that need to be paid back more than one year after they are incurred. If our master had borrowed from the bank for two years, such a loan would fall into this category.
- Deferred taxes liabilities (Provision for taxes to be paid in a future period). Tax rates are subject to change, and new taxes may come into effect in a year or more. But even now, the company can set aside money for future taxes.
- Other long term liabilities . Here are debts or liabilities with a maturity of more than one year that are not included in the categories above.
In short, debts are loans taken by the company, provisions for tax liabilities, and debts to suppliers.
The amount of debt is a very important indicator in the fundamental analysis of a company. On the one hand, the mere presence of debt is not scary, because it demonstrates that banks trust the company and give it loans for development. On the other hand, a substantial amount of debt can cause serious problems and losses in the period of weak sales of goods or services. Banks are unlikely to suspend interest charges on loans if a company is doing poorly. This means the company will incur expenses in the form of interest on loans that are not offset by revenue. Also a reminder that if a company goes bankrupt, the owners of the stock get the assets of that company only after all debts have been settled . If the debts are so large that they exceed the value of all the property, the shareholders get nothing. For these reasons, I select companies with small debt loads.
What liabilities do I focus on?
- Current debt;
- Accounts payable;
- Long term debt.
For me, these are the items that most clearly reflect the company's debt situation.
In the next post, we will conclude our study of the balance sheet and look at the basic source of assets, which is Equity. See you soon!

HDFC Bank- HDFC Bank was consolidating in a box since last 02 months.
- Today the price has cross the high of the box.
- It may give a good run if sustain above the box.
- This is for educational purpose only.

#Hdfcbank cash : Looks good around 1625-1628#Hdfc bank cash -Positional call
18.Jan 2023
Looks good around 1625-1628
Stoploss at 1600
Target 1668-1660/1690
Cmp 1637.30

Where will 3.5 year consolidation lead to. HDFCBANK has been consolidating from 3.5 years in the range of 1200-1600. The price has formed a triangle pattern and it has been formed on the base of a long term trend line. Stock has been moving along a 20 year old trendline. When the price breaks out it will lead to a strong trend as many factors are playing around.

Short term long swing trade on HDFCBANK
inside support-resistance zone
Trendline support taken
RSI and MACD long signal
Do your own research before taking positions.


hdfc bank bearish movewe can expect short move from the supply zone. over all trend is bullish but we can expect short term pullback.

hdfc bankhdfcbank
cup and handle pattern but my view selling lets see ,okh
1587 below candle close hdfc bank weak for sell

HDFC Bank, a very good opportunity for the short HDFC bank is moving in a zone, we can see clearly in the chart,
At the moment, volume was accumulating from several days by big boys, now they have start aggressively shorting he HDFC bank, dont short from here, wait for the price to test again this zone, (blue box), if price sustain here, then you can short.
best of luck, happy trading.

ABC correction over.Unless a further complex correction.
the stock is set to rise.
Ahead of its result it had decent upmove yesterday.
Its result is on 14 th january.
don't forget to like this post.
follow me to get updates

HDFC BANK 1 hrTomorrow release earning of HDFC BANK.. so traders keep watch this level.. HDFC is going upside..
add this stock to your watchlist...

HDFC BANKHdfc bank lookig bullish but not exectly okh market resistance ariya hdfc bank go for 1 hr chart and see hdfc movementum,okh

head and shoulder pattern found on hdfc bank head and shoulder pattern found on the daily chart of the hdfc bank
HDFC BANK TREND ANALYSIS (DEMAND & SUPPLY)Hi mates here I am sharing mine research on Hdfc Bank on daily time frame chart by some trendline to try to find out coming action in mine favorite Giant stock and that what we can see that today that it break a support below which I mentioned as downtrend support and closed below after taking resistance from up trendline and down trendline resistance too and gives a negative close so what are the coming possibilities in stock which I can see is that it could hit demand zone 1 and could bounce to downtrend support or resistance or could test to Demand zone 2 and bounce from there for demand zone 1 or maximum for downtrend support which will act as resistance cause price below support could act as resistance
-:Fresh Breakout we can see if only able to break Downtrend resistance and close above.
-:Fresh Breakdown we can see only able to break Demand zone 2 and close below.
BE A HERO, ALWAYS TRUST YOUR OWN ANALYSIS

Triangle PatternA triangle chart pattern involves price moving into a tighter and tighter range as time goes by and provides a visual display of a battle between bulls and bears.
Script = HDFC Bank
Time Frame= 1 day

HDFC BANKHDFC Bank range break out after long consolidation let see market pull down also banknifty pull down keep eye hdfc bank when decission (CE PE) banknifty , hdfc 1550 target triggerd,okh tomorrow session

HDFCBANK has gone weak nowNSE:HDFCBANK gave a closing below 50 DEMA on daily timeframe. Now it should show 1540-1530 levels soon.


hdfc bankhdfc bank important support ariya 1604 okh lets see banknifty move up when hdfc bank move up

HDFC BANK CHART ANYLYSISHere is the HDFC BANK CHART anylysis where the HDFCBANK Stuck in in Support & Resistance Parallely

HDFCBANK has gone in weaker zoneNSE:HDFCBANK has broken 1600 levels decisively today. But I don’t think it would break 1500 levels.
