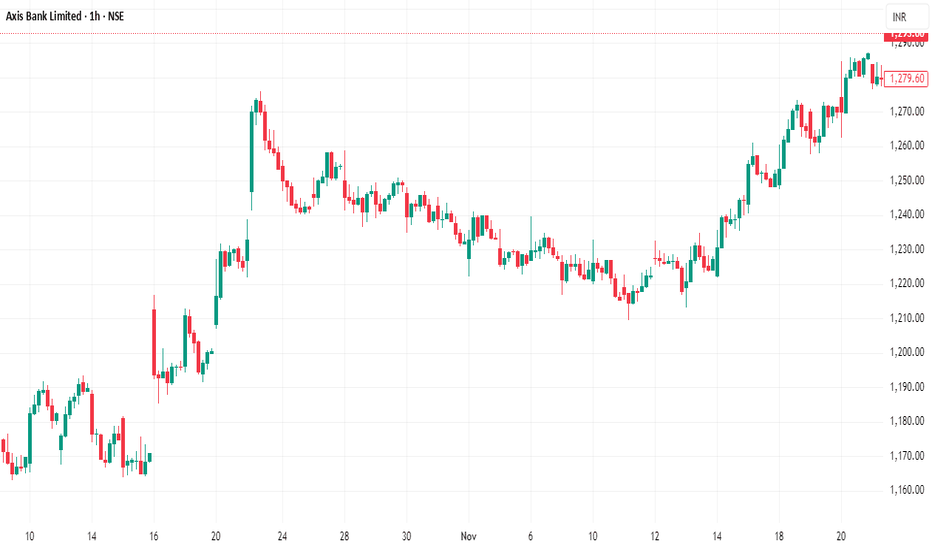
AXISBANK 40% upside possibility in 1-1.5 YearsAXISBANK 40% upside possibility in 1-1.5 Years
Fundamentals - Company has delivered good profit growth of 72.2% CAGR over last 5 years - Best among all Private banks.
Technical - Stock breaking from ATH backed with excellent Results.
LTP - 1325
Targets - 1850+
Timeframe - 1-1.5 Years.
Happy In
Axis Bank Limited Sponsored GDR RegS
No trades
4.9 USD
3.32 B USD
18.36 B USD
About Axis Bank Limited
Sector
Industry
CEO
Amitabh Chaudhry
Website
Headquarters
Mumbai
Founded
1993
IPO date
Sep 21, 1998
Identifiers
3
ISIN US05462W1099
Axis Bank Ltd. engages in the provision of financial solutions to retail, small and medium enterprises, government, and corporate businesses. It operates through the following segments: Treasury, Retail Banking, Corporate or Wholesale Banking, and Other Banking Business. The Treasury segment includes investments in sovereign and corporate debt, equity and mutual funds, trading operations, derivative trading and foreign exchange operations on the proprietary account and for customers and central funding. The Retail Banking segment constitutes lending to individuals or small businesses subject to the orientation, product and granularity criterion and also includes low value individual exposures not exceeding the threshold limit. It also covers liability products, card services, internet banking, ATM services, depository, financial advisory services and NRI services. The Corporate or Wholesale Banking segment involves in corporate relationships, advisory services, placements and syndication, management of public issue, project appraisals, capital market related and cash management services. The Other Banking Business segment encompasses para banking activities such as third party product distribution and other banking transactions. The company was founded on December 3, 1993 and is headquartered in Mumbai, India.
Related stocks
Part 5 Advance Option Trading How Option Trading Works – Step-by-Step
You choose a strike price based on your directional view.
You decide whether to buy the option or sell it, depending on your risk appetite.
If you expect strong movement, you typically buy.
If you expect sideways movement, you typically sell.
When market
Axis Bank | Intraday Price Behavior Near Square-Based LevelsDisclaimer:
This analysis is for educational purposes only. I am not a SEBI-registered advisor. This is not financial advice.
Educational Case Study | 8 April 2024
This idea documents an educational intraday case study on Axis Bank, focusing on how price–degree alignment and time awareness were o
Are You a Market Student? That’s Exactly Who This Is ForDisclaimer:
This analysis is for educational purposes only. I am not a SEBI-registered advisor. This is not financial advice.
Most traders spend years searching for consistency, clarity, and a better way to interpret price behavior.
If your interest goes beyond indicators and focuses on how price
Option Chain Terms – A Comprehensive Explanation1. Underlying Asset
The underlying asset is the security on which the option contract is based. This could be an equity stock (like Reliance or TCS), an index (such as NIFTY or BANKNIFTY), a commodity, or a currency. All option prices in the option chain are derived from the movement of this underl
Axis Bank | Intraday Price Behavior Using Square-Based GeometryDisclaimer:
This analysis is for educational purposes only. I am not a SEBI-registered advisor. This is not financial advice.
Educational Case Study | 1 April 2024
This idea shares an educational intraday case study on Axis Bank, focusing on how price capacity and time awareness were observed usi
Axis Bank | Intraday Price-Time Observation Using Square-Based GDisclaimer:
This analysis is for educational purposes only. I am not a SEBI-registered advisor. This is not financial advice.
Educational Case Study | 21 October 2024
This idea presents an educational intraday case study on Axis Bank, focusing on how price–degree alignment and time awareness can be
Part 2 Institutional Option Trading Vs. Technical AnalysisWhy do People Trade Options?
People trade options for many different reasons. Since we are focusing on
options basics today, we will focus on the most common reasons.
1. Leverage: As stated on the last slide, one option contract controls 100
shares of the underlying’s stock
2. Capital outlay: You
AXISBANK 1 Week Time Frame 📊 Current Context (As of 30 Jan 2026)
Last Close: ~₹1,370 – ₹1,378 range.
Recently traded near a 52-week high.
📈 Weekly Resistance Levels
These resistances act as potential upside barriers for the coming week:
R1: ~₹1,317 – ₹1,320 — first resistance zone.
R2: ~₹1,341 – ₹1,342 — next upside.
R3:
See all ideas
Summarizing what the indicators are suggesting.
Oscillators
Neutral
SellBuy
Strong sellStrong buy
Strong sellSellNeutralBuyStrong buy
Oscillators
Neutral
SellBuy
Strong sellStrong buy
Strong sellSellNeutralBuyStrong buy
Summary
Neutral
SellBuy
Strong sellStrong buy
Strong sellSellNeutralBuyStrong buy
Summary
Neutral
SellBuy
Strong sellStrong buy
Strong sellSellNeutralBuyStrong buy
Summary
Neutral
SellBuy
Strong sellStrong buy
Strong sellSellNeutralBuyStrong buy
Moving Averages
Neutral
SellBuy
Strong sellStrong buy
Strong sellSellNeutralBuyStrong buy
Moving Averages
Neutral
SellBuy
Strong sellStrong buy
Strong sellSellNeutralBuyStrong buy
Displays a symbol's price movements over previous years to identify recurring trends.


