FEDERALBNK 1 Month Time Frame 📊 Current Price Snapshot
Federal Bank stock was trading around ₹270–₹280 recently.
🔑 Key Short‑Term Levels (1‑Month Timeframe)
🟢 Resistance Levels
These are price points where the stock may encounter selling pressure on the upside:
R1: ~₹283–₹286
R2: ~₹286–₹293
R3: ~₹293+
(Often use
Federal Bank Ltd. (India) Sponsored GDR
No trades
Next report date
—
Report period
—
EPS estimate
—
Revenue estimate
—
0.190 USD
491.94 M USD
3.75 B USD
About Federal Bank Ltd. (India)
Sector
Industry
CEO
Krishnan Venkat S. Manian
Website
Headquarters
Aluva
Founded
1931
IPO date
Mar 21, 1994
Identifiers
2
ISIN XS0229331755
The Federal Bank Ltd. (India) is a holding company, which engages in the provision of banking and financial services. It operates through the following segments: Treasury, Corporate or Wholesale Banking, Retail Banking, and Other Banking Operations. The Treasury segment includes trading and investments in government and corporate debt instruments, equity and mutual funds, derivative trading, and foreign exchange operations on proprietary account and for customers. The Corporate or Wholesale Banking segment provides loans and other banking services to corporate and other clients. The Retail Banking segment constitutes lending and other banking services to small business customers. The Other Banking Operations segment consists of income from parabanking activities such as third party product distribution and other banking transactions. The company was founded by Kulangara Paulo Hormis on April 23, 1931 and is headquartered in Aluva, India.
Related stocks

FEDERALBNKFEDERALBNK
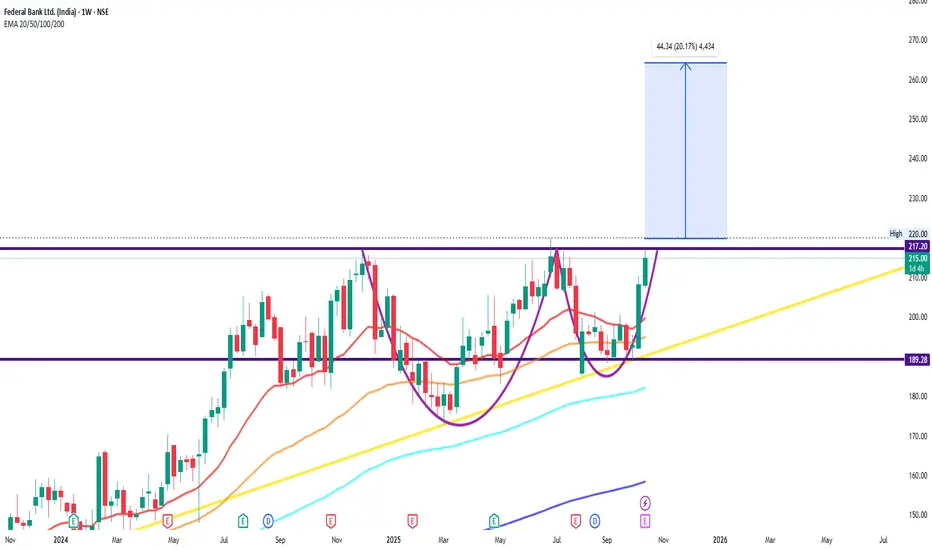
bullish trend is Showing on the chart.
buy signals in
technical indicators and
cup with handle chart pattern.
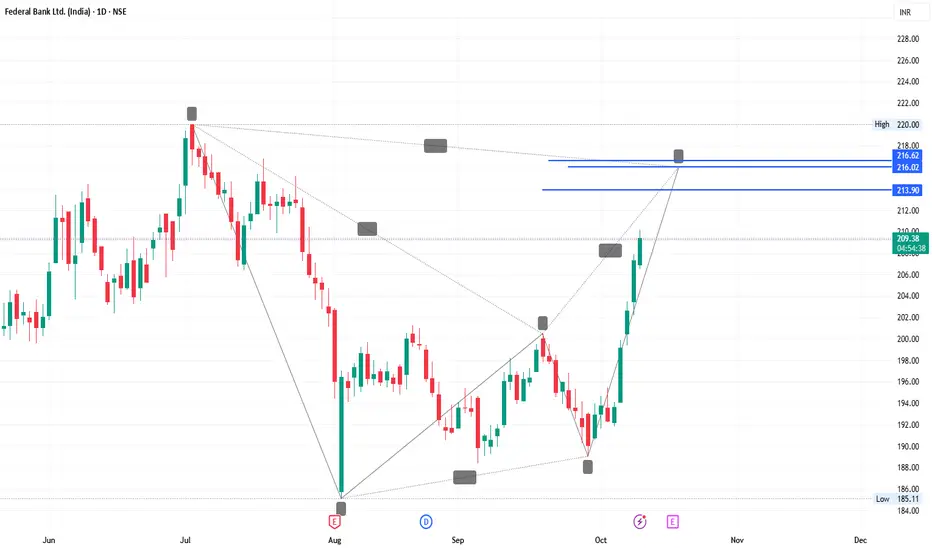
Watch for a breakout above 215/220 to sustain the bullish trend. If the resistance holds, there could be a retest towards 180/190 and an uptrend from here.
FEDERALBNK 1 Day Time Frame 📈 Key Data / Context
The stock currently trades in the ballpark of ₹258–260 / share.
Over the past 52 weeks, the share has ranged roughly between ₹172.66 (low) and ₹262.00 (high).
Fundamental metrics: P/E ratio around ~15–16×, book value ~ ₹147, and a modest dividend yield.
⚠️ What to Keep in Mi
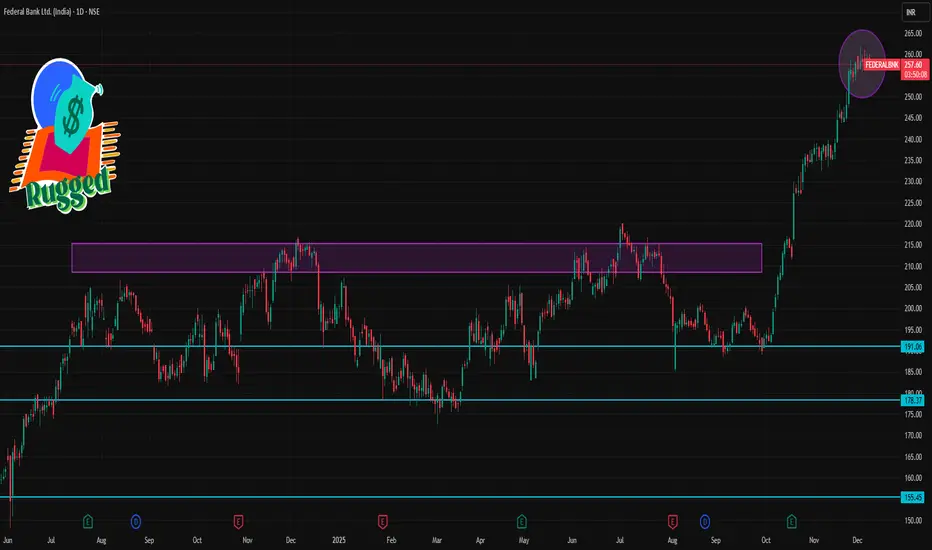
FEDERALBNK - Demand Zone on the Rise📌 Demand Zone
Demand Zone High: 258.80
Demand Zone Low: 253.75
The stock has just broken into a fresh 52-week high with a powerful expansion candle, supported by bullish volume and strong relative strength against the index. Momentum indicators such as RSI, CCI, and Stochastics are all in the overb

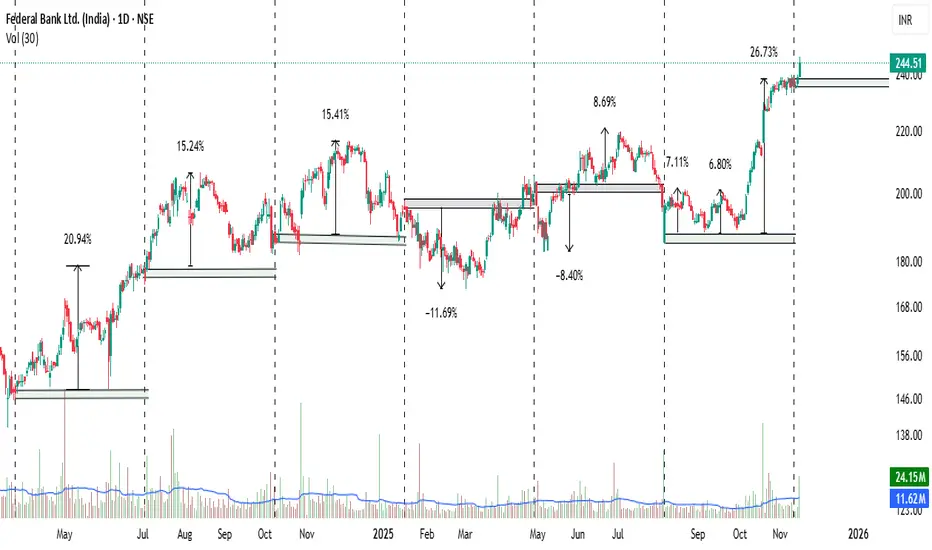
Federal Bank Ltd.(FEDERALBNK)Deriving the time cycle is a very easy process.
It's quite simple: find a high to low, low to high or high to high, low to low cycle of a good quality stock and try to understand whether the same time period acts as a reversal point or not. Use the Cyclic Line tool in Tradingview. If it works, ba
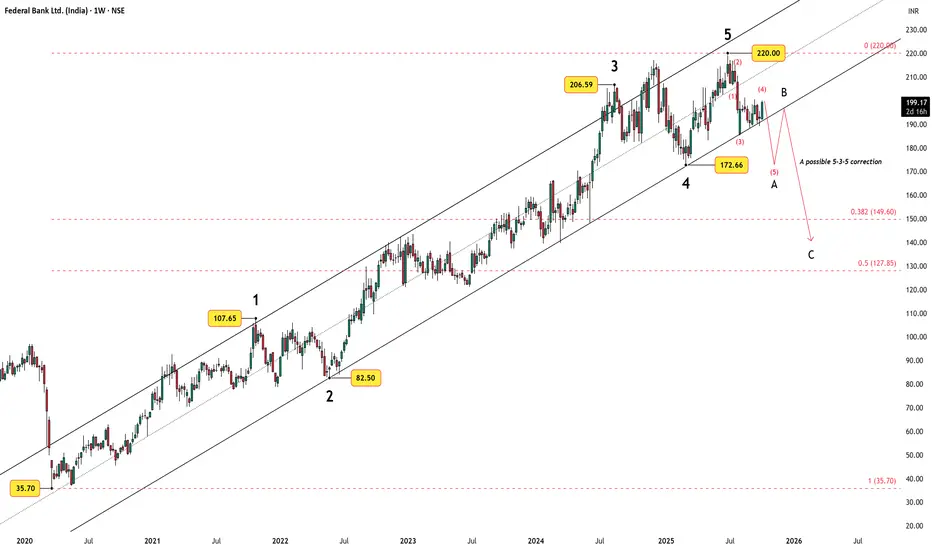
Federal Bank: Wave 4 Triangle Near Completion, Wave 5 AheadAfter a clean five-wave impulse from the 2020 low near ₹35.70 to the 2024 peak at ₹220, Federal Bank appears to be transitioning into a larger corrective phase.
Weekly Outlook
The broader structure suggests the start of a 5-3-5 zigzag correction , marked as A–B–C .
Wave A is still unfolding
Federal Bank-SellThe risk–reward ratio is favorable. Exit immediately if the price does not move as planned. It has reached a level where a significant number of sellers are active.

Federal Bank As per BAT Harmonic Pattern in Daily Time Frame.
Disclaimer
Information provided is for informational purposes only and should not be construed as investment advice or an offer to buy or sell securities. Investors are advised to carefully review all materials and consult with a financia
Fedral bank ltdweekly timeframe, Fedral bank ltd channel, cup and handle pattern, buy for target with strict stoploss as shown in chart.
Federal Bank continues to show strong fundamentals, prudent risk management, and stable growth despite facing recent profit challenges. Here are the key points from the latest

FEDERAL BANK : COMING OUT OF THE CONSOLODATION Federal bank is coming out of the one year consolidation with good volume.
The RSI is also above the 60 levels.
Banking sector outperforming the Nifty.
If stays above 215, 50 Rs move is possible in coming weeks.

See all ideas
Summarizing what the indicators are suggesting.
Neutral
SellBuy
Strong sellStrong buy
Strong sellSellNeutralBuyStrong buy
Neutral
SellBuy
Strong sellStrong buy
Strong sellSellNeutralBuyStrong buy
Neutral
SellBuy
Strong sellStrong buy
Strong sellSellNeutralBuyStrong buy
An aggregate view of professional's ratings.
Neutral
SellBuy
Strong sellStrong buy
Strong sellSellNeutralBuyStrong buy
Neutral
SellBuy
Strong sellStrong buy
Strong sellSellNeutralBuyStrong buy
Neutral
SellBuy
Strong sellStrong buy
Strong sellSellNeutralBuyStrong buy
Displays a symbol's price movements over previous years to identify recurring trends.