Federal Bank has 33% upside potentialFederal Bank 92 has given a good breakout and could be considered for target 120 with support 88.
PLEASE ALSO REFER OUR ENCLOSED EARLIER POSTINGS.
FEDS trade ideas

Federal Bank BearishFederal Bank 195 is in 5-0 Pattern movement. Currently it is moving in BC leg whose targets are 162,139. Short term trend suggests breakdown of 199 for which technical target is 179.
Moneycontrol
Federal Bank shares tumble 5% as Q1 profit dips: Should you buy, sell, or hold?
Aug 4, 2025, 08:15 GMT+5:302 min read
Morgan Stanley analysts were cautious. They gave the stock an “underweight” rating with a target price of Rs 165 per share. They expect the bank’s return on assets to moderate to 1 percent in FY26, given the rise in bad loans and credit costs from microfinance stress.


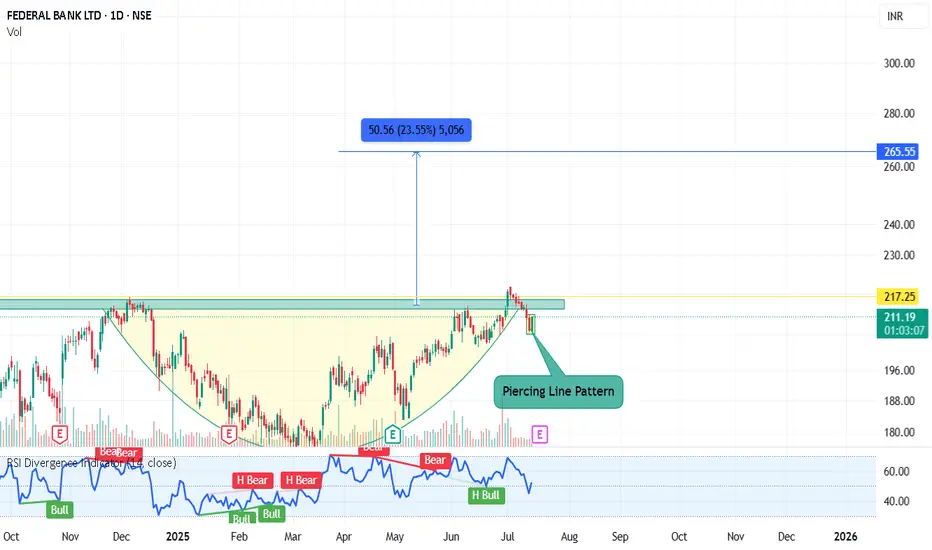
Piercing line pattern Federal BankPiercing line pattern seen on Federal Bank Chart
Price could reverse from here and again re-test the breakout level of 217.
If price sustain over breakout level, there are lot of chance to move up.
Keep watching..............
This is only for educational purpose and no any recommendation of trade.
Federal Bank Ltd. (FEDERALBNK)Federal Bank Ltd. (FEDERALBNK) can be considered a "silent performer" in the Indian banking sector due to its consistent growth and steady performance over the years, often under the radar compared to larger peers. Over the past 30 years, the stock has delivered significant returns, with historical 10X, 20X, and even 40X gains , as seen in the monthly chart analysis(Bigger Picture). Its business model, balancing retail, wholesale, and treasury operations, has fueled a robust credit book growth—retail credit up 78% and wholesale 15%.
Retail Banking: Offers a wide range of products like savings accounts, loans (personal, home, car, education), credit/debit cards, and fixed/recurring deposits, catering to individuals and small businesses. In FY 2024, the retail credit book reached ₹119,493 crore, with significant growth in personal loans (78%), credit cards, and microfinance (141%).
Wholesale Banking: Provides tailored financial solutions such as working capital loans, trade finance, forex services, and cash management to corporates, MSMEs, and government institutions. The wholesale credit business grew 15% to ₹95,083 crore in FY 2024.
Treasury Operations: Involves trading and investments in government securities, corporate debt, equities, mutual funds, derivatives, and forex, supporting both proprietary and customer needs.
Subsidiaries and Associates: Includes Fedbank Financial Services (FedFina) for secured lending, Federal Operations and Services (FedServ) for operational support, Ageas Federal Life Insurance (26% stake) for life insurance, and Equirus Capital (19.79% stake) for investment banking and wealth management.

Federal Bank - Cup & HandleFederal Bank: 212.5
SL: 203
Target: 255
Cup & Handle formation on Daily Time Frame

Federal Bank in Secondary test PhaseFederal Bank 208 is at secondary test phase .
As per Wycoff cycle Expected to drop to 202 and then bounce back to 214.

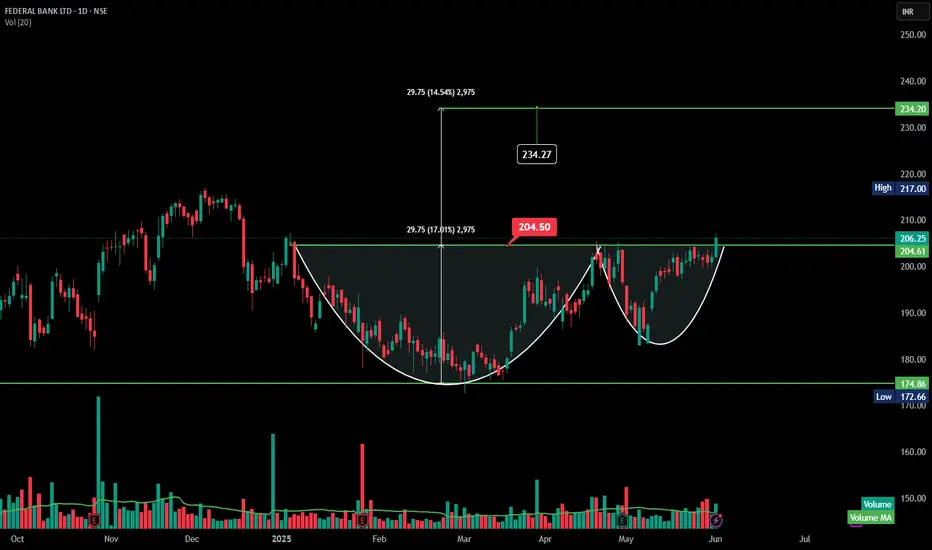
FEDERALBNK | Cup and handle |Breakout | Daily### **Technical Analysis of Federal Bank Ltd. (NSE)**
The **cup and handle** formations on **Federal Bank Ltd.'s** chart signal potential bullish momentum.
### **Key Observations:**
1. **Cup and Handle Patterns:**
- **First Formation:** A breakout suggests a potential move toward **234.27 INR** (+14.54%).
2. **Breakout Confirmation:**
- **Current Price:** **206.25 INR**, up **2.07% (+4.19 INR)**.
- **Resistance Level:** **217.00 INR**—break above this could accelerate gains.
- **Support Level:** 205 neckline
3. **Volume Trends:**
- **12.79M vs. 8.24M (Avg.)**—above average trading volume strengthens breakout validity.
FEDERAL BANK - Setting up for a BreakoutFederal Bank - Setting up for a Break out above 205. Good base at 175 - 180.
Good Relative Strength
Stop Loss 195 TGT 223/245.
Disclaimer - This is not a trading call and I am not a Sebi registered analyst.
Federal Bank LtdFederal Bank Ltd. is currently exhibiting strong bullish signals according to various technical indicators. Although the recent decrease in trading volume indicates a potential short-term consolidation, the overarching trend appears to be upward.
It is suggested that the price action be monitored closely for a potential entry point if the price surpasses 208, with an anticipated target of 230.
Amazing breakout on WEEKLY Timeframe - FEDERALBNKCheckout an amazing breakout happened in the stock in Weekly timeframe, macroscopically seen in Daily timeframe. Having a great favor that the stock might be bullish expecting a staggering returns of minimum 25% TGT. IMPORTANT BREAKOUT LEVELS ARE ALWAYS RESPECTED!
NOTE for learners: Place the breakout levels as per the chart shared and track it yourself to get amazed!!
#No complicated chart patterns
#No big big indicators
#No Excel sheet or number magics
TRADE IDEA: WAIT FOR THE STOCK TO BREAKOUT IN WEEKLY TIMEFRAME ABOVE THIS LEVEL.
Checkout an amazing breakout happened in the stock in Weekly timeframe.
Breakouts happening in longer timeframe is way more powerful than the breakouts seen in Daily timeframe. You can blindly invest once the weekly candle closes above the breakout line and stay invested forever. Also these stocks breakouts are lifelong predictions, it means technically these breakouts happen giving more returns in the longer runs. Hence, even when the scrip makes a loss of 10% / 20% / 30% / 50%, the stock will regain and turn around. Once they again enter the same breakout level, they will flyyyyyyyyyyyy like a ROCKET if held in the portfolio in the longer run.
Time makes money, GREEDY & EGO will not make money.
Also, magically these breakouts tend to prove that the companies turn around and fundamentally becoming strong. Also the magic happens when more diversification is done in various sectors under various scripts with equal money invested in each N500 scripts.
The real deal is when to purchase and where to purchase the stock. That is where Breakout study comes into play.
Check this stock which has made an all time low and high chances that it makes a "V" shaped recovery.
> Taking support at last years support or breakout level
> High chances that it reverses from this point.
> Volume dried up badly in last few months / days.
> Very high suspicion based analysis and not based on chart patterns / candle patterns deeply.
> VALUABLE STOCK AVAILABLE AT A DISCOUNTED PRICE
> OPPURTUNITY TO ACCUMULATE ADEQUATE QUANTITY
> MARKET AFTER A CORRECTION / PANIC FALL TO MAKE GOOD INVESTMENT
DISCLAIMER : This is just for educational purpose. This type of analysis is equivalent to catching a falling knife. If you are a warrior, you throw all the knives back else you will be sorrow if it hits SL. Make sure to do your analysis well. This type of analysis only suits high risks investor and whose is willing to throw all the knives above irrespective of any sectoral rotation. BE VERY CAUTIOUS AS IT IS EXTREME BOTTOM FISHING.
HOWEVER, THIS IS HOW MULTIBAGGERS ARE CAUGHT !
STOCK IS AT RIGHT PE / RIGHT EVALUATION / MORE ROAD TO GROW / CORRECTED IV / EXCELLENT BOOKS / USING MARKET CRASH AS AN OPPURTUNITY / EPS AT SKY.
LET'S PUMP IN SOME MONEY AND REVOLUTIONIZE THE NATION'S ECONOMY!
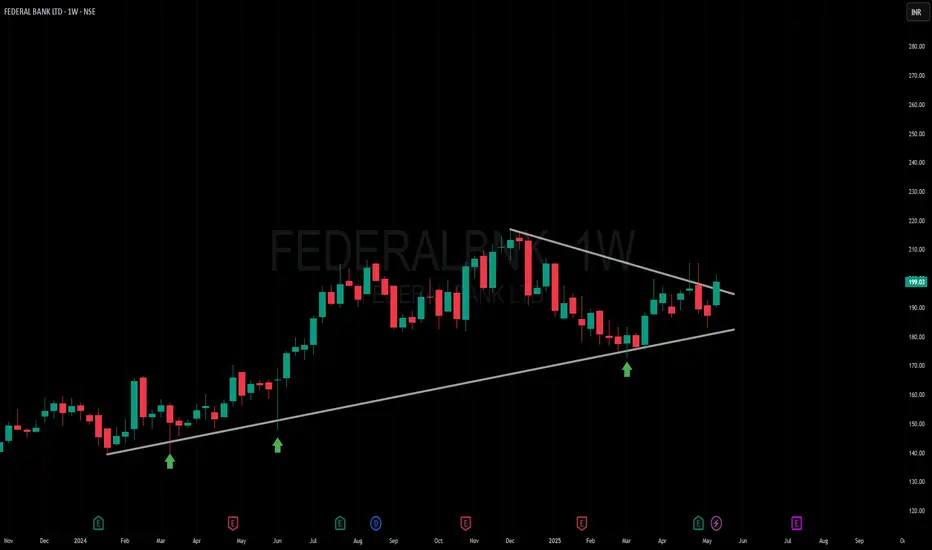
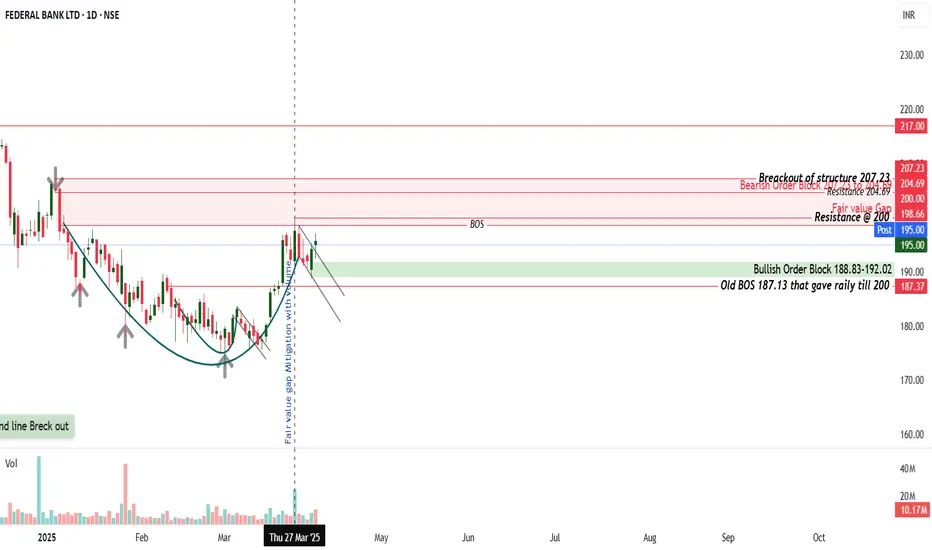
FEDERALBNK – Cup & Handle Pattern OutlookCup formation: ~₹214 (peak) → ₹174 (base) → recovery to ~₹200
Handle: Currently consolidating between ₹188.83–₹198.66
CMP: ₹194 (inside the handle zone + Bullish Order Block)
Key Levels to Watch:
₹187.13 Old BOS; support base for cup
₹188.83–₹192.02 Bullish Order Block
₹194.14 CMP: mid-handle, decent entry zone
₹198.66 BOS zone – handle breakout confirmation
₹204.69 Minor resistance (Bearish OB)
₹207.23 Structural Breakout level
₹214 Full pattern projection (depth-based target)
Strategy Plan (Post-Handle Breakout):
Entry Trigger: Break and close above ₹198
Entry Range: ₹198–₹200 (confirmation zone)
Target 1: ₹207.23
Target 2: ₹214 Full pattern projection (depth-based target)
Stop Loss: Below ₹192 (tight) or ₹188.50 (safe, below OB)
Disclaimer: This analysis is for educational and informational purposes only. It does not constitute financial advice or a recommendation to buy or sell any securities. Please do your own research or consult a financial advisor before making any trading decisions.
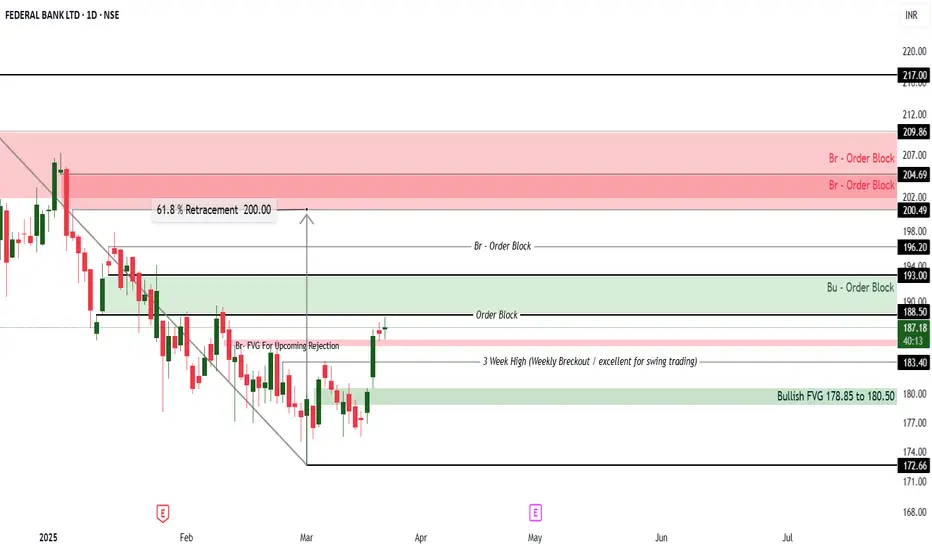
Swing Trading Idea for FEDERALBNK
Reason 1: Three-Week High Breakout – The stock has broken a significant three-week high, signaling a potential uptrend.
Reason 2: Strong RSI – The RSI is showing strength, currently at 57, which indicates momentum is in favor of buyers, with room to reach resistance near 68.
Reason 3: Daily Momentum – The daily movement shows positive momentum with a 2.61% rise, indicating a continuation of upward pressure in the short term.
Trade Setup:
Entry Point: Around 185.00 (current CMP), targeting a breakout continuation.
Target Price:
First Target: 200.00 (10% gain).
Second Target: 220.00 (20% gain), if the momentum continues.
Disclaimer: This is not financial advice and is for educational purposes only. Trading stocks involves risk, and you should carefully consider your risk tolerance and consult with a financial advisor before making any investment decisions. Past performance is not indicative of future results.
Federal Bank Ltd (NSE)Federal Bank Trade Setup - Key Levels to Watch! 📊🚀
Stock: Federal Bank Ltd (NSE)
Timeframe: 1D Chart
Current Price: ₹177.62
First Entry Level: Above ₹179.04
Stoploss: 173
Second Entry Level: 160
Stoploss: Below ₹156.03 (Strong support at ₹160.14)
🎯 Bullish Targets:
✅ ₹195.04
✅ ₹225.24 - ₹225.33 (Final Target)
🔻 Bearish Breakdown Levels:
⚠ ₹173.05 Breakdown → Next major support at ₹160.14 & ₹156.03

Federal Bank cmp 183.83 by Daily Chart viewFederal Bank cmp 183.83 by Daily Chart view
- Resistance Zone 197 to 202 Price Band
- Support Zone at 179 to 182.50 Price Band
- Volumes are spiking today thou on the selling side but seems demand buying is inching in
- Price needs to sustain closure over Rising Support Trendline hurdle at +/- 188 for fresh upside

FEDERAL BANKFEDERAL BANK chart is trading at ATH level ,whereas Banknifty is down around 2 % from ATH level. We can see good upmove in this stock. It breakout the ATH level on 19th Nov 2024 and now retested successfully.

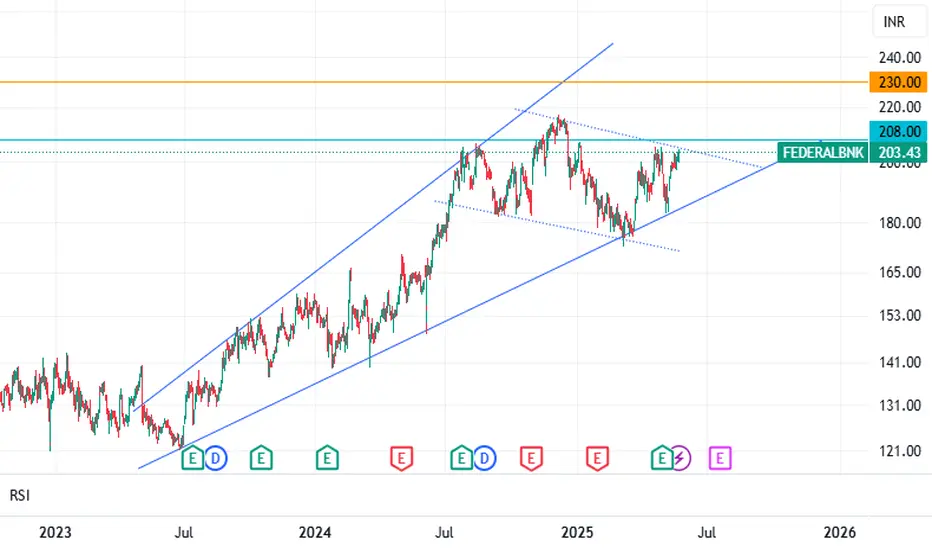
Federal Bank LTD.The chart for Federal Bank reveals a strong uptrend within a rising channel pattern, characterized by higher highs and higher lows. The stock is trading above key moving averages, including the 50-day MA (156.04), 100-day MA (153.38), and 21-day EMA (161.01), all of which are aligned positively, reflecting sustained bullish momentum. A recent increase in volume on upward price movements suggests strong buying interest. The RSI at 62.22 indicates that the stock has momentum but is not yet overbought, leaving room for further upside. The MACD also signals bullish momentum, with the MACD line crossing above the signal line and the histogram turning positive. The stock is approaching resistance near 212–215, and a breakout above this level with strong volume could lead to targets of 230–240. On the downside, key support levels are around 195–200 (the lower trendline of the channel) and the 21-day EMA (161). Traders can adopt a breakout strategy above 215 with a stop-loss at 200 or look for buying opportunities near support levels on pullbacks. While the trend is clearly bullish, traders should remain cautious if the stock fails to hold key support zones, as a break below 195 could signal a trend reversal.

VIEW ON FEDERAL BANKGood chart structure
Stock near all time high
Stock has given close above its consolidation upper range
Target 217/230
Stop loss 195
I am just representing my views
For educational purpose only.

Not a valid breakoutFederal Bank cmp 210
This is a negative set up. Two places of reversal one at the current zone and the other at 221. Negative divergence in RSI at the current zone and also it being positioned in the bear zone is telling me to be careful. The stock should again correct from there.

FEDERALBNK Tightness Near BO [Daily]FEDERALBNK is near a daily timeframe BO with good accumulation. This is one of the banks looking good right now, volume dry up is not ideal to be honest near BO, so the setup might be a bit risky.
Tightness is though good near the pivot point so can get in here with a 7-8% SL which will be just under the 50 DMA line.
HDFCBANK is also under watchlist as its nearing a large weekly base BO. As of now though, FEDERALBNK is showing strength first to move ahead.
RS numbers have improved from 58 to 71 in last 3 weeks. So we are buying improving strengt.
Let's see how this goes...

FEDERAL BANK#FEDERALBNK Multiyear
Breakout seen in Federal Bank + Retest is also done.
All details posted on chart.

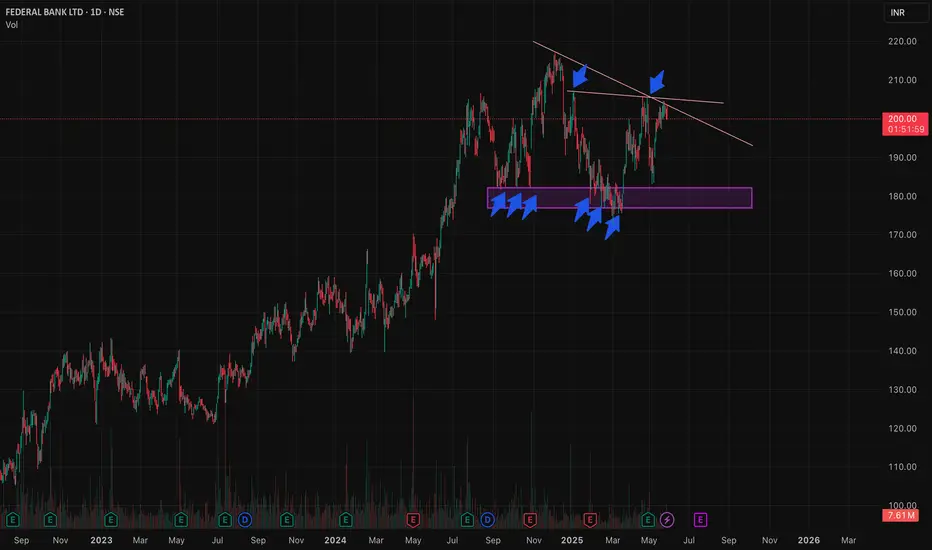
Federal Bank Looking Very Strong- Keep In Radar📊 Federal Bank Ltd
✅ The stock has successfully broken above a descending trendline that has been acting as resistance for the past few months. This breakout, accompanied by increased volume indicates strong buying interest and a potential shift in trend direction.
✅The recent price move was supported by a notable surge in volume, further validating the breakout. High volume on the breakout suggests that institutional investors may be involved which adds strength to the upward momentum.
✅ Federal Bank has established a solid support base around the 182-184 level which has held up well over multiple testing points. This level now acts as a floor limiting downside risk and providing a robust foundation for the stock’s upward move.
✅The RSI currently stands at 70 signaling strong bullish momentum without yet entering the extreme overbought zone. This suggests the stock has further upside potential as momentum builds.
🚨With the trendline breakout and volume confirmation, Federal Bank could target 215 in the short term, with a potential extended move towards 225 if the momentum continues. These targets align with historical resistance zones, making them realistic profit-taking levels.
🚨 The 192 support serves as a logical stop-loss level, providing a cushion against a potential pullback while allowing room for the trade to mature. Any close below this level would indicate a weakening of the bullish setup signaling an exit.

Federal Bank - Channel BreakoutFederal Bank :
Channel Breakout done
Sustaining 205 levels is crucial for strong upmove
