FEDS trade ideas

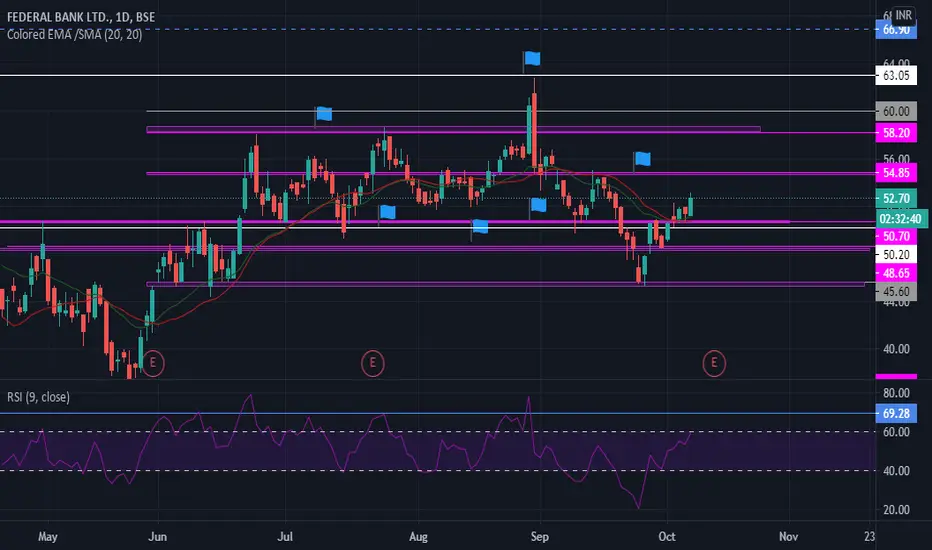
Federal Bank may once again touch 52-53Now the results are announced, so all the hypes towards results are no more. And looking at the daily chart , the price has touched the top of the rectangle channel and retracing back. More chances of hitting the bottom of the rectangle channel. Expiry is on 29th of this month. That time it may be a little positive, otherwise it may reach 52.


Federal bank nearing breakout Federal Bank if has formed Ascending Triangle. If there is a breakout you may see 60-63 levels in coming days. Stoploss will be 45-47 rs.

Strict SL, Strict Profit Booking. Major levels of Federal Bank.NSE:FEDERALBNK
The stock is consolidating hardly in some specific ranges. With a strict Stop Loss you can enter in to this trade. And take a clear profit booking at every stage.
You can re-enter, after seeing a bullishness in the specific levels.
It's a easy bet, maybe in my views.

Federal may break out from the ascending triangle soonFederal bank has resistance around at 51.90 and it has formed an ascending triangle in 15 minutes chart. Keeping the results in mind where everyone is expecting a decent one, it may break the 52 level soon and may start trading in the 53-54 zone


FEDERALBNK Buy opportunity at 49I will go LONG on FEDERALBNK because:
1) The price is forming a Chanel or Rectangle Pattern .
3) The price is also under Support/Resistance zone.
4) It has touched the support and may reach the resistance zone .
5) Target would be the Resistance area . Book profit when it reaches the resistance zone .
Entry - 49
Target - 57
Stop loss - 47.5

FEDERALBNK is Making Descending Triangle Pattern -Breakout TradeFederal Bank Limited : Private Banking Company ( NSE:FEDERALBNK ) is Making Descending Triangle Pattern (PATTERN BREAKOUT TRADE).
This can become a very good trade for INTRADAY traders.
Target + StopLoss: There is no target here. You keep the first target as much as the StopLoss you put. And the StopLoss will be the Low/High of the candle that broke this pattern. Or Low/High swing backward inside the pattern.
And as soon as you get a profit of 0.50% of your target, you will trail your StopLoss and bring it to the entry point. And as soon as your first target is hit, you will release half of your total quantity and continue to trail your StopLoss above the last swing Low/High.
Target and StopLoss are never already fixed in the chart pattern.
Thank you.
You always have to trade only by money management, position sizing, StopLoss trailing. This is the way to stay in profit.
Chart Published By Ravinder Sharma

FEDERALBNK is Making Ascending Triangle Pattern (Breakout Trade)Federal Bank Ltd: Private Banking Company ( NSE:FEDERALBNK ) is Making Ascending Triangle Pattern (PATTERN BREAKOUT TRADE). This can become a very good trade for intraday traders.
Target + Stop Loss: There is no target here. You keep the first target as much as the stoploss you put. And the stoploss will be the low/high of the candle that broke this pattern. Or low/high swing backward inside the pattern.
And as soon as you get a profit of 0.50% of your target, you will trail your stoploss and bring it to the entry point. And as soon as your first target is hit, you will release half of your total quantity and continue to trail your stoploss above the last swing low/high.
Target and stoploss are never already fixed in the chart pattern.
Thank you.
You always have to trade only by money management, position sizing, stoploss trailing. This is the way to stay in profit.
Chart Published By Ravinder Sharma

LONG FEDERAL BANK FOR TARGET OF 56 SL 49(This is purely for educational purpose, do not take trades bases on this. I am not certified Analyst. Consult your financial Advisor before making any trade related decisions. )
Long trade looking possible from the current chart levels.
Enter Between 50-51
Target 1 - 56
Target 2 - 59


Federal Bank looking strong for upside Federal Bank has been in accumulation zone for the last 40+ trading sessions, bouncing around the 50-58 rupees range. We had a good breakout over 60 rupees last week but with the negative news in the market with AGR uncertanity and Loan Moratorium. Bank Nifty stocks have taken quite a beating in the last 3-5 trading session from the recent high.
This is likely to be the case for a few more days until the Supreme Court comes to a decision on the Loan Moratorium in the coming weeks.
Keep a note of the volume spikes seen in Federal Bank. Federal Bank is in a very good position. Verify yourselves!


Potential downward trend in Federal Bank There is a potential downward trend in Federal Bank due to a recent bearish engulfing. Share price could fall to 52-53 ranges and then increase again.
View: Accumulate on every dip. Tgt @Rs 80


Massive volume in Federal Bank on 28th AugustBSE:FEDERALBNK Volumes have spiked to 130M during the Aug 28th Trading session.
Federal Bank showed a breakout with huge volume after weeks of consolidation between the INR50.00 to INR58.00
Expected Federal bank to reach next level of consolidation from the next trading week.
Banknifty saw gains of over 4% during the same trading session.
OANDA:USDINR fell against the rupee.


Federal Bank - Ascending Triangle bullish breakoutNote: This is for educational purpose only.
There is an ascending triangle bullish breakout with high volume. RSI is above 70 which indicates bullish momentum but there is a possibility of consolidation/ side ways movement to RSI to cool off before the next up-move. The breach of previous swing low will act as Stop loss level.

Super bullish - still retest possible. Price as expected took support at 50 levels and now trading at 60 levels meanwhile it breaks the big resistance levels and looking super bullish. But I am expecting a retest to the resistance level and break again to form new high.
Good to enter at retest levels only, not the time to enter buy trade in this levels.

Again it's a clear breakout on high volumesFEDERALBANK BUY@60, TARGET@67, SL@56
Here is a chance of retesting once @58 level so buy from 58 or if it takes a good momentum after the start of market then buy from CMP
It is a swing trade so the target is mostly achievable in a couple of days...or else you can also go for futures long according to your risk appetite.
All the best guys.
-MOHIT RAJANI
