Federal Bank Waiting for Federal Bank to give out a weekly closing above 150. Build initial positions now, add more post 150.
FEDS trade ideas

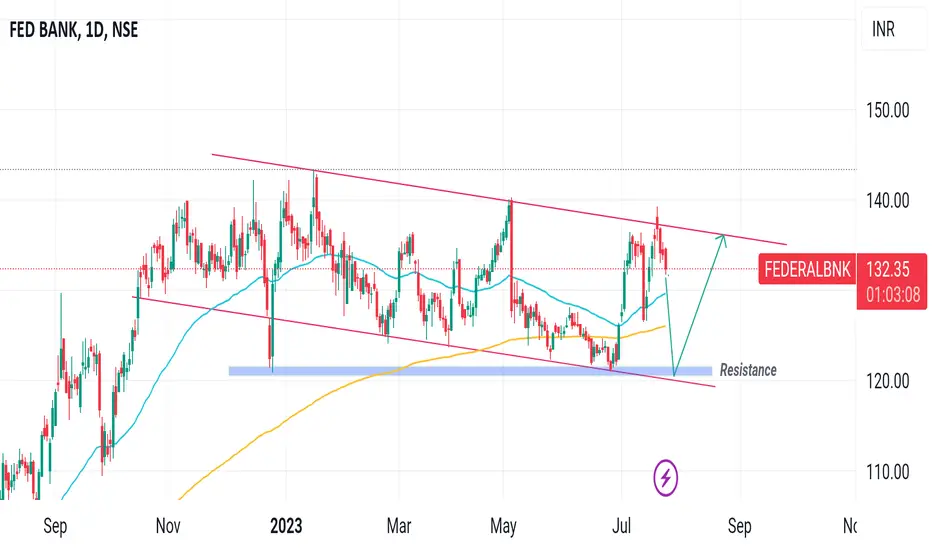
Federal Bank: Weekly Flag BOA weekly Flag and Pole Pattern is Visible on the Weekly charts of $NSE:FEDERALBNK. One can create a fresh position on Federal Bank around the CMP of Rs,. 136 or below with a stop loss of Rs. 120 for targets of 151/166/181
Exit the position if the stop loss is triggered on WCB.
DO YOU WANT ALL MY RESEARCH FOR FREE THEN DON'T FORGET TO FOLLOW ME.
I AM EAGERLY WAITING FOR YOUR COMMENTS ON THE STUDY...
Disclaimer: Content shared is for information and education purposes only and should not be treated as investment or trading advice. Please do your own analysis or take independent professional financial advice before making any investments based on your own personal circumstances. Investment in securities are subject to market risks, please carry out your due diligence before investing. And last but not the least, past performance is not indicative of future returns.


📈 Exciting Bullish Pattern Alert! 🐂📈 Exciting Bullish Pattern Alert! 🐂
📊 Pattern: Broadning Pattern
📌 Symbol/Asset: FEDBANK
🔍 Description: Buy on Dips
👉 Remember: Technical patterns are just one piece of the puzzle. Consider conducting further research, consulting with a financial advisor, and managing your risks appropriately.

📈 Exciting Bullish Pattern Alert! 🐂📈 Exciting Bullish Pattern Alert! 🐂
📊 Pattern: Triangle Breakout
📌 Symbol/Asset: FEDBANK
🔍 Description:
Moment Stock with Strong Breakout
👉 Remember: Technical patterns are just one piece of the puzzle. Consider conducting further research, consulting with a financial advisor, and managing your risks appropriately.

FEDERAL BANK keep it on your radarweekly chart is bullish, if breaks ascending triangular pattern, may show good results in Long terms.
* for educational purpose only


FEDERAL BANK BREAKOUTFederal Bank
Big Range Breakout + Consolidation Done
Buy At Cmp - 135.45
SL - 120 ( MCB )
Target - 199/219

FEDERALBNK ABOUT
The Federal Bank Limited (‘the Bank’) was incorporated in 1931 as Travancore Federal Bank Limited. It provides retail and corporate banking, para banking activities such as debit card, third party product distribution etc., treasury and foreign exchange business.
PROS
Company is expected to give good quarter
Company has delivered good profit growth of 27.6% CAGR over last 5 years
Does Federal reach resistance or not ?Make a buy order at 121.50 . If it reach resistance we have more to gain . Do Your Own Research and Buy . Stock market are subjected to financial risk.

Short term reversal in Federal Bank LtdAs per technical Analysis and OI Data Looks Like Federal Bank Ltd Will Face Resistance Near 137-138 considering This will go for Option Trading.
if its break 134-133.50 level then probably Federal Bank Ltd Will test 130-128 Level on Chart.
Buy Federal Bank Ltd 130 PE Aug
Buy Near 2.60
Investment Required 13000
Stop Loss - 1.60 Maximum Loss - 5000
Target- 5,6.50
Profit upto 19500
Only For Educational Purpose.

FEDERAL BANK - 40% ROI ?BUY - FEDERAL BANK
CMP - Rs. 128
Target - 1: Rs. 155
Target - 2: Rs. 185
.
.
Comment: Formation of Bullish Symmetrical Triangle
.
Follow me for more!

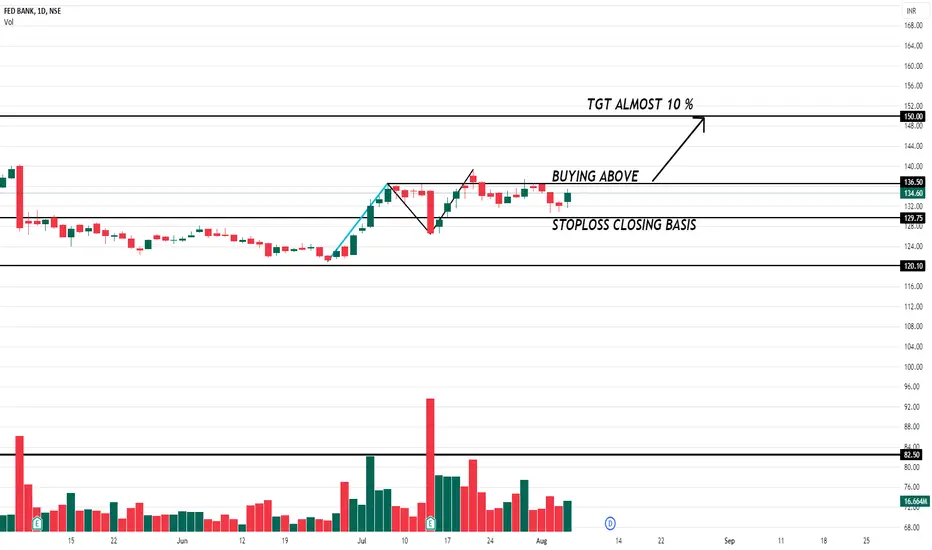
Federal Bank Breakout in Daily ChartFederal Bank Breakout in Daily Timeframe
Breakout Level: 128.00
Target Level: 135.50
Stop Loss Level: 121.00
Key Factors:
Trade above 200 EMA (Level: 124.70)
Today's Opening above Downside Trendline
Keep mind... if Today's closing above @128.00 then it's a Bullish run.

All time high resistance becomes supportAll time high levels once broken is indication of good upside to come.
Cherry on cake is when you see the same level being retested after breakout.
SL 120
Target (Open) 200 likely.

Federal Bank Weekly Charts Suggest Buy for 40% upsideFederal Bank Weekly Chart Suggest BUy with 40% upside in next 6-8 Months
LTP - 124
SL - 116
Targets - 170+
Timeframe 6-8 Months

Federal Bank Possibly A BreakOutHi all
Greetings!
i see a possible breakout in Federal Bank Daily Time Frame Charts.
Hoping for a good up move now as the stock has been a under performer in the current Nifty & Bank Nifty Rally.
Important Things
1. This is only for educational purposes only.
2. Never over trade.
3. Always keep Stop Loss.
4. Trade in limited quantity.
5. Taking a small loss is better than wiping up your whole capital.
I hope you found this idea helpful.
Please like and comment.
Share with Your Friends.
Keep Learning,
Happy & Safe Trading


Fed Bank: Possibly for a trend reversalFed bank looks like is ready for trend reversal. There looks like a 70% chance that the price is going to go down and test 110.00
Daily chart on the left side you can see few points that suggest price in the next coming days will be falling.
Monthly chart on the right side provides more confirmation with a wedge top and micro double top formation. Ideally a sloping bottom (black line) would have given us somewhat more confirmation that the price will go down but I believe it's still in the formation.
Please note, this analysis is purely on the basis of technical indicators and this is for educational purpose only.

federal bankReversal cup pattern is going to form in upcoming days. So definitely an downtrend momentum.
Target 1--118.75
Target 2--109
this for educational purpose only...

