Is it end of complexity?Reliance has under gone complex correction after
it had a spectacular rise in five wave which was terminated in october 21(2751)
after that though this high was crossed in april 2022(2856)
and nov 2022(2755) ,in both the occasion the break out could not sustain.
in nov 2022 x wave was terminated at the start of wave a as shown in the chart,
and now recently y wave was terminated at the end of wave a.
it appears its correction has ended,it is observed y wave has desired fibonnacci projection
of x wave(not shown in the chart).
The recent rally seems to be impulsive in lower time frame.
we have to watch as it appears its correction is over.
first we should look for break out of the channel to prove its impulsiveness.
just ignore 1 and 2 letters written in white that is for my convinience,
we should here look for a impulsive move being developed which should be confirmed
by the break out of the channel.
RIGD trade ideas

Reliance- SwingLook at the reversal candle stick pattern formed in Reliance. With nifty and Banknifty shiport term Trend changed looking to long Reliance. With Target of 2460 with April series.


Reliance could drop to a position 2290 levels it is evident that reliance is completed its wave 3 ( minor degree)
the minor wave 3 ( minor degree) it self is contained five sub waves ( minuet degree) completed
now wave 4 (minor degree) is in progress , according to EWP wave 4 correction could end near or at levels of sub wave 4 (minuet degree) of preceding wave 3 ( minor degree)
witch is at or near the levels of 2290 wich is also 38.2% level of retracement of wave 3 ( minor degree)

RELIANCEReliance is approaching towards March 2022's lows of 2180 which happens to be very strong & last support for Reliance.
If Indexes & Reliance had to bottom then 2180 (Reliance) 16745(Nifty) are strong levels.
Also, Reliance & Indexes are extremely oversold.
Could be bought with strict stoploss of 2175 & postional targets (if market bottoms here then) 2454
Risk:Rewaed in favour of bulls.

What can financial ratios tell us?In the previous post we learned what financial ratios are. These are ratios of various indicators from financial statements that help us draw conclusions about the fundamental strength of a company and its investment attractiveness. In the same post, I listed the financial ratios that I use in my strategy, with formulas for their calculations.
Now let's take apart each of them and try to understand what they can tell us.
- Diluted EPS . Some time ago I have already told about the essence of this indicator. I would like to add that this is the most influential indicator on the stock market. Financial analysts of investment companies literally compete in forecasts, what will be EPS in forthcoming reports of the company. If they agree that EPS will be positive, but what actually happens is that it is negative, the stock price may fall quite dramatically. Conversely, if EPS comes out above expectations - the stock is likely to rise strongly during the coverage period.
- Price to Diluted EPS ratio . This is perhaps the best-known financial ratio for evaluating a company's investment appeal. It gives you an idea of how many years your investment in a stock will pay off if the current EPS is maintained. I have a particular take on this ratio, so I plan to devote a separate publication to it.
- Gross margin, % . This is the size of the markup to the cost of the company's product (service) or, in other words, margin . It is impossible to say that small margin is bad, and large - good. Different companies may have different margins. Some sell millions of products by small margins and some sell thousands by large margins. And both of those companies may have the same gross margins. However, my preference is for those companies whose margins grow over time. This means that either the prices of the company's products (services) are going up, or the company is cutting production costs.
- Operating expense ratio . This ratio is a great indicator of management's ability to manage a company's expenses. If the revenue increases and this ratio decreases, it means that the management is skillfully optimizing the operating expenses. If it is the other way around, shareholders should wonder how well management is handling current affairs.
- ROE, % is a ratio reflecting the efficiency of a company's equity performance. If a company earned 5% of its equity, i.e. ROE = 5%, and the bank deposit rate = 7%, then shareholders have a reasonable question: why invest equity in business development, if it can be placed in a bank deposit and get more, without expending extra effort? In other words, ROE, % reflects the return on invested equity. If it is growing, it is definitely a positive factor for the company and the shareholders.
- Days payable . This financial ratio is an excellent indicator of the solvency of the company. We can say that it is the number of days it will take the company to pay all debts to suppliers from its revenue. If the number of days is relatively small, it means that the company has no delays in paying for supplies and therefore no money problems. I consider less than 30 days to be acceptable, but over 90 days is critical.
- Days sales outstanding . I already mentioned in my previous posts that when a company is having a bad sales situation, it may even sell its products on credit. Such debts accumulate in accounts receivable. Obviously, large accounts receivable are a risk for the company, because the debts may simply not be paid back. For ease of control over this indicator, they invented such a financial ratio as "Days sales outstanding". We can say that this is the number of days it will take the company to earn revenue equivalent to the accounts receivable. It's one thing if the receivables are 365 daily revenue and another if it's only 10 daily revenue. Like the previous ratio: less than 30 days is acceptable to me, but over 90 days is critical.
- Inventory to revenue ratio . This is the amount of inventory in relation to revenue. Since inventory includes not only raw materials but also unsold products, this ratio can indicate sales problems. The more inventory a company has in relation to revenue, the worse it is. A ratio below 0.25 is acceptable to me; a ratio above 0.5 indicates that there are problems with sales.
- Current ratio . This is the ratio of current assets to current liabilities. Remember, we said that current assets are easier and faster to sell than non-current, so they are also called quick assets. In the event of a crisis and lack of profit in the company, quick assets can be an excellent help to make payments on debts and settlements with suppliers. After all, they can be sold quickly enough to pay off these liabilities. To understand the size of this "safety cushion", the current ratio is calculated. The larger it is, the better. For me, a suitable current ratio is 2 or higher. But below 1 it does not suit me.
- Interest coverage . We already know that loans play an important role in a company's operations. However, I am convinced that this role should not be the main one. If a company spends all of its profits to pay interest on loans, it is working for the bank, not for the shareholders. To find out how tangible interest on loans is for the company, the "Interest coverage" ratio was invented. According to the income statement, interest on loans is paid out of operating income. So if we divide the operating income by this interest, we get this ratio. It shows us how many times more the company earns than it spends on debt service. To me, the acceptable coverage ratio should be above 6, and below 3 is weak.
- Debt to revenue ratio . This is a useful ratio that shows the overall picture of the company's debt situation. It can be interpreted the following way: it shows how much revenue should be earned in order to close all the debts. A debt to revenue ratio of less than 0.5 is positive. It means that half (or even less) of the annual revenue will be enough to close the debt. A debt to revenue ratio higher than 1 is considered a serious problem since the company does not even have enough annual revenue to pay off all of its debts.
So, the financial ratios greatly simplify the process of fundamental analysis, because they allow you to quickly draw conclusions about the financial condition of the company, without looking up and down at its statements. You just look at ratios of key indicators and draw conclusions.
In the next post, I will tell you about the king of all financial ratios - the Price to Diluted EPS ratio, or simply P/E. See you soon!

31st March || RELIANCE- Intraday Targets Marked #stocks #targetsAnalysis Criteria Used:
The analysis for the Intraday Trade ideas, has been done based on Trend analysis and Chart Patterns with Volume Buildups
Focus On:
1. Always keeping your Risk Management in play
2. Using a Stop Loss; because it is your Best Friend
3. Always Plan your Trade and stick to your Plan
4. Dont overthink or overanalyse
5. Treat this as your Business and get serious about it
#sharemarket #stockmarket #nifty #sensex #investing #trading #nse #bse #stockmarketindia #stocks #indianstockmarket #investment #stockmarketnews #banknifty #finance #money #intraday #intradaytrading #investor #niftyfifty #dalalstreet #sharemarketindia #sharemarketnews #stockmarketinvesting #business #sharemarkettips #stock #india #indiansharemarket #rakeshjhunjhunwala #bhfyp #mumbai #share #wealth #investment #market #invest #trading #investing #finance #FinancialFreedom #investor #trader #stocks #profit #investors #economy #equity #shares #nifty #stockexchange
DISCLAIMER:
*This is NOT a Tip OR a Recommendation but an analysis for Educational purposes Only
** Please do your own research and/or contact your financial advisor before taking any trading opportunities
*** We will not be responsible for your profit or loss
**** We are NOT SEBI REGISTERED
______________________
best stocks to buy today
best stocks to buy now
best stocks to buy
best stocks for Intraday tomorrow
best stocks for long term investment
best stocks to buy today india
best stocks for swing trading
swing trading strategies
swing trading beginners
what is swing trading
swing trading stocks
swing trading stock selection
swing trading kya hai
nifty analysis
nifty view
bank nifty analysis
top stocks to buy now
strong stocks
nifty view
nifty prediction
stock market view tomorrow
bank nifty Levels
bank nifty prediction
share news
stock market news
best stocks to buy now
profit booking stocks
multibagger stocks in discount
breakout stocks
best short term stocks
best short term shares
next multibagger stocks

RelianceAfter long time the stock has come near lower range of BB. It may be bought with small quantity if purchased for trading. Otherwise it is good level for long term accumulation. 1750 can be kept as SL for long term investor. Long term means more than 3 years minimum.
For trading buy small quantity with 3% SL. If turns favorable then add else take SL

#Reliance Price Action Analysis Stock bounced back from its demand zone or say crucial support in weekly TF, watch out level for further trade.
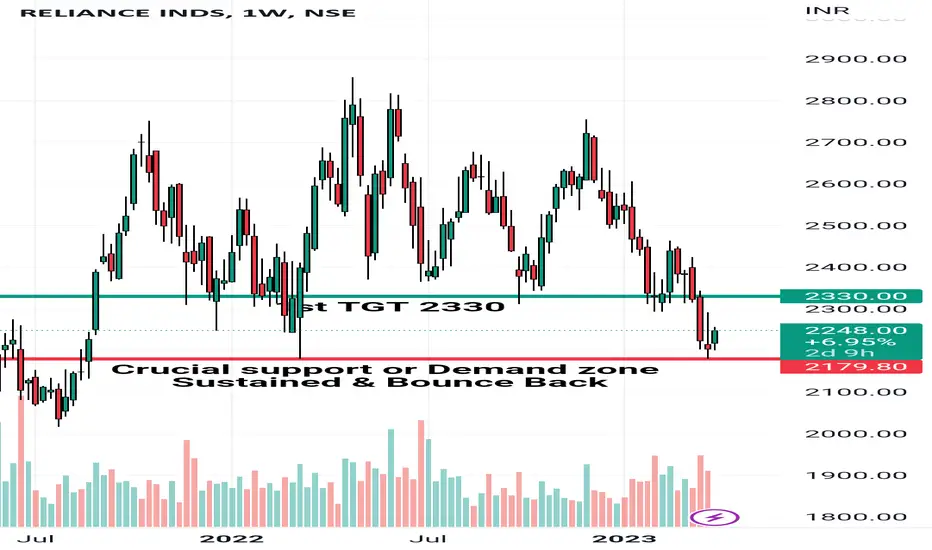
Reliance weekly TF analysis (March 29)current Trend: Double Bottom with morning star formation (need to wait it end of week for confirmation)
Two possibility:
1) reverse from this trend line support
(it consider as false break out from parallel channel and has high chance to reach top of
parallel channel(ST as of now)
2) if it breaks(major trend line is broken) it has protentional to reach 2000 level
Indicator:
1) 35 RSI is reversal point for Reliance in long term basics
2) MACD -Slight weakness found in histogram

#Reliance downtrend movement with risk:reward 4#Reliance downtrend movement with risk:reward 4
Symbol: Reliance
Time frame :4-hours chart
Analysis breakout from the symmetrical Triangle
Downtrend Movement
Checked the conditions for moving average, RSI and volume
Sell at 2196 with this stop loss 2295 and target 1830
HOPE our analysis is adding value to your Stock market trading Journey.
NOTE: Published Ideas are for ‘’EDUCATIONAL PURPOSE ONLY’’ trade at your own risk.
NOTE: RESPECT The risk. SL should not be more than 2% of the capital.
Happy Trading
#stockmarket, #sensex, #bse, #sharemarket, #nse #reliance

Great time to long RELIANCESupport Level at 2190
Daily Chart:
Formation of Bullish Harami
RSI at 40
Golden Crossover between RSI and SMA
Price near lower Bollinger Band
Weekly Chart:
Formation of Morning Star
Price near lower Bollinger Band
Monthly Chart:
Price near lower Bollinger Band

RELIANCE 🚀You can go with long Expected target 2365 and 2422.
Note : This is just for Backtesting and Educational Purpose Only.

Reliance Ready To Make New 52 Week Low!Reliance Faces Heavy Resistance Near ~ 210 Day EMAs. Delivery Based Selling Appears On Daily Chart. Sell Reliance ~ 2320, With Stop ~ 2373, Target ~ 2060, 2080. Expected Target March Expiry.

Reliance IndustriesReliance Industries:
CMP: 2,203
Crucial Line - 2170-2180
Blue line is crucial if it breaks on a weekly basis it can test yellow support zone.

3 RISING VALLEYHow to find the TGT of (3 RISING VALLEY) . .
Highest Price of 2nd Peak+((High Price of 2nd Peak-Low Price of 1st Valley)*0.58)
TGT 2652
2527+((2525-2311)*0.58) = 2652
SL 2480

Bullish Shark in RelianceBullish Shark in Reliance (SL on 15 min. candle close)
PRZ for Buy 1940
SL 1800
Target : 2095, 2245
CMP 2326.95 @ Feb 02, 2023
Chart by CA Savita Rehlan

Reliance industries at attractive priceLong position in Reliance industries can be initiated with a stop loss of 2150 on a daily closing basis.
Points considered:
It is trading at 2203 level which is lowest in last 18 months.
Taking support at horizontal support which has not been broken in a long time.
RSI near oversold zone.
Please do your own study before entering any position.

Institutional Buying Zone Looking at past data, it is visible that: whenever, reliance comes to this zone and breaks out, it rallies, candle after candle, and has given 18% and 30%
returns in almost 1 month. Reliance is at the same zone and at the bottom of market structure, it has formed 2 more bullish confirmations.
1. liquidity grab- Reliance broke the support zone and trapped short sellers and used that liquidity to burst out
2. Multiple Bearish Anomalies- As reliance approached the zone, it has a type of stopping volume, like a person slamming the brakes, red candles came with high volume but with very little downward price movement and started forming lower wicks.
Even a good time to buy for investments.
Target: 2754
Stop loss: 2180
Risk:Reward- 1:5
Keep It Simple


Hammer PatternHammer candlesticks typically occur after a price decline. They have a small real body and a long lower shadow.
The hammer candlestick occurs when sellers enter the market during a price decline. By the time of market close, buyers absorb selling pressure and push the market price near the opening price.
The close can be above or below the opening price, although the close should be near the open for the real body of the candlestick to remain small.
The lower shadow should be at least two times the height of the real body.
Hammer candlesticks indicate a potential price reversal to the upside. The price must start moving up following the hammer; this is called confirmation.
Script = Reliance
Time Frame = 1 Day
