Commodities and Alternative Assets1. Commodities
Definition
Commodities are raw materials or primary agricultural products that can be bought and sold. They are standardized and interchangeable, meaning one unit is essentially the same as another unit of the same grade. For example, one barrel of crude oil is equivalent to another
State Bank of India Sponsored GDR RegS
No trades
Next report date
—
Report period
—
EPS estimate
—
Revenue estimate
—
10.6 USD
9.17 B USD
77.85 B USD
About State Bank of India
Sector
Industry
CEO
Rana Ashutosh Kumar Singh
Website
Headquarters
Mumbai
Founded
1921
IPO date
Nov 3, 1994
Identifiers
3
ISIN US8565522039
State Bank of India engages in the provision of public sector banking, and financial services statutory body. It operates through the following segments: Treasury, Corporate/Wholesale Banking, Retail Banking, and Other Banking Business. The Treasury segment includes the investment portfolio and trading in foreign exchange contracts and derivative contracts. The Corporate/Wholesale Banking segment consists of lending activities of Corporate Accounts Group, Commercial Clients Group, and Stressed Assets Resolution Group that provides loans and transaction services to corporate and institutional clients and further include non-treasury operations of foreign offices. The Retail Banking segment refers to the retail branches, which primarily includes personal banking activities including lending activities to corporate customers. The Other Banking business segment focuses on the operations of all the non-banking subsidiaries and joint ventures of the group. The company was founded on January 27, 1921 and is headquartered in Mumbai, India.
Related stocks
What Are Leveraged Hedge Funds?Understanding Leverage in Simple Terms
Leverage means using borrowed capital to increase investment exposure.
For example:
A fund has $100 million in investor capital.
It borrows $200 million from a prime broker.
It now controls $300 million in investments.
Its leverage ratio is 3:1.
If the p
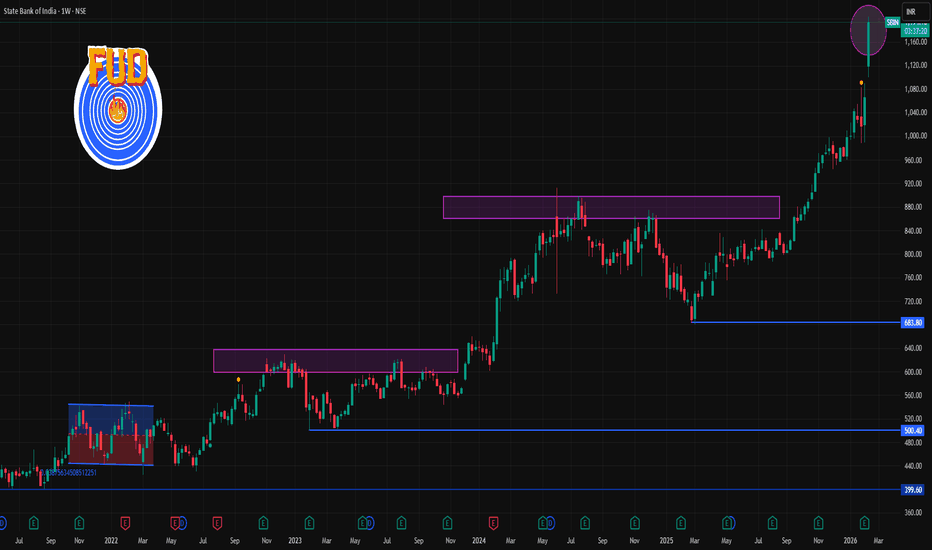
SBIN 1 Week Time Frame 📈 Current Trend & Price Context
Last traded price: ~₹1,192 – ₹1,195 on NSE.
Price is near its 52-week high around ~₹1,203.
Moving averages from technical services show a generally bullish bias with many Buy signals (*note: these are mostly daily / medium-term).
📊 Weekly Pivot & Key Levels (Approx)
BRICS Thriving: The Rise of a New Global Power Origins and Evolution of BRICS
The term “BRIC” was originally coined in 2001 by economist Jim O’Neill to describe fast-growing economies with the potential to reshape global growth. What began as an economic classification soon transformed into a political and strategic alliance. South Africa joine
The AI Revolution & Tech Sector Leadership: Impact on EquitiesThe Rise of AI-Centric Market Leadership
The AI boom has accelerated leadership concentration within mega-cap technology companies. Firms such as NVIDIA, Microsoft, Alphabet, and Amazon have become central pillars of equity index performance due to their direct exposure to AI infrastructure, cloud
Reserve Currency Dominance: Meaning, Mechanisms, and ImplicationWhat Makes a Currency a Reserve Currency?
For a currency to become dominant, several structural conditions must exist:
Economic Size and Trade Influence
The issuing country must have a large, productive, and globally integrated economy. Nations prefer holding reserves in currencies linked to econo
Bonds and Fixed Income InstrumentsIntroduction to Bonds and Fixed-Income Instruments
Bonds and fixed-income instruments are debt securities issued by governments, corporations, and financial institutions to raise capital. When an investor purchases a bond, they are effectively lending money to the issuer in exchange for periodic in
See all ideas
Summarizing what the indicators are suggesting.
Neutral
SellBuy
Strong sellStrong buy
Strong sellSellNeutralBuyStrong buy
Neutral
SellBuy
Strong sellStrong buy
Strong sellSellNeutralBuyStrong buy
Neutral
SellBuy
Strong sellStrong buy
Strong sellSellNeutralBuyStrong buy
An aggregate view of professional's ratings.
Neutral
SellBuy
Strong sellStrong buy
Strong sellSellNeutralBuyStrong buy
Neutral
SellBuy
Strong sellStrong buy
Strong sellSellNeutralBuyStrong buy
Neutral
SellBuy
Strong sellStrong buy
Strong sellSellNeutralBuyStrong buy
Displays a symbol's price movements over previous years to identify recurring trends.
770SBI38
State Bank of India 7.7% 19-JAN-2038Yield to maturity
8.34%
Maturity date
Jan 19, 2038
834SBIPERP
State Bank of India 8.34% PERPYield to maturity
7.92%
Maturity date
—
772SBIPER
State Bank of India 7.72% PERPYield to maturity
7.57%
Maturity date
—
751SBI32
State Bank of India 7.51% 06-DEC-2032Yield to maturity
7.32%
Maturity date
Dec 6, 2032
772SBI31
State Bank of India 7.72% PERPYield to maturity
7.30%
Maturity date
—
798SBIPERP
State Bank of India 7.98% PERPYield to maturity
7.26%
Maturity date
—
733SBI39
State Bank of India 7.33% 20-SEP-2039Yield to maturity
7.20%
Maturity date
Sep 20, 2039
755SBIPERP
State Bank of India 7.55% PERPYield to maturity
7.20%
Maturity date
—
775SBIPER
State Bank of India 7.75% PERPYield to maturity
7.15%
Maturity date
—
754SBI38
State Bank of India 7.54% 01-AUG-2038Yield to maturity
7.07%
Maturity date
Aug 1, 2038
680SBI35
State Bank of India 6.8% 21-AUG-2035Yield to maturity
6.07%
Maturity date
Aug 21, 2035
See all SBID bonds


