CRUDE OIL is nearing its major resistanceAs per my research and analysis. Crude oil turns to bearish once it reaches the level s around 6830 . Its just my View I am not advising anyone to buy/sell on this levels. Its just for educational purpose only. Based on my 13 years of experience in financial market I realised this levels. So trade on your own analysis.
Trade ideas

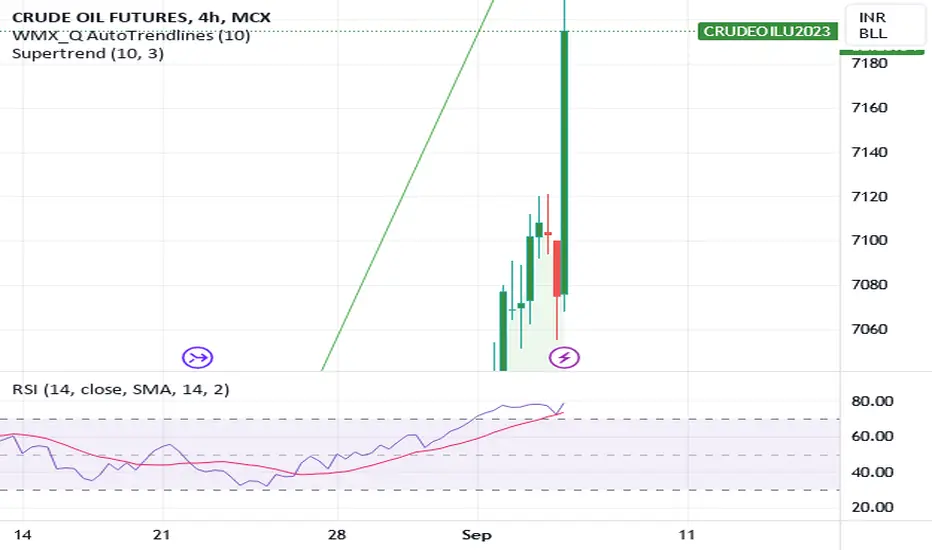
cude oil ready to blast Crude oil MCX price on neo wave suggest hat crude will get double from here in 3 months
this will benefit all oil companies

CrudeOil Important Levels to watch !! CrudeOil important levels to watch are as follows
#Support: 7190
Sell below: 7190 only on 15 minute candle closure below the level.
Target 1: 7100
Target 2: 6970
#Resistance: 7300
Buy Above: 7300 only on 15 minute candle closure Above the level.
Target 1: 7370
Target 2: 7480
#Demand Zone: 7060-7090 may act as a immediate buying zone, and price may bounce from the region marked in green on the chart.
#Remember each level will act as a support and resistance individually so there is a probability of reversal on either side. Please do your own research before initiating any trade. Always keep stoploss in order to protect your capital.
Follow us for more such information and educational ideas. Give it a like if you appreciate the idea. Queries will be answered in comment section.

silver or mcx crude update blwtold sell 72800 silver low made 72200 or gvn 75000 or 76700 also chk here or crude also gvn 7030 abv buy or 7220 also high 7285 recnt yestrday high 7300 hope u enjoyed or not... nxt move ready dont stuck in sell side -- crude silver spot also rockk

crude mcx sustain abv 7220 looks 7280-7340 expectcrude mcx sustain abv 7220 looks 7280-7340 expect spot abv 87 looks 89+++ may be it last leg of bull will more update soon

crude styaabv 7121 sudden bounce but looks up side crude styaabv 7121 sudden bounce but looks up side yes looks 7250--7340++++ expect wti abv 85.55 abv 87--89++++ looking sharp upp side
Fuel Your Wealth with CrudeOil !! CrudeOil important levels to watch are as follows
#Support: 7050-7055
Sell below: 7050 only on 15 minute candle closure below the level.
Target 1: 7000
Target 2: 6950
#Resistance: 7080
Buy Above: 7080 only on 15 minute candle closure Above the level.
Target 1: 7125
Target 2: 7190
#Demand Zone: 6960-6990 may act as a immediate buying zone, and price may bounce from the region marked in green on the chart.
#Remember each level will act as a support and resistance individually so there is a probability of reversal on either side. Please do your own research before initiating any trade. Always keep stoploss in order to protect your capital.
Follow us for more such information and educational ideas. Give it a like if you appreciate the idea. Queries will be answered in comment section.

crude mcx or spot update blwcrude blw 7050 if sustain thna mkt fall7032--6980++ out where 85$ blw spot looks 84.60-84$ yes if hold blw lvl sell on rise must profit booking expectedd

Crude🌟 sell below 7050 stop 7090Tgt1 7020
Tgt2 6980
Tgt3- 6940
Crude today start sell side..try sell below only 7050

crud einterday up date blwsmall risk---- sell crude 7066@--75 sl 7093 tgt 30-50+++ point or more but over all uppp its profit booking looks as per bear chart pattern

Fuel your Wealth with crude oil !! Crudeoil important levels to watch are as follows.
Currently, CrudeOil is moving in a parallel channel since 23rd August. Meanwhile current important levels are as follows.
#Support: 6750
Sell below: 6750 only on 15 minute candle closure below the level, next immediate support can be expected at day Low which is marked in dashed line.
Target 1: 6690
Target 2: 6640-6420
#Resistance: 6771
Buy Above: 6771 only on 15 minute candle closure Above the level.
Target 1: 6820
Target 2: 6875-6890
#Demand Zone: 6600-6630 may act as a immediate buying zone, and price may bounce from the region marked in green on the chart.
#Remember each level will act as a support and resistance individually so there is a probability of reversal on either side. Please do your own research before initiating any trade. Always keep stop-loss in order to protect your capital.
Follow us for more such information and educational ideas. Give it a like if you appreciate the idea. Queries will be answered in comment section.

crude spot or mcx crucial update blewcrude spot stya abv 85.55$ in mcx 7030 sustain abv than expect tgt 87--89 in mcx 7080--7170++++ yes buy on dipss withh tight sl

Bearish Crab In Crude OilBearish Crab In Crude Oil
Sell PRZ - 6919/6923
SL - 6955
Target - 6878/6850


crude stay abv 6800 buy on dipss tgt 6900-6950+crude stay abv 6800 buy on dipss tgt 6900-6950+ yes on daily chart breakout showing zoom already gvn 6666 abv slo or crude spot abv 80.65 it will rockk only soon 83--85$

CrudeOil Important Levels to watch !!Crudeoil important levels to watch are as follows
#Support: 6420
Sell below:6420 only on 15 minute candle closure below the level.
Target 1: 6350
Target 2: 6240
#Resistance: 6560
Buy Above: 6560 only on 15 minute candle closure Above the level.
Target 1: 6630
Target 2: 6760
#Demand Zone: 6450-6420 act as a immediate buying zone, and price may bounce from the region marked in green on the chart.
#Supply Zone: 6680 - 6630 may act as an immediate selling zone, and price may reject from the region marked in red on the chart.
#Remember each level will act as a support and resistance individually so there is a probability of reversal on either side. Please do your own research before initiating any trade. Always keep stoploss in order to protect your capital.
Follow us for more such information and educational ideas. Give it a like if you appreciate the idea. Queries will be answered in comment section.

Possible short in crude oilCrude oil is forming a slightly inclined head and shoulder pattern but it is still a clear pattern. The target is quite low as measured from the pattern. There is a small support before the target and that is the place where we can get some halt which is around 6334. But apart from that the target aligns nicely with a support level from where we can expect a good bounce. 6550 could be a great entry if it arrives, though the current levels are not too bad either to take a staggered entry using the mini lots.

crude oil (mcx) new udateprice got rejected from dotted ascending trend line
previously we have decide to go long on crude as there was good setup as per smc
but price didnt came to our buying limits
and a sudden gap down creates a panic and price got sold out
now price has breached first higher time frame demand
and halting at non mitigated level which is another higher time frame demand
follow the price structure by lower high and lower lows
6460 and rd fig 6400 is a support last defence line for buyer will be 6300


How to trade ICT Concepts in Indian Markets.This is a demonstration of making executions on the MCX on CrudeOil Mini Futures that are INR denominated derivative contracts of the WTI Futures contracts that are traded on the NYMEX.
Any trader in India who wants to trade the ICT concepts on international markets without setting up a foreign brokerage account can try to do so using the Commodities futures traded on the MCX. The price fluctuation of the USDINR leaves you a little bit exposed to some moves. However, most of the time, you can see a near perfect correlated move in both WTI and MCX:CRUDEOILM1!
This is a demonstration using Paper Trading on TradingView.com. Please don't try to randomly trade any strategy using actual money.
Remember you only risk what you can afford to lose in a responsible manner. It's all on you. You can't come after me if you try this with live funds and lose money. This is something to test.

Crude oil Expected ResistanceAs per research and analysis crude oil will become bearish once it reaches the level 7084 major sell trend will continue once it reaches the level . I am not advising anyone to buy / sell at these levels so just take it as a view

Crudeoil important levels to watch !
Crudeoil important levels to watch are as follows
#Support: 6600
Sell below: 6600 only on 15 minute candle closure below the level.
Target 1: 6550
Target 2: 6490
#Resistance: 6675
Buy Above: 6675 only on 15 minute candle closure Above the level.
Target 1: 6730
Target 2: 6790-6810
#Demand Zone: 6600-6630may act as a immediate buying zone, and price may bounce from the region marked in green on the chart.
#Supply Zone: 6815-1790 may act as an immediate selling zone, and price may reject from the region marked in red on the chart.
#Remember each level will act as a support and resistance individually so there is a probability of reversal on either side. Please do your own research before initiating any trade. Always keep stoploss in order to protect your capital.
Follow us for more such information and educational ideas. Give it a like if you appreciate the idea. Queries will be answered in comment section.

Crudeoil buy mode strong🌟buy 6518stop 6430 tgt 6600next 6700Huge upside from here ..6600next 6700 tgt....strong bullish
