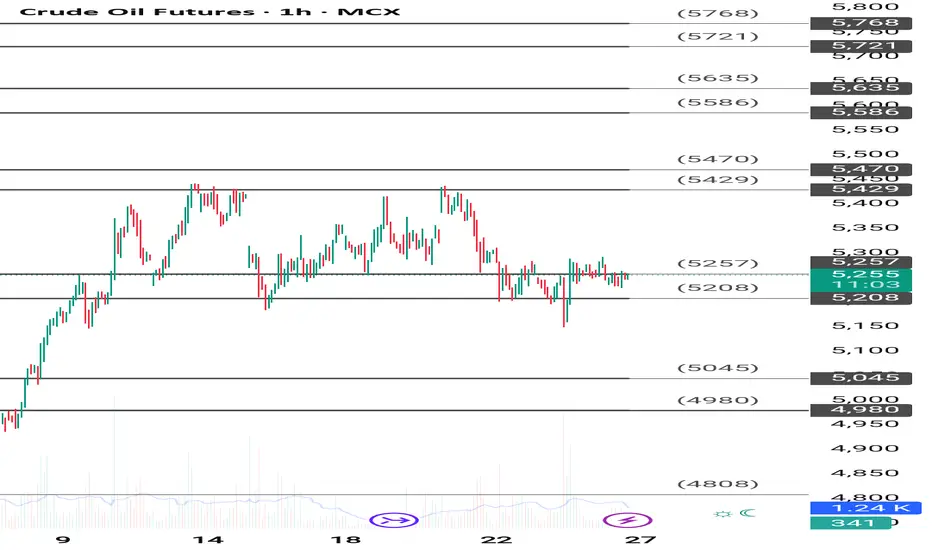
Crude mcx updated levels better to avoid buying at current priceHow My Harmonic pattern projection Indicator work is explained below :
Recent High or Low :
D-0% is our recent low or high
Profit booking zone: D13% -D15% is
range if break them profit booking start on uptrend or downtrend but only profit booking, trend not changed
SL reversal zone : SL 23% and SL 25% is reversal zone if break then trend reverse and we can take reverse trade
Target : T1, T2, T3, T4 and .
Are our Target zone
Oil Futures
No trades
Market insights
Institutions Option Database Trading Part-6Deep Dive into Options Basics (For Data Traders)
Options are contracts giving the right but not the obligation to buy or sell an asset at a certain price before a set date. They are used for hedging, speculation, and generating income.
🛠️ Two Types:
Call Option: Right to buy an asset.
Put Option: Right to sell an asset.
Backtesting means testing a strategy using past data to check performance. Key for data-driven option trading.
Example:
Load 1-year option chain data for BANKNIFTY.
Apply rules: Buy Call when IV drops by 10% & PCR < 0.8.
Check PnL for each trade.
Filter for success rate > 65%.

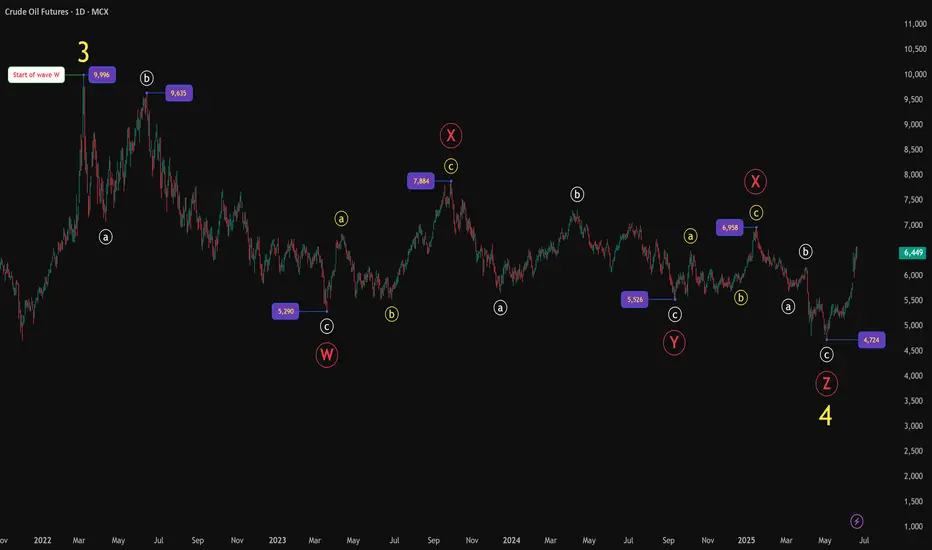
MCX Crude Oil: Complex Correction Complete?Big Picture Structure — Daily Timeframe
After peaking at 9996, Crude Oil entered a prolonged complex corrective phase, unfolding as a W-X-Y-X-Z structure, reflecting a Elliott Wave complex correction pattern.
Wave W formed via an initial abc decline.
Wave X delivered a corrective bounce.
Wave Y unfolded into another abc leg down.
A second X followed, creating further complexity.
Finally, Wave Z completed with a terminating abc decline, bottoming near 4724.
With this, the entire larger degree Wave 4 correction appears to have completed, setting the stage for a potential higher-degree advance.
Zoom In — 4H Timeframe Analysis
Zooming into the rally from 4724, price action unfolds very cleanly:
A strong 5-wave impulsive advance has developed.
Wave 3 displayed strong extension — a healthy sign of impulsive strength.
Wave 5 pushed to a higher high near 6585, completing a likely Wave (1) at smaller degree.
Notably, the final leg of this upmove developed with RSI bearish divergence, often an early warning of short-term exhaustion, suggesting a corrective Wave (2) pullback may now be developing.
Outlook Ahead
With higher degree Wave 4 likely behind us, attention shifts to the ongoing development of the larger degree Wave 5.
A corrective Wave (2) pullback may offer attractive entry zones for the next bullish impulsive leg.
As long as price maintains structural integrity above the 4724 low, the broader bullish outlook remains intact.
Summary
Complex W-X-Y-X-Z correction likely complete.
New bullish sequence underway.
Short-term corrective pullback (Wave 2) anticipated.
RSI divergence signals caution for immediate upside, but larger bullish trend remains intact.
Chart will be updated as price action evolves.
Disclaimer :
This analysis is for educational purposes only and does not constitute investment advice. Please do your own research (DYOR) before making any trading decisions.
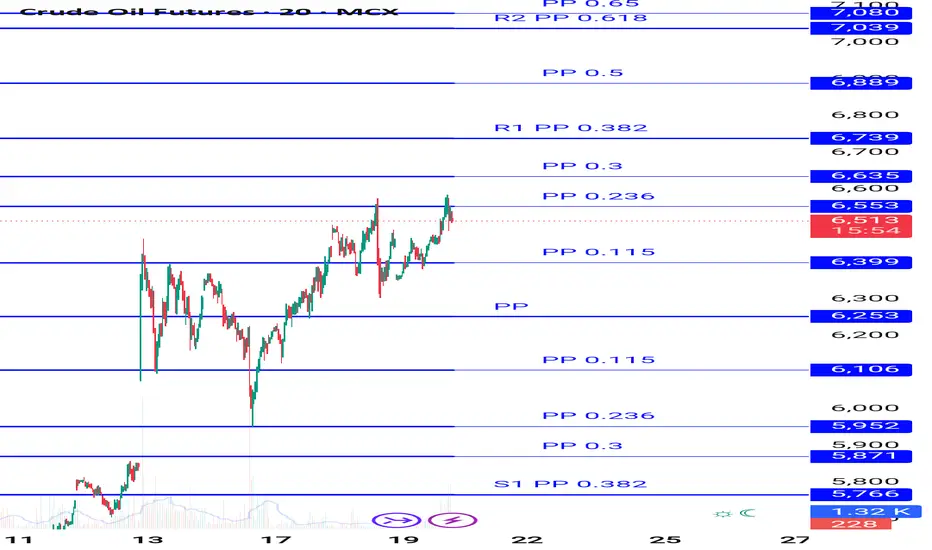
Crude showing some negative pattern avoid buying near 6530 How to take trades using Harmonic pattern projection Trade setup is explained below :-
Entry : 1st SL point : 0% is recent top or bottom.
Trailing D: 15.1% is work as trailing SL of buy or sell trade if hit then we have to book profit
.If price goes below 2nd D 22.5% to 24.5% range then early traders can make fresh reversals trade after breaking 1st D 15.1% safe traders can reversal trade after breaking Point D 22.5.4% to 24.5% range
Targets :
Target T1 : 36.1% to 38.3%
Target T3 : 49.1% to 52.5%
T3: 60.9% to 64.8% is our 3rd Target since this is reversal zone so must book profit if break then take fresh trade again
Target T4 : 76.4% to 79.7%
Next Targets are 100% , 127.2% ,141.4% and final Target 161.8%.
How to take reversal trade :
If price going upside/ downside then then buy or sell levels appear on Chart ( Automatically show when price reach any reversal zone of harmonic projection ).
Trailing SL:
After reach 1st Target trail SL to just above or below cost ( for example we are holding sell trade from 100 1st Target 110 hit then move trailing sl to 104-105 and move SL as price move upside or Downside)
Re- Entry :
For Re-entry in any pull back Point D ( 15.1% ) is used for re-entry then SL recent high or low Point SL ( 0% ) .
Blue Line is 1st support/ Resistance
Green line is 2nd support/ resistance
Red line is 3rd Support/ resistance
Advanced Institutions Option Trading - Part 8Institutional Option Trading Strategies
Let’s dive deeper into how big players operate:
🔶 Volatility Arbitrage:
Take advantage of IV mispricing across strikes/months.
Long low IV, short high IV – Net neutral delta.
🔶 Dispersion Trading:
Buy individual stock options, short index options.
Profit from correlation divergence.
🔶 Box Spread (Synthetic Arbitrage):
Arbitrage between synthetic long/short positions.
Very low risk, used by HFT desks.
Institutions use algorithms to run thousands of such strategies in real time.

Crude oil updated levels buy on dip at support How to take trades using Harmonic pattern projection Trade setup is explained below :-
Entry : 1st SL point : 0% is recent top or bottom.
Trailing D: 15.1% is work as trailing SL of buy or sell trade if hit then we have to book profit
.If price goes below 2nd D 22.5% to 24.5% range then early traders can make fresh reversals trade after breaking 1st D 15.1% safe traders can reversal trade after breaking Point D 22.5.4% to 24.5% range
Targets :
Target T1 : 36.1% to 38.3%
Target T3 : 49.1% to 52.5%
T3: 60.9% to 64.8% is our 3rd Target since this is reversal zone so must book profit if break then take fresh trade again
Target T4 : 76.4% to 79.7%
Next Targets are 100% , 127.2% ,141.4% and final Target 161.8%.
How to take reversal trade :
If price going upside/ downside then then buy or sell levels appear on Chart ( Automatically show when price reach any reversal zone of harmonic projection ).
Trailing SL:
After reach 1st Target trail SL to just above or below cost ( for example we are holding sell trade from 100 1st Target 110 hit then move trailing sl to 104-105 and move SL as price move upside or Downside)
Re- Entry :
For Re-entry in any pull back Point D ( 15.1% ) is used for re-entry then SL recent high or low Point SL ( 0% ) .
Blue Line is 1st support/ Resistance
Green line is 2nd support/ resistance
Red line is 3rd Support/ resistance
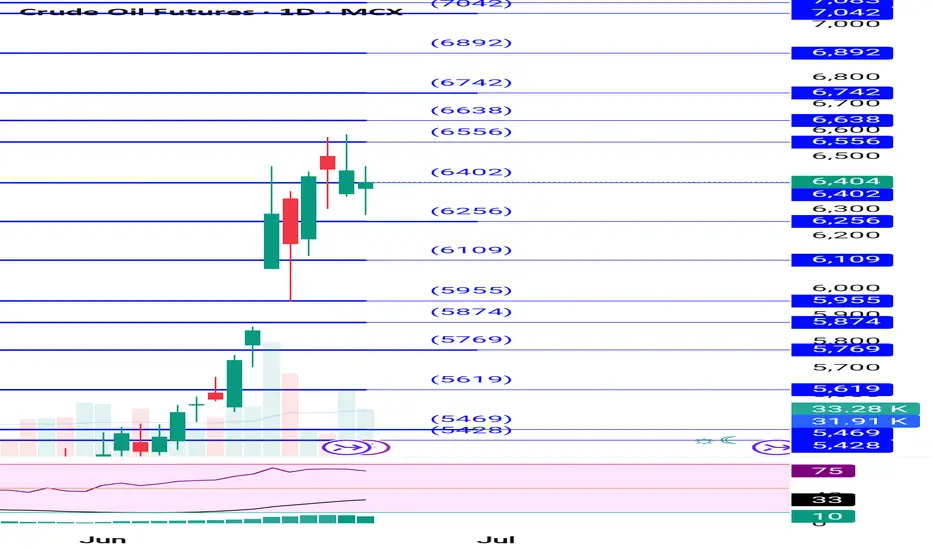
Crude updated levels 6650, 6810 , 7050 upside next Target How to take trades using Harmonic pattern projection Trade setup is explained below :-
Entry : 1st SL point : 0% is recent top or bottom.
Trailing D: 15.1% is work as trailing SL of buy or sell trade if hit then we have to book profit
.If price goes below 2nd D 22.5% to 24.5% range then early traders can make fresh reversals trade after breaking 1st D 15.1% safe traders can reversal trade after breaking Point D 22.5.4% to 24.5% range
Targets :
Target T1 : 36.1% to 38.3%
Target T3 : 49.1% to 52.5%
T3: 60.9% to 64.8% is our 3rd Target since this is reversal zone so must book profit if break then take fresh trade again
Target T4 : 76.4% to 79.7%
Next Targets are 100% , 127.2% ,141.4% and final Target 161.8%.
How to take reversal trade :
If price going upside/ downside then then buy or sell levels appear on Chart ( Automatically show when price reach any reversal zone of harmonic projection ).
Trailing SL:
After reach 1st Target trail SL to just above or below cost ( for example we are holding sell trade from 100 1st Target 110 hit then move trailing sl to 104-105 and move SL as price move upside or Downside)
Re- Entry :
For Re-entry in any pull back Point D ( 15.1% ) is used for re-entry then SL recent high or low Point SL ( 0% ) .
Blue Line is 1st support/ Resistance
Green line is 2nd support/ resistance
Red line is 3rd Support/ resistance
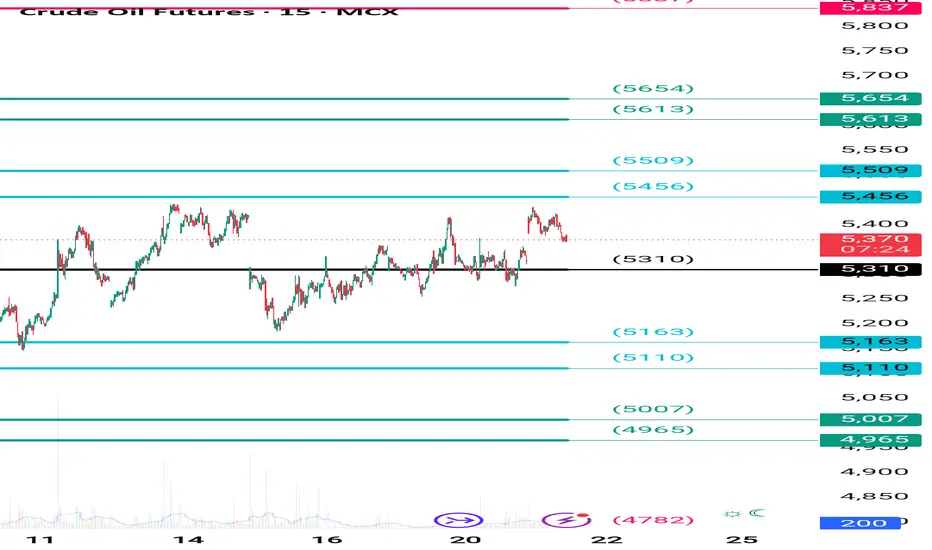
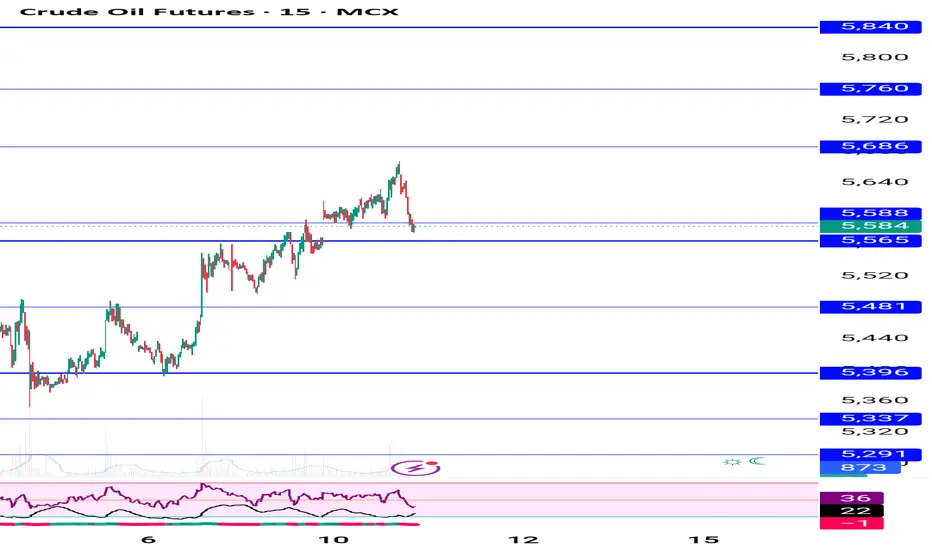
Crude Oil may weaken in few days Crude OIL can fall below as having a resistance at double top and may give good correction below 5200.
Keep an eye for levels 5100, 5000 & 4900✅✅
#crudeoil
#mcx
#trading

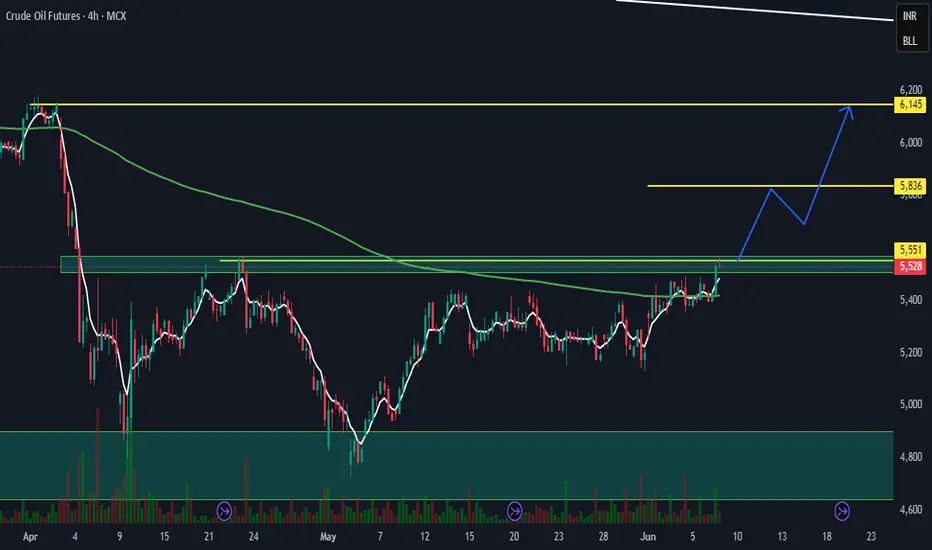
CRUDE OIL 4HRSWING TRADE
- EARN WITH ME DAILY 10K-20K –
CRUDE OIL Looking good for upside..
When it break level 5551 and sustain.. it will go upside...
BUY@ 5551
Target
1st 5836
2nd 6145
Enjoy trading traders.. Keep add this STOCK in your watch list..
Big Investor are welcome to join the ride ..
Like this Post??? Hit like button..!!!
Follow me for FREE Educational Post and Alert..
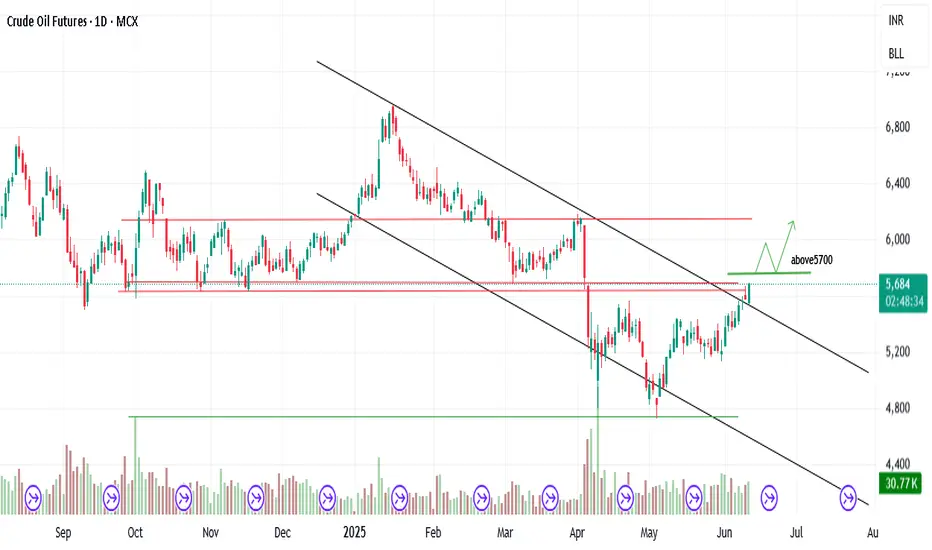
CRUDEOILHello FRIENDS!
The CRUDEOIL price formed a descending channel pattern breakout in D. chart
At the moment, Price revers from upper descending channel line and today broken !
So, I expect a good Bullish move above 5700
Profit booking started on crude we will see 5240-5190 in few dayHow to take trades using Harmonic pattern projection Trade setup is explained below :-
Entry : 1st SL point : 0% is recent top or bottom.
Trailing D: 15.1% is work as trailing SL of buy or sell trade if hit then we have to book profit
.If price goes below 2nd D 22.5% to 24.5% range then early traders can make fresh reversals trade after breaking 1st D 15.1% safe traders can reversal trade after breaking Point D 22.5.4% to 24.5% range
Targets :
Target T1 : 36.1% to 38.3%
Target T3 : 49.1% to 52.5%
T3: 60.9% to 64.8% is our 3rd Target since this is reversal zone so must book profit if break then take fresh trade again
Target T4 : 76.4% to 79.7%
Next Targets are 100% , 127.2% ,141.4% and final Target 161.8%.
How to take reversal trade :
If price going upside/ downside then then buy or sell levels appear on Chart ( Automatically show when price reach any reversal zone of harmonic projection ).
Trailing SL:
After reach 1st Target trail SL to just above or below cost ( for example we are holding sell trade from 100 1st Target 110 hit then move trailing sl to 104-105 and move SL as price move upside or Downside)
Re- Entry :
For Re-entry in any pull back Point D ( 15.1% ) is used for re-entry then SL recent high or low Point SL ( 0% ) .
Blue Line is 1st support/ Resistance
Green line is 2nd support/ resistance
Red line is 3rd Support/ resistance
Crude may bounce up to 5522 level.Crude oil is on bounce, As per chart Crude is showing divergence with morning start. It is at demand zone and add more if come down to 4900 level. It may test minimum 5522 level soon.

Crude updated currently at Resistance area 5550-60 avoid buying How to take trades using Harmonic pattern projection Trade setup is explained below :-
Entry : 1st SL point : 0% is recent top or bottom.
Trailing D: 15.1% is work as trailing SL of buy or sell trade if hit then we have to book profit
.If price goes below 2nd D 22.5% to 24.5% range then early traders can make fresh reversals trade after breaking 1st D 15.1% safe traders can reversal trade after breaking Point D 22.5.4% to 24.5% range
Targets :
Target T1 : 36.1% to 38.3%
Target T3 : 49.1% to 52.5%
T3: 60.9% to 64.8% is our 3rd Target since this is reversal zone so must book profit if break then take fresh trade again
Target T4 : 76.4% to 79.7%
Next Targets are 100% , 127.2% ,141.4% and final Target 161.8%.
How to take reversal trade :
If price going upside/ downside then then buy or sell levels appear on Chart ( Automatically show when price reach any reversal zone of harmonic projection ).
Trailing SL:
After reach 1st Target trail SL to just above or below cost ( for example we are holding sell trade from 100 1st Target 110 hit then move trailing sl to 104-105 and move SL as price move upside or Downside)
Re- Entry :
For Re-entry in any pull back Point D ( 15.1% ) is used for re-entry then SL recent high or low Point SL ( 0% ) .
Blue Line is 1st support/ Resistance
Green line is 2nd support/ resistance
Red line is 3rd Support/ resistance

Crude yesterday bought at 5385 booked at 5480 , now sell riseHow to take trades using Harmonic pattern projection Trade setup is explained below :-
Entry : 1st SL point : 0% is recent top or bottom.
Trailing D: 15.1% is work as trailing SL of buy or sell trade if hit then we have to book profit
.If price goes below 2nd D 22.5% to 24.5% range then early traders can make fresh reversals trade after breaking 1st D 15.1% safe traders can reversal trade after breaking Point D 22.5.4% to 24.5% range
Targets :
Target T1 : 36.1% to 38.3%
Target T3 : 49.1% to 52.5%
T3: 60.9% to 64.8% is our 3rd Target since this is reversal zone so must book profit if break then take fresh trade again
Target T4 : 76.4% to 79.7%
Next Targets are 100% , 127.2% ,141.4% and final Target 161.8%.
How to take reversal trade :
If price going upside/ downside then then buy or sell levels appear on Chart ( Automatically show when price reach any reversal zone of harmonic projection ).
Trailing SL:
After reach 1st Target trail SL to just above or below cost ( for example we are holding sell trade from 100 1st Target 110 hit then move trailing sl to 104-105 and move SL as price move upside or Downside)
Re- Entry :
For Re-entry in any pull back Point D ( 15.1% ) is used for re-entry then SL recent high or low Point SL ( 0% ) .
Blue Line is 1st support/ Resistance
Green line is 2nd support/ resistance
Red line is 3rd Support/ resistance

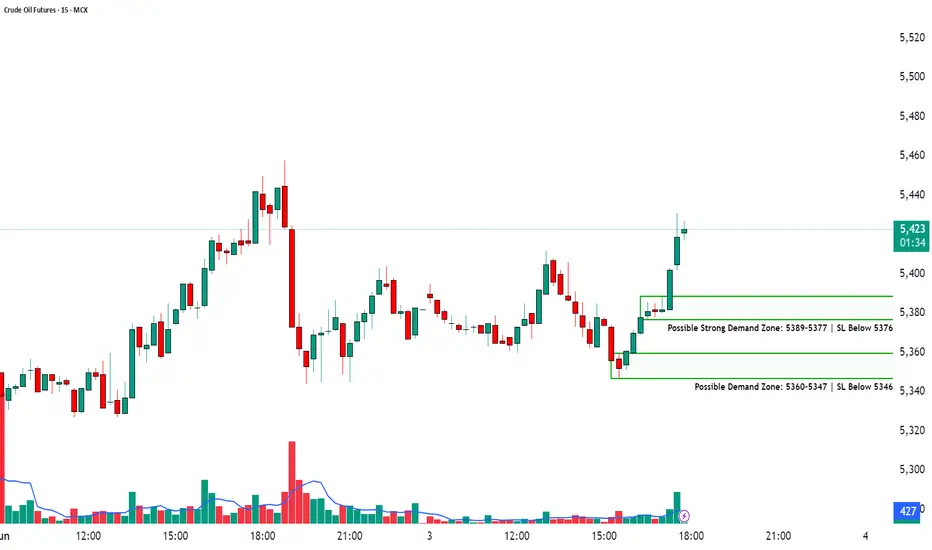
Demand Zone Breakdown + Trade Strategy📈CRUDE OIL FUTURES | 15-Min Chart Analysis
📆Date: June 3, 2025
Ticker: MCX:CRUDEOIL!
Chart Overview:
The chart highlights a bullish reversal from previously marked demand zones. Price sharply bounced with volume confirmation, indicating renewed buying interest.
Two demand zones have been marked for observation:
Possible Strong Demand Zone: ₹5389–5377 | SL Below ₹5376
Possible Demand Zone: ₹5360–5347 | SL Below ₹5346
Price is currently trading around ₹5,425, showing a significant up move post-demand zone test, suggesting buyer dominance in the short term.
Demand Zone Breakdown:
🟩🟩 Strong Demand Zone (₹5389–5377):
Strong volume-backed bullish engulfing formed after price dipped here.
Ideal zone for aggressive long entries with SL below ₹5376.
🟩 Lower Demand Zone (₹5360–5347):
Acts as deeper support and a conservative re-entry zone.
Long entries possible with SL below ₹5346 if retested.
How to Trade Demand Zones (Long Trade):
Wait for a retest of the zone.
Watch for bullish confirmation candles (hammer, bullish engulfing, etc.).
Enter long near the bottom of the zone.
Place SL just below the demand zone.
Stop-Loss Placement:
For Strong Demand Zone: SL below ₹5376
For Lower Demand Zone: SL below ₹5346
Targets: Use Risk-Reward Ratio
🎯 Use a 1:2 or 1:3 RRR to set logical target levels.
📌 Example: If risk is ₹10, target should be ₹20–₹30 above entry.
💡 Why Use Risk-Reward?
Sets clear and objective targets
Keeps emotions out of trading decisions
Helps maintain long-term profitability with disciplined risk control
⚠️ Risk Management Tip:
Always trade with a clearly defined stop-loss. Avoid impulse entries. Start with small quantities and increase size only with confirmation. Capital protection comes first.
📢 Disclaimer
This post is intended for educational and informational purposes only. It does not constitute investment advice or trade recommendations. Trading in commodities and financial markets involves risk. Please consult a SEBI-registered advisor before making financial decisions. The author is not SEBI registered and shall not be liable for any losses. Always use proper risk management and do your own research.
👉 Follow for more trade setups, chart breakdowns, and educational content to improve your trading edge. Stay informed. Trade smart. 📊📈
Crude 5420 Target hit , buy given at 5180 -90 now buy on dip How to take trades using Harmonic pattern projection Trade setup is explained below :-
Entry : 1st SL point : 0% is recent top or bottom.
Trailing D: 15.1% is work as trailing SL of buy or sell trade if hit then we have to book profit
.If price goes below 2nd D 22.5% to 24.5% range then early traders can make fresh reversals trade after breaking 1st D 15.1% safe traders can reversal trade after breaking Point D 22.5.4% to 24.5% range
Targets :
Target T1 : 36.1% to 38.3%
Target T3 : 49.1% to 52.5%
T3: 60.9% to 64.8% is our 3rd Target since this is reversal zone so must book profit if break then take fresh trade again
Target T4 : 76.4% to 79.7%
Next Targets are 100% , 127.2% ,141.4% and final Target 161.8%.
How to take reversal trade :
If price going upside/ downside then then buy or sell levels appear on Chart ( Automatically show when price reach any reversal zone of harmonic projection ).
Trailing SL:
After reach 1st Target trail SL to just above or below cost ( for example we are holding sell trade from 100 1st Target 110 hit then move trailing sl to 104-105 and move SL as price move upside or Downside)
Re- Entry :
For Re-entry in any pull back Point D ( 15.1% ) is used for re-entry then SL recent high or low Point SL ( 0% ) .
Blue Line is 1st support/ Resistance
Green line is 2nd support/ resistance
Red line is 3rd Support/ resistance

Crude updated levels this time 5420-5480 will hit How to take trades using Harmonic pattern projection Trade setup is explained below :-
Entry : 1st SL point : 0% is recent top or bottom.
Trailing D: 11.4% is work as trailing SL of buy or sell trade if hit then we have to book profit
.If price goes below 2nd D 21.4% to 23.6% range then early traders can make fresh reversals trade after breaking 1st D 11.4% safe traders can reversal trade after breaking Point D 21.4% to 23.6% range
Targets :
Target T1 : 35.1% to 38.3%
Target T3 : 49.1% to 53.2%
T3: 60.9% to 64.8% is our 3rd Target since this is reversal zone so must book profit if break then take fresh trade again
Target T4 : 76.4% to 79.7%
Next Targets are 100% , 127.2% ,141.4% and final Target 161.8%.
How to take reversal trade :
If price going upside/ downside then then buy or sell levels appear on Chart ( Automatically show when price reach any reversal zone of harmonic projection pattern based .
After showing reversal levels wait for confirmation until 21.4% or 28.3 % level not break if break then exit from current buy / sell trade and take fresh reverse trade buy/ sell .
Trailing SL:
After reach 1st Target trail SL to just above or below cost ( for example we are holding sell trade from 100 1st Target 110 hit then move trailing sl to 104-105 and move SL as price move upside or Downside)
Re- Entry :
For Re-entry in any pull back Point D ( 11.4% ) is used for re-entry then SL recent high or low Point SL ( 0% ) .
Blue Line is 1st support/ Resistance
Green line is 2nd support/ resistance
Red line is 3rd Support/ resistance
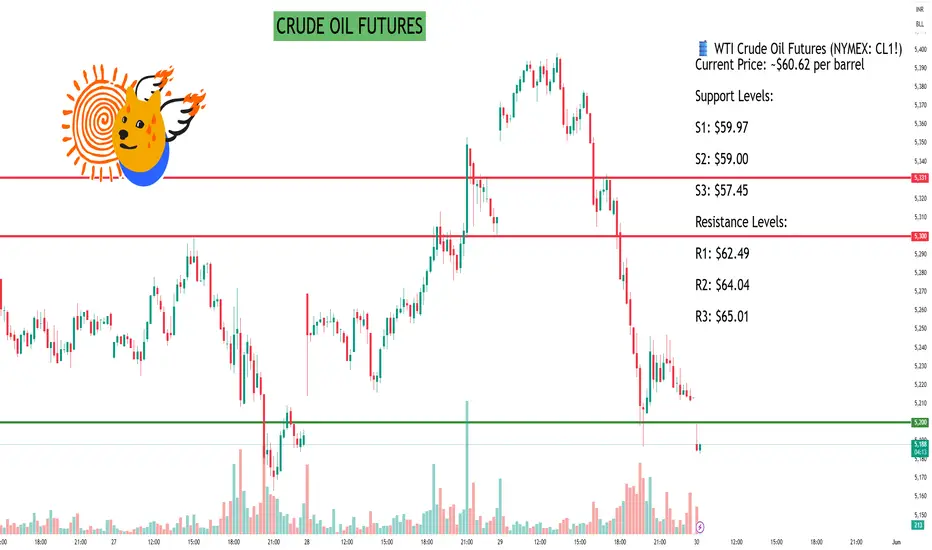
CRUDE OIL FUTURESAs of May 30, 2025, here are the latest 15-minute support and resistance levels for Crude Oil Futures:
🛢️ WTI Crude Oil Futures (NYMEX: CL1!)
Current Price: ~$60.62 per barrel
Support Levels:
S1: $59.97
S2: $59.00
S3: $57.45
Resistance Levels:
R1: $62.49
R2: $64.04
R3: $65.01
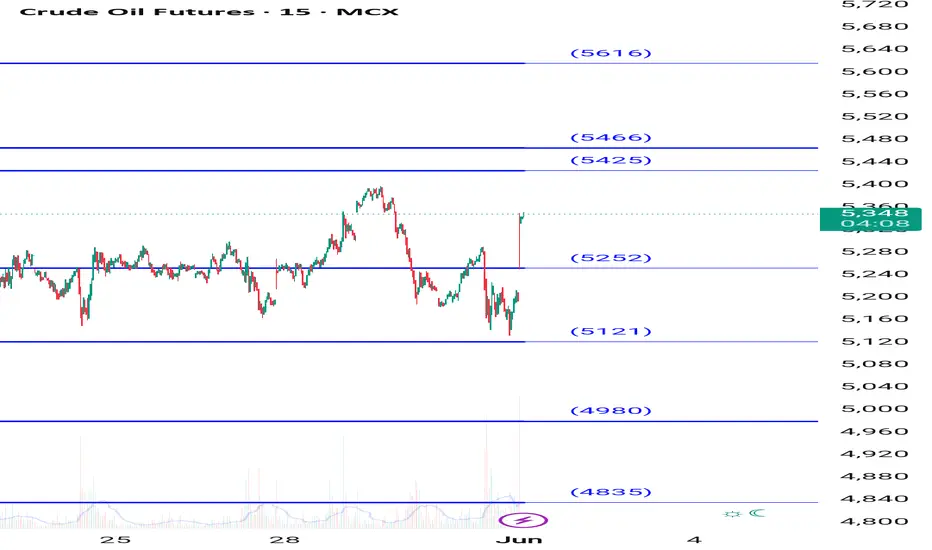
🇮🇳 MCX Crude Oil Futures (INR)
Current Price: ~₹5,191 per barrel
Support Levels:
S1: ₹5,153.33
S2: ₹5,092.67
S3: ₹5,031.33
Resistance Levels:
R1: ₹5,231.67
R2: ₹5,292.33
R3: ₹5,353.67
📊 Technical Outlook
Trend: Neutral to slightly bearish
Indicators: The 15-minute chart shows a potential for a bullish reversal, but confirmation is needed.
Strategy: Traders may consider watching for a breakout above resistance levels for potential long positions, or a breakdown below support levels for short positions.
Crude buy trade recommended near 5180,now 5400 possible How to take trades using Harmonic pattern projection Trade setup is explained below :-
Entry : 1st SL point : 0% is recent top or bottom.
Trailing D: 15.1% is work as trailing SL of buy or sell trade if hit then we have to book profit
.If price goes below 2nd D 22.5% to 24.5% range then early traders can make fresh reversals trade after breaking 1st D 15.1% safe traders can reversal trade after breaking Point D 22.5.4% to 24.5% range
Targets :
Target T1 : 36.1% to 38.3%
Target T3 : 49.1% to 52.5%
T3: 60.9% to 64.8% is our 3rd Target since this is reversal zone so must book profit if break then take fresh trade again
Target T4 : 76.4% to 79.7%
Next Targets are 100% , 127.2% ,141.4% and final Target 161.8%.
How to take reversal trade :
If price going upside/ downside then then buy or sell levels appear on Chart ( Automatically show when price reach any reversal zone of harmonic projection ).
Trailing SL:
After reach 1st Target trail SL to just above or below cost ( for example we are holding sell trade from 100 1st Target 110 hit then move trailing sl to 104-105 and move SL as price move upside or Downside)
Re- Entry :
For Re-entry in any pull back Point D ( 15.1% ) is used for re-entry then SL recent high or low Point SL ( 0% ) .
Blue Line is 1st support/ Resistance
Green line is 2nd support/ resistance
Red line is 3rd Support/ resistance

Crude sell given yesterday now bounce possible again from 5190How to take trades using Harmonic pattern projection Trade setup is explained below :-
Entry : 1st SL point : 0% is recent top or bottom.
Trailing D: 15.1% is work as trailing SL of buy or sell trade if hit then we have to book profit
.If price goes below 2nd D 22.5% to 24.5% range then early traders can make fresh reversals trade after breaking 1st D 15.1% safe traders can reversal trade after breaking Point D 22.5.4% to 24.5% range
Targets :
Target T1 : 36.1% to 38.3%
Target T3 : 49.1% to 52.5%
T3: 60.9% to 64.8% is our 3rd Target since this is reversal zone so must book profit if break then take fresh trade again
Target T4 : 76.4% to 79.7%
Next Targets are 100% , 127.2% ,141.4% and final Target 161.8%.
How to take reversal trade :
If price going upside/ downside then then buy or sell levels appear on Chart ( Automatically show when price reach any reversal zone of harmonic projection ).
Trailing SL:
After reach 1st Target trail SL to just above or below cost ( for example we are holding sell trade from 100 1st Target 110 hit then move trailing sl to 104-105 and move SL as price move upside or Downside)
Re- Entry :
For Re-entry in any pull back Point D ( 15.1% ) is used for re-entry then SL recent high or low Point SL ( 0% ) .
Blue Line is 1st support/ Resistance
Green line is 2nd support/ resistance
Red line is 3rd Support/ resistance

Crude today pattern and news negative fall possible cancel TargtHow to take trades using Harmonic pattern projection Trade setup is explained below :-
Entry : 1st SL point : 0% is recent top or bottom.
Trailing D: 15.1% is work as trailing SL of buy or sell trade if hit then we have to book profit
.If price goes below 2nd D 22.5% to 24.5% range then early traders can make fresh reversals trade after breaking 1st D 15.1% safe traders can reversal trade after breaking Point D 22.5.4% to 24.5% range
Targets :
Target T1 : 36.1% to 38.3%
Target T3 : 49.1% to 52.5%
T3: 60.9% to 64.8% is our 3rd Target since this is reversal zone so must book profit if break then take fresh trade again
Target T4 : 76.4% to 79.7%
Next Targets are 100% , 127.2% ,141.4% and final Target 161.8%.
How to take reversal trade :
If price going upside/ downside then then buy or sell levels appear on Chart ( Automatically show when price reach any reversal zone of harmonic projection ).
Trailing SL:
After reach 1st Target trail SL to just above or below cost ( for example we are holding sell trade from 100 1st Target 110 hit then move trailing sl to 104-105 and move SL as price move upside or Downside)
Re- Entry :
For Re-entry in any pull back Point D ( 15.1% ) is used for re-entry then SL recent high or low Point SL ( 0% ) .
Blue Line is 1st support/ Resistance
Green line is 2nd support/ resistance
Red line is 3rd Support/ resistance
Crude again 5410-5450 possible buy on dip near 5200How to take trades using Harmonic pattern projection Trade setup is explained below :-
Entry : 1st SL point : 0% is recent top or bottom.
Trailing D: 15.1% is work as trailing SL of buy or sell trade if hit then we have to book profit
.If price goes below 2nd D 22.5% to 24.5% range then early traders can make fresh reversals trade after breaking 1st D 15.1% safe traders can reversal trade after breaking Point D 22.5.4% to 24.5% range
Targets :
Target T1 : 36.1% to 38.3%
Target T3 : 49.1% to 52.5%
T3: 60.9% to 64.8% is our 3rd Target since this is reversal zone so must book profit if break then take fresh trade again
Target T4 : 76.4% to 79.7%
Next Targets are 100% , 127.2% ,141.4% and final Target 161.8%.
How to take reversal trade :
If price going upside/ downside then then buy or sell levels appear on Chart ( Automatically show when price reach any reversal zone of harmonic projection ).
Trailing SL:
After reach 1st Target trail SL to just above or below cost ( for example we are holding sell trade from 100 1st Target 110 hit then move trailing sl to 104-105 and move SL as price move upside or Downside)
Re- Entry :
For Re-entry in any pull back Point D ( 15.1% ) is used for re-entry then SL recent high or low Point SL ( 0% ) .
Blue Line is 1st support/ Resistance
Green line is 2nd support/ resistance
Red line is 3rd Support/ resistance

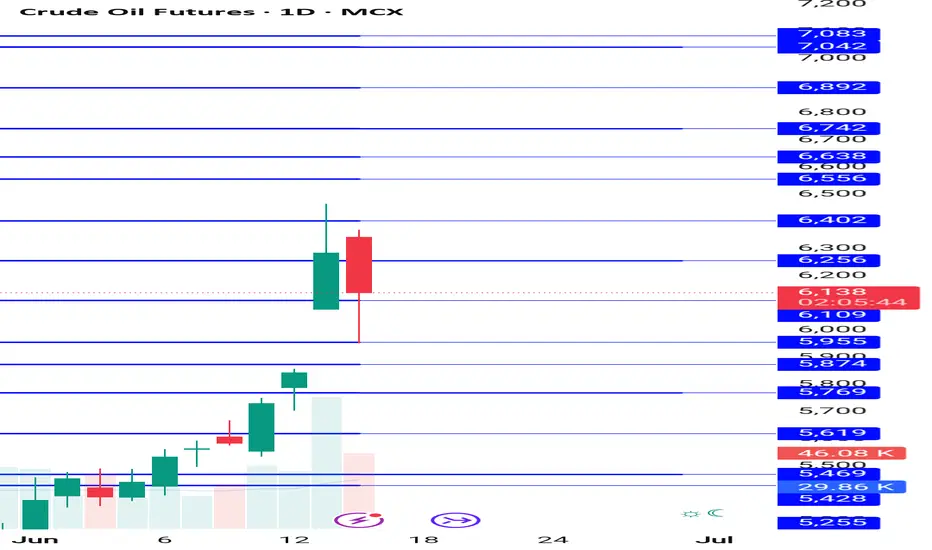
Crudeavoid any fresh trade let Israel Iran issue settle down War will create supply issue so let bring clearity then take fresh trade
How to take trades using Harmonic pattern projection Trade setup is explained below :-
Entry : 1st SL point : 0% is recent top or bottom.
Trailing D: 15.1% is work as trailing SL of buy or sell trade if hit then we have to book profit
.If price goes below 2nd D 22.5% to 24.5% range then early traders can make fresh reversals trade after breaking 1st D 15.1% safe traders can reversal trade after breaking Point D 22.5.4% to 24.5% range
Targets :
Target T1 : 36.1% to 38.3%
Target T3 : 49.1% to 52.5%
T3: 60.9% to 64.8% is our 3rd Target since this is reversal zone so must book profit if break then take fresh trade again
Target T4 : 76.4% to 79.7%
Next Targets are 100% , 127.2% ,141.4% and final Target 161.8%.
How to take reversal trade :
If price going upside/ downside then then buy or sell levels appear on Chart ( Automatically show when price reach any reversal zone of harmonic projection ).
Trailing SL:
After reach 1st Target trail SL to just above or below cost ( for example we are holding sell trade from 100 1st Target 110 hit then move trailing sl to 104-105 and move SL as price move upside or Downside)
Re- Entry :
For Re-entry in any pull back Point D ( 15.1% ) is used for re-entry then SL recent high or low Point SL ( 0% ) .
Blue Line is 1st support/ Resistance
Green line is 2nd support/ resistance
Red line is 3rd Support/ resistance