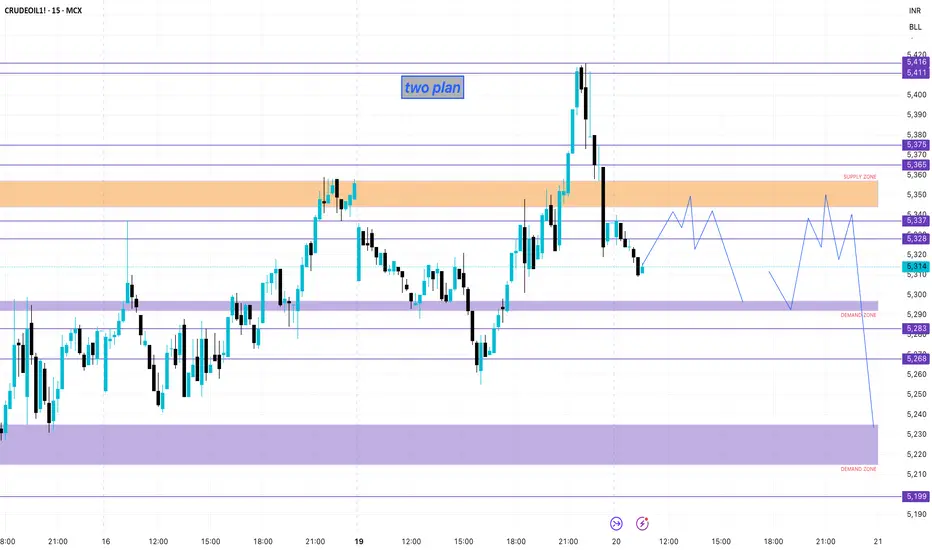
mcx crude mcx crude having two plan. both are selling. but target are different just watch my level. how its react. . purely intraday views only
Oil Futures
No trades
Market insights
CRUDE mcx weekly support and resistance buy on dip at support How to take trades using Harmonic pattern projection Trade setup is explained below :-
Entry : 1st SL point : 0% is recent top or bottom.
Trailing D: 15.1% is work as trailing SL of buy or sell trade if hit then we have to book profit
.If price goes below 2nd D 22.5% to 24.5% range then early traders can make fresh reversals trade after breaking 1st D 15.1% safe traders can reversal trade after breaking Point D 22.5.4% to 24.5% range
Targets :
Target T1 : 36.1% to 38.3%
Target T3 : 49.1% to 52.5%
T3: 60.9% to 64.8% is our 3rd Target since this is reversal zone so must book profit if break then take fresh trade again
Target T4 : 76.4% to 79.7%
Next Targets are 100% , 127.2% ,141.4% and final Target 161.8%.
How to take reversal trade :
If price going upside/ downside then then buy or sell levels appear on Chart ( Automatically show when price reach any reversal zone of harmonic projection ).
Trailing SL:
After reach 1st Target trail SL to just above or below cost ( for example we are holding sell trade from 100 1st Target 110 hit then move trailing sl to 104-105 and move SL as price move upside or Downside)
Re- Entry :
For Re-entry in any pull back Point D ( 15.1% ) is used for re-entry then SL recent high or low Point SL ( 0% ) .
Blue Line is 1st support/ Resistance
Green line is 2nd support/ resistance
Red line is 3rd Support/ resistance
Crude buy if break 5430 , Target 5560, 5710,5870How to take trades using Harmonic pattern projection Trade setup is explained below :-
Entry : 1st SL point : 0% is recent top or bottom.
Trailing D: 15.1% is work as trailing SL of buy or sell trade if hit then we have to book profit
.If price goes below 2nd D 22.5% to 24.5% range then early traders can make fresh reversals trade after breaking 1st D 15.1% safe traders can reversal trade after breaking Point D 22.5.4% to 24.5% range
Targets :
Target T1 : 36.1% to 38.3%
Target T3 : 49.1% to 52.5%
T3: 60.9% to 64.8% is our 3rd Target since this is reversal zone so must book profit if break then take fresh trade again
Target T4 : 76.4% to 79.7%
Next Targets are 100% , 127.2% ,141.4% and final Target 161.8%.
How to take reversal trade :
If price going upside/ downside then then buy or sell levels appear on Chart ( Automatically show when price reach any reversal zone of harmonic projection ).
Trailing SL:
After reach 1st Target trail SL to just above or below cost ( for example we are holding sell trade from 100 1st Target 110 hit then move trailing sl to 104-105 and move SL as price move upside or Downside)
Re- Entry :
For Re-entry in any pull back Point D ( 15.1% ) is used for re-entry then SL recent high or low Point SL ( 0% ) .
Blue Line is 1st support/ Resistance
Green line is 2nd support/ resistance
Red line is 3rd Support/ resistance

Crude 5440 we booked profit, avoid buying let it go near 5240How to take trades using Harmonic pattern projection Trade setup is explained below :-
Entry : 1st SL point : 0% is recent top or bottom.
Trailing D: 15.1% is work as trailing SL of buy or sell trade if hit then we have to book profit
.If price goes below 2nd D 22.5% to 24.5% range then early traders can make fresh reversals trade after breaking 1st D 15.1% safe traders can reversal trade after breaking Point D 22.5.4% to 24.5% range
Targets :
Target T1 : 36.1% to 38.3%
Target T3 : 49.1% to 52.5%
T3: 60.9% to 64.8% is our 3rd Target since this is reversal zone so must book profit if break then take fresh trade again
Target T4 : 76.4% to 79.7%
Next Targets are 100% , 127.2% ,141.4% and final Target 161.8%.
How to take reversal trade :
If price going upside/ downside then then buy or sell levels appear on Chart ( Automatically show when price reach any reversal zone of harmonic projection ).
Trailing SL:
After reach 1st Target trail SL to just above or below cost ( for example we are holding sell trade from 100 1st Target 110 hit then move trailing sl to 104-105 and move SL as price move upside or Downside)
Re- Entry :
For Re-entry in any pull back Point D ( 15.1% ) is used for re-entry then SL recent high or low Point SL ( 0% ) .
Blue Line is 1st support/ Resistance
Green line is 2nd support/ resistance
Red line is 3rd Support/ resistance

Crude 5440 Target hitbetter to avoid fresh buy at CMP wait DipHow to take trades using Harmonic pattern projection Trade setup is explained below :-
Entry : 1st SL point : 0% is recent top or bottom.
Trailing D: 15.1% is work as trailing SL of buy or sell trade if hit then we have to book profit
.If price goes below 2nd D 22.5% to 24.5% range then early traders can make fresh reversals trade after breaking 1st D 15.1% safe traders can reversal trade after breaking Point D 22.5.4% to 24.5% range
Targets :
Target T1 : 36.1% to 38.3%
Target T3 : 49.1% to 52.5%
T3: 60.9% to 64.8% is our 3rd Target since this is reversal zone so must book profit if break then take fresh trade again
Target T4 : 76.4% to 79.7%
Next Targets are 100% , 127.2% ,141.4% and final Target 161.8%.
How to take reversal trade :
If price going upside/ downside then then buy or sell levels appear on Chart ( Automatically show when price reach any reversal zone of harmonic projection ).
Trailing SL:
After reach 1st Target trail SL to just above or below cost ( for example we are holding sell trade from 100 1st Target 110 hit then move trailing sl to 104-105 and move SL as price move upside or Downside)
Re- Entry :
For Re-entry in any pull back Point D ( 15.1% ) is used for re-entry then SL recent high or low Point SL ( 0% ) .
Blue Line is 1st support/ Resistance
Green line is 2nd support/ resistance
Red line is 3rd Support/ resistance
Crude continuesly buying given from 4790 Target 5450-5480 How to take trades using Harmonic pattern projection Trade setup is explained below :-
Entry : 1st SL point : 0% is recent top or bottom.
Trailing D: 15.1% is work as trailing SL of buy or sell trade if hit then we have to book profit
.If price goes below 2nd D 22.5% to 24.5% range then early traders can make fresh reversals trade after breaking 1st D 15.1% safe traders can reversal trade after breaking Point D 22.5.4% to 24.5% range
Targets :
Target T1 : 36.1% to 38.3%
Target T3 : 49.1% to 52.5%
T3: 60.9% to 64.8% is our 3rd Target since this is reversal zone so must book profit if break then take fresh trade again
Target T4 : 76.4% to 79.7%
Next Targets are 100% , 127.2% ,141.4% and final Target 161.8%.
How to take reversal trade :
If price going upside/ downside then then buy or sell levels appear on Chart ( Automatically show when price reach any reversal zone of harmonic projection ).
Trailing SL:
After reach 1st Target trail SL to just above or below cost ( for example we are holding sell trade from 100 1st Target 110 hit then move trailing sl to 104-105 and move SL as price move upside or Downside)
Re- Entry :
For Re-entry in any pull back Point D ( 15.1% ) is used for re-entry then SL recent high or low Point SL ( 0% ) .
Blue Line is 1st support/ Resistance
Green line is 2nd support/ resistance
Red line is 3rd Support/ resistance
Crude 5430-5480 next upside Target no sell signal yetHow to take trades using Harmonic pattern projection Trade setup is explained below :-
Entry : 1st SL point : 0% is recent top or bottom.
Trailing D: 15.1% is work as trailing SL of buy or sell trade if hit then we have to book profit
.If price goes below 2nd D 22.5% to 24.5% range then early traders can make fresh reversals trade after breaking 1st D 15.1% safe traders can reversal trade after breaking Point D 22.5.4% to 24.5% range
Targets :
Target T1 : 36.1% to 38.3%
Target T3 : 49.1% to 52.5%
T3: 60.9% to 64.8% is our 3rd Target since this is reversal zone so must book profit if break then take fresh trade again
Target T4 : 76.4% to 79.7%
Next Targets are 100% , 127.2% ,141.4% and final Target 161.8%.
How to take reversal trade :
If price going upside/ downside then then buy or sell levels appear on Chart ( Automatically show when price reach any reversal zone of harmonic projection ).
Trailing SL:
After reach 1st Target trail SL to just above or below cost ( for example we are holding sell trade from 100 1st Target 110 hit then move trailing sl to 104-105 and move SL as price move upside or Downside)
Re- Entry :
For Re-entry in any pull back Point D ( 15.1% ) is used for re-entry then SL recent high or low Point SL ( 0% ) .
Blue Line is 1st support/ Resistance
Green line is 2nd support/ resistance
Red line is 3rd Support/ resistance

Institution TradingInstitutional trading refers to the buying and selling of financial assets by large organizations, like financial institutions, on behalf of their clients or members. These institutions manage large pools of capital and can significantly impact market prices and trends due to their size and trading volume. Unlike retail traders, institutional traders often have access to a wider range of investment opportunities and strategies.

Crude Went down support 4950 then bounce 5250-80 Target How to take trades using Harmonic pattern projection Trade setup is explained below :-
Entry : 1st SL point : 0% is recent top or bottom.
Trailing D: 15.1% is work as trailing SL of buy or sell trade if hit then we have to book profit
.If price goes below 2nd D 22.5% to 24.5% range then early traders can make fresh reversals trade after breaking 1st D 15.1% safe traders can reversal trade after breaking Point D 22.5.4% to 24.5% range
Targets :
Target T1 : 36.1% to 38.3%
Target T3 : 49.1% to 52.5%
T3: 60.9% to 64.8% is our 3rd Target since this is reversal zone so must book profit if break then take fresh trade again
Target T4 : 76.4% to 79.7%
Next Targets are 100% , 127.2% ,141.4% and final Target 161.8%.
How to take reversal trade :
If price going upside/ downside then then buy or sell levels appear on Chart ( Automatically show when price reach any reversal zone of harmonic projection ).
Trailing SL:
After reach 1st Target trail SL to just above or below cost ( for example we are holding sell trade from 100 1st Target 110 hit then move trailing sl to 104-105 and move SL as price move upside or Downside)
Re- Entry :
For Re-entry in any pull back Point D ( 15.1% ) is used for re-entry then SL recent high or low Point SL ( 0% ) .
Blue Line is 1st support/ Resistance
Green line is 2nd support/ resistance
Red line is 3rd Support/ resistance
Institutional Trading part 4Institutional traders buy and sell securities for accounts they manage for a group or institution. Retail traders buy or sell securities for personal accounts. Institutional traders usually trade larger sizes and can trade more exotic products.

Management and PsychologyMarket psychology is the study of herd behavior and sentiment among economic actors, such as businesses, traders, or consumers. By studying the prevalence of greed, fear, or euphoria in the market, skilled traders can forecast future price movements and fluctuations in supply and demand.

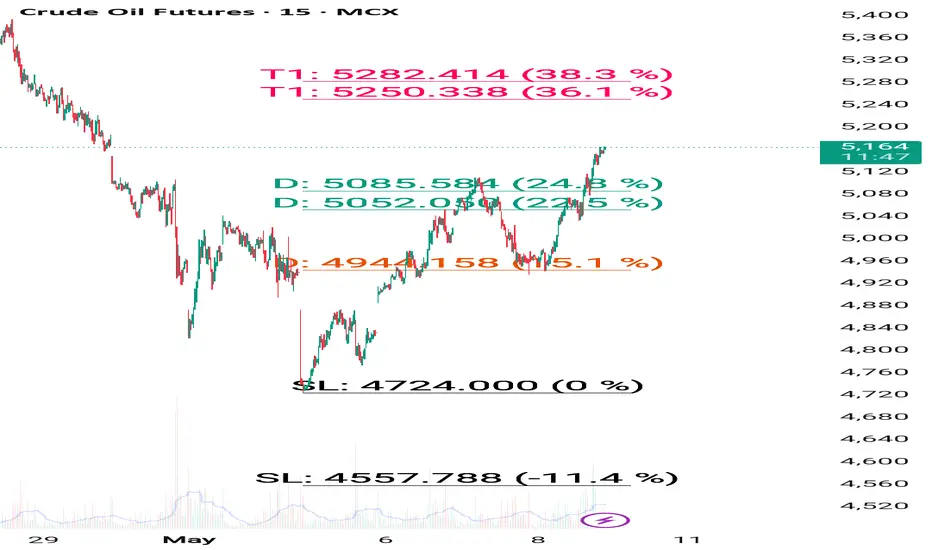
Crude 5085 Target hit buy given near 4790 -80 enjoy huge profit How to take trades using Harmonic pattern projection Trade setup is explained below :-
Entry : 1st SL point : 0% is recent top or bottom.
Trailing D: 15.1% is work as trailing SL of buy or sell trade if hit then we have to book profit
.If price goes below 2nd D 22.5% to 24.5% range then early traders can make fresh reversals trade after breaking 1st D 15.1% safe traders can reversal trade after breaking Point D 22.5.4% to 24.5% range
Targets :
Target T1 : 36.1% to 38.3%
Target T3 : 49.1% to 52.5%
T3: 60.9% to 64.8% is our 3rd Target since this is reversal zone so must book profit if break then take fresh trade again
Target T4 : 76.4% to 79.7%
Next Targets are 100% , 127.2% ,141.4% and final Target 161.8%.
How to take reversal trade :
If price going upside/ downside then then buy or sell levels appear on Chart ( Automatically show when price reach any reversal zone of harmonic projection ).
Trailing SL:
After reach 1st Target trail SL to just above or below cost ( for example we are holding sell trade from 100 1st Target 110 hit then move trailing sl to 104-105 and move SL as price move upside or Downside)
Re- Entry :
For Re-entry in any pull back Point D ( 15.1% ) is used for re-entry then SL recent high or low Point SL ( 0% ) .
Blue Line is 1st support/ Resistance
Green line is 2nd support/ resistance
Red line is 3rd Support/ resistance

Best Commodity layoutBest Commodity layout
Crafting Your Optimal Commodity Technical Chart Layout in TradingView
The "best" commodity technical chart layout in TradingView is highly personalized, depending on your trading style, strategy, and the specific commodities you're analyzing. However, a well-structured layout should provide a clear, comprehensive view of price action and key technical indicators to aid in decision-making.
Here's a guide to creating an effective commodity technical chart layout in TradingView, incorporating common practices and versatile tools:
1. Choosing Your Main Chart Type:
Candlestick Charts: This is the most popular choice for most traders. Candlesticks provide detailed information about the open, high, low, and close (OHLC) prices for a specific period, making it easier to identify patterns and market sentiment.
Bar Charts: Similar to candlesticks, bar charts also display OHLC data but in a different visual format.
Line Charts: Useful for a quick overview of the overall trend, typically plotting the closing prices.
Heikin Ashi: These charts can help filter out market noise and make trends easier to identify by averaging price data.
Renko or Kagi Charts: These focus solely on price movement, ignoring time, and can be useful for identifying support and resistance levels.
Recommendation: Start with Candlestick charts for their detailed information. You can always switch to other types for different analytical perspectives.
2. Essential Technical Indicators for Commodities:
While the "best" set of indicators is subjective, here are some widely used and effective ones for commodity analysis in TradingView:
Moving Averages (MAs):
Types: Simple Moving Average (SMA) and Exponential Moving Average (EMA) are common. EMAs react faster to recent price changes.
Use: Identify trend direction, support/resistance levels, and potential crossover signals. Common periods include 20, 50, 100, and 200.
Layout: Add 2-3 MAs of different lengths directly onto your main price chart. For example, a 21-period EMA for short-term trends and a 50-period EMA for medium-term trends.
Volume Indicators:
Types: Volume (displays trading activity) and On-Balance Volume (OBV).
Use: Confirm the strength of price movements. A significant price move accompanied by high volume is generally considered more valid.
Layout: Typically displayed in a separate pane below the main price chart.
Oscillators (for identifying overbought/oversold conditions and momentum):
Relative Strength Index (RSI): Measures the speed and change of price movements. Values above 70 often indicate overbought conditions, while below 30 suggest oversold conditions. Standard period is 14.
Moving Average Convergence Divergence (MACD): Shows the relationship between two moving averages of an asset's price. It consists of the MACD line, signal line, and histogram.1 Used for trend identification and momentum.
1.
medium.com
medium.com
Stochastic Oscillator: Compares a particular closing price of an asset to a range of its prices over a certain period. Also used to identify overbought/oversold conditions.
Commodity Channel Index (CCI): Identifies cyclical trends and can signal overbought/oversold levels.
Layout: Oscillators are usually placed in separate panes below the main chart. You might choose 1 or 2 that best suit your strategy (e.g., RSI and MACD).
Volatility Indicators:
Bollinger Bands: Consist of a middle band (typically an SMA) and two outer bands representing standard deviations. They help identify volatility and potential price breakouts or mean reversion.
Keltner Channels: Similar to Bollinger Bands but use Average True Range (ATR) for the outer bands. Can be used for breakout and trend-following strategies.
Average True Range (ATR): Measures market volatility. Useful for setting stop-loss orders.
Layout: Bollinger Bands and Keltner Channels are overlaid on the main price chart. ATR is usually in a separate pane.
Trend-Following Indicators:
Ichimoku Cloud (Ichimoku Kinko Hyo): A comprehensive indicator that defines support/resistance, identifies trend direction, and provides trading signals. It includes several components like the Kumo (Cloud), Tenkan-sen, and Kijun-sen.
Donchian Channels: Plots the highest high and lowest low over a set period. Useful for identifying breakouts and trend direction.
Layout: Ichimoku Cloud and Donchian Channels are overlaid on the main price chart.
Recommendation for a Balanced Layout:
Main Chart: Candlesticks, 2-3 EMAs (e.g., 21, 50, 200), Bollinger Bands or Keltner Channels.
Pane 1 (below main): Volume.
Pane 2 (below main): RSI (14) or MACD.
Pane 3 (optional): CCI or ATR if your strategy heavily relies on them.
3. Drawing Tools:
Effective use of drawing tools is crucial for technical analysis:
Trendlines: Connect swing highs or lows to identify the direction and strength of trends.
Support and Resistance Levels: Horizontal lines drawn at key price levels where the price has historically struggled to break above (resistance) or fall below (support).
Fibonacci Retracement and Extension Levels: Help identify potential support/resistance levels and price targets based on Fibonacci ratios.
Channels: Parallel trendlines that can define a price range.
Chart Patterns: Use tools to identify patterns like head and shoulders, triangles, flags, and pennants.
Layout Tip: Keep your most frequently used drawing tools easily accessible in the TradingView drawing panel.
4. Multi-Timeframe Analysis & Multi-Chart Layouts:
Analyzing commodities across different timeframes can provide a broader market perspective. TradingView allows you to set up multi-chart layouts (the number of charts available depends on your subscription plan).
Common Setup:
Chart 1 (Long-Term): Weekly or Daily chart to identify the major trend.
Chart 2 (Medium-Term): 4-hour or Daily chart for more detailed trend analysis and identifying key levels.
Chart 3 (Short-Term): 1-hour or 15-minute chart for entry and exit signals.
Synchronization: TradingView allows you to synchronize symbols, crosshair, interval, and drawings across multiple charts in a layout, which can be very efficient.
5. Customization and Saving Your Layout:
Appearance: Customize chart colors (background, candles, grids), scales, and lines to your preference for better visual clarity and reduced eye strain. Access these via Chart Settings (the gear icon).
Saving Layouts: Once you have a setup you like, save it as a chart layout in TradingView. You can create multiple layouts for different commodities, strategies, or analytical purposes.
Indicator Templates: Save combinations of indicators as templates for quick application to new charts.
Tips for the "Best" Layout:
Keep it Clean: Avoid cluttering your chart with too many indicators. Focus on a few that you understand well and that complement your strategy.
Consistency: Use consistent settings for your indicators across different charts and timeframes.
Practice: The "best" layout is one that works for you. Experiment with different indicators and setups on a demo account or through backtesting to see what yields the best results for your trading style.
Stay Informed: Be aware that some commodities (e.g., agricultural products) can be influenced by seasonal patterns or specific reports (like USDA reports for crops, EIA for oil). While not a direct part of the "chart layout," integrating this knowledge with your technical analysis is crucial. TradingView has features to display key events like earnings reports or dividends, which can be relevant. Some community scripts on TradingView even offer overlays for planting and harvesting seasons for agricultural commodities.
By following these guidelines and experimenting to find what suits your individual needs, you can create a powerful and effective commodity technical chart layout in TradingView. Remember to regularly review and refine your layout as your trading strategies evolve.
Crude premium members holding buy from 4760 Target 5050-5085How to take trades using Harmonic pattern projection Trade setup is explained below :-
Entry : 1st SL point : 0% is recent top or bottom.
Trailing D: 15.1% is work as trailing SL of buy or sell trade if hit then we have to book profit
.If price goes below 2nd D 22.5% to 24.5% range then early traders can make fresh reversals trade after breaking 1st D 15.1% safe traders can reversal trade after breaking Point D 22.5.4% to 24.5% range
Targets :
Target T1 : 36.1% to 38.3%
Target T3 : 49.1% to 52.5%
T3: 60.9% to 64.8% is our 3rd Target since this is reversal zone so must book profit if break then take fresh trade again
Target T4 : 76.4% to 79.7%
Next Targets are 100% , 127.2% ,141.4% and final Target 161.8%.
How to take reversal trade :
If price going upside/ downside then then buy or sell levels appear on Chart ( Automatically show when price reach any reversal zone of harmonic projection ).
Trailing SL:
After reach 1st Target trail SL to just above or below cost ( for example we are holding sell trade from 100 1st Target 110 hit then move trailing sl to 104-105 and move SL as price move upside or Downside)
Re- Entry :
For Re-entry in any pull back Point D ( 15.1% ) is used for re-entry then SL recent high or low Point SL ( 0% ) .
Blue Line is 1st support/ Resistance
Green line is 2nd support/ resistance
Red line is 3rd Support/ resistance

Crude will make double bottom buy on dip until 4790 not break How to take trades using Harmonic pattern projection Trade setup is explained below :-
Entry : 1st SL point : 0% is recent top or bottom.
Trailing D: 15.1% is work as trailing SL of buy or sell trade if hit then we have to book profit
.If price goes below 2nd D 22.5% to 24.5% range then early traders can make fresh reversals trade after breaking 1st D 15.1% safe traders can reversal trade after breaking Point D 22.5.4% to 24.5% range
Targets :
Target T1 : 36.1% to 38.3%
Target T3 : 49.1% to 52.5%
T3: 60.9% to 64.8% is our 3rd Target since this is reversal zone so must book profit if break then take fresh trade again
Target T4 : 76.4% to 79.7%
Next Targets are 100% , 127.2% ,141.4% and final Target 161.8%.
How to take reversal trade :
If price going upside/ downside then then buy or sell levels appear on Chart ( Automatically show when price reach any reversal zone of harmonic projection ).
Trailing SL:
After reach 1st Target trail SL to just above or below cost ( for example we are holding sell trade from 100 1st Target 110 hit then move trailing sl to 104-105 and move SL as price move upside or Downside)
Re- Entry :
For Re-entry in any pull back Point D ( 15.1% ) is used for re-entry then SL recent high or low Point SL ( 0% ) .
Blue Line is 1st support/ Resistance
Green line is 2nd support/ resistance
Red line is 3rd Support/ resistance
mcx crudeoil short .....crudeoil has broken a long term descending triangle pattern with a strong bearish monthly candle, i am expecting a follow up candle same size . targets a re in the chart with detailed explanation . chart itself is more than enough to understand the analysis....

OPEC at a turning point: what’s next for oil? All eyes are on OPEC ahead of its May 5 meeting as it faces pressure from falling prices, weak demand, and internal rifts.
While some expect a pause in output hikes, the consensus points to continued increases. The group’s decision will be key in shaping oil market dynamics amid trade tensions and fragile global growth.
APRIL PRICE ACTION: TARIFFS, TRUMP, AND TURBULENCE
April witnessed WTI crude oil futures plummeting by 18.6%, marking its sharpest monthly decline since November 2021, as U.S. tariffs and OPEC+ supply hikes dragged prices.
President Trump’s April 2 announcement of 10% baseline tariffs on all imports, with elevated duties targeting China and others, triggered fears of a global trade slowdown. Additionally, China’s retaliatory tariffs on U.S. goods only intensified demand concerns.
OPEC+ exacerbated the selloff by boosting output by 138,000 bpd in April, its first production hike since 2022. The group had initially planned for gradual monthly increases of 135,000 bpd, but the higher-than-expected increase caught the market off guard, intensifying downward pressure on prices.
The cartel followed up with an announcement that it would hike output in May by 411,000 bpd. The accelerated pace of production increases is widely seen as politically motivated, reflecting pressure to align with U.S. interests amid growing geopolitical and economic tensions.
OUTPUT HIKES LOOM AMID POLITICAL TENSIONS AND INTERNAL RIFTS
OPEC+ faces growing pressure to raise output, despite weak demand. Political factors, internal pressure from key members, and a desire to protect market share are driving this shift.
Disagreements within the group are mounting. Kazakhstan, for example, says it can’t cut production and will prioritize domestic needs, continuing to exceed its target. In March, the UAE, Iraq, and Nigeria also pumped above quotas and are pushing for higher limits to support their budgets.
Source: OPEC and IEA
Saudi Arabia appears less willing to support prices with further cuts. Reuters reports the kingdom is prepared to tolerate lower prices to defend market share.
Rising domestic oil use from May to September, due to higher electricity demand, also supports more output.
OPEC+ is also under political pressure to boost output, with analysts suggesting Saudi Arabia and others may fast-track supply hikes at the May 5 meeting to ensure oil doesn’t become a flashpoint ahead of Trump’s upcoming visit to the Gulf.
OIL MARKET STRUGGLES WITH TWIN HEADWINDS: WEAK DEMAND AND RISING OPEC+ SUPPLY
OPEC has cut its 2025 oil demand growth forecast by 10.3% to 1.3 million bpd and trimmed its 2026 outlook by 10.5% to 1.28 million bpd, citing the impact of U.S. tariffs.
Source: OPEC , EIA , and IEA
The EIA and IEA echoed this downgrade, reinforcing expectations of prolonged price pressure amid trade tensions and rising supply.
Source: U.S. Bureau of Economic Analysis
Economic data from major consumers deepens the bearish tone. The U.S. economy contracted 0.3% in Q1 2025, its first decline since 2022, as firms rushed imports ahead of tariffs, disrupting trade flows. China’s April manufacturing PMI dropped to 49, marking its lowest since 2023 despite stimulus measures.
The trade tensions between the U.S. and China disrupt supply chains and increase costs, while slower economic growth in key regions curtails fuel consumption.
With global growth cooling and OPEC+ accelerating output, the oil market now faces a dual challenge: softening demand and swelling supply. The result is a volatile outlook skewed toward persistent oversupply.
HYPOTHETICAL TRADE SETUP
With OPEC+ likely to uphold or accelerate output hikes at the May 5 meeting due to the reasons stated above, WTI remains vulnerable.
Notably, WTI’s implied volatility remains near its YTD highs, and the skew stays deep in negative territory at 5.6, signalling stronger demand for downside protection over upside exposure.
Source: CME CVOL
The 21-day MA remains above the 9-day MA, indicating sustained bearish pressure, while the MACD continues to trend lower despite the May 1 price rebound.
RSI hovers in neutral territory but below the midpoint, signalling weakening bullish conviction.
All these indicators point to fading bullish momentum and sustained downside pressure.
Overall, bearish technicals, persistent oversupply risk, and soft economic data from the U.S., China, and Europe support a short-term bearish view.
Source: CME QuikStrike
With OPEC’s meeting set for 05 May, investors may explore the 05/May ML1K5 Monday weekly options.
This paper posits a Bearish Put Spread using weekly WTI options expiring on 05/May, offering defined risk and reward in a directional play with a 1.1 x reward-to-risk ratio.
The long put at USD 61/barrel, and the short put at USD 57/barrel; this sets a breakeven at USD 59.09/barrel. The trade costs a net premium of USD 1.91/barrel (USD 1,910/contract)
The position yields a maximum profit of USD 2.09/barrel (USD 2,090/contract) if WTI settles below USD 57/barrel, and a maximum loss of USD 1.91/barrel (USD 1,910/contract) if it closes above USD 61/barrel.
The chart above was created using CME Group’s QuikStrike Strategy Simulator , which allows for precise modeling and clear visualization of trading strategies under different market conditions.
MARKET DATA
CME Real-time Market Data helps identify trading set-ups and express market views better. If you have futures in your trading portfolio, you can check out on CME Group data plans available that suit your trading needs tradingview.com/cme.
DISCLAIMER
This case study is for educational purposes only and does not constitute investment recommendations or advice. Nor are they used to promote any specific products, or services.
Trading or investment ideas cited here are for illustration only, as an integral part of a case study to demonstrate the fundamental concepts in risk management or trading under the market scenarios being discussed. Please read the FULL DISCLAIMER the link to which is provided in our profile description.

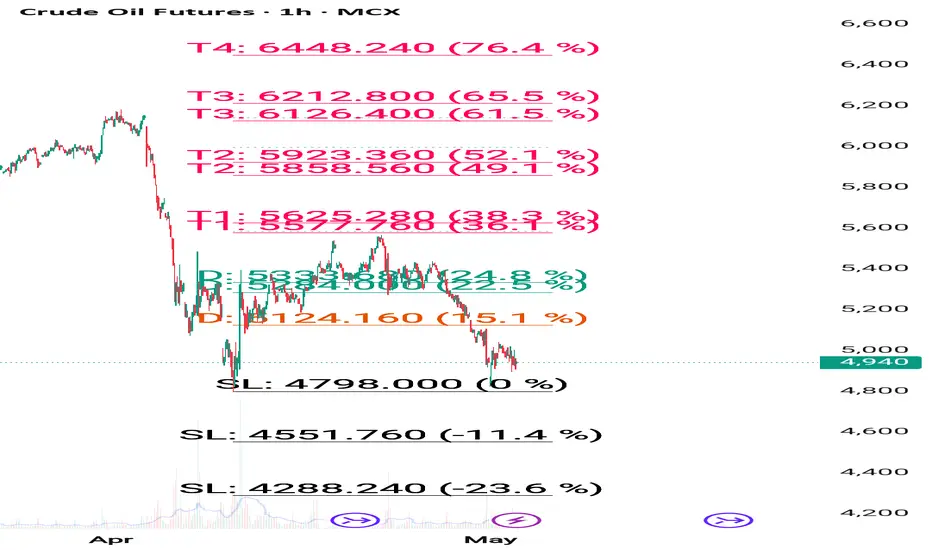
Crude double bottom active 5130, then 5450to 5530 upside Target How to take trades using Harmonic pattern projection Trade setup is explained below :-
Entry : 1st SL point : 0% is recent top or bottom.
Trailing D: 15.1% is work as trailing SL of buy or sell trade if hit then we have to book profit
.If price goes below 2nd D 22.5% to 24.5% range then early traders can make fresh reversals trade after breaking 1st D 15.1% safe traders can reversal trade after breaking Point D 22.5.4% to 24.5% range
Targets :
Target T1 : 36.1% to 38.3%
Target T3 : 49.1% to 52.5%
T3: 60.9% to 64.8% is our 3rd Target since this is reversal zone so must book profit if break then take fresh trade again
Target T4 : 76.4% to 79.7%
Next Targets are 100% , 127.2% ,141.4% and final Target 161.8%.
How to take reversal trade :
If price going upside/ downside then then buy or sell levels appear on Chart ( Automatically show when price reach any reversal zone of harmonic projection ).
Trailing SL:
After reach 1st Target trail SL to just above or below cost ( for example we are holding sell trade from 100 1st Target 110 hit then move trailing sl to 104-105 and move SL as price move upside or Downside)
Re- Entry :
For Re-entry in any pull back Point D ( 15.1% ) is used for re-entry then SL recent high or low Point SL ( 0% ) .
Blue Line is 1st support/ Resistance
Green line is 2nd support/ resistance
Red line is 3rd Support/ resistance

Crude Oil Futures Under Pressure; Key Resistance Confirmed at ₹5Crude Oil futures on the MCX continued their downward trajectory on Wednesday, closing near ₹4,949 amid growing bearish momentum. WaveNodes Pro Max AI flagged a "Seller Trap Possible", but downside targets remain intact for now.
Seller trap alert means big players are finding opportunity to trap or shed short sellers.
The system-identified Short Entry at ₹5,212 has held firm as resistance, with two clear retests failing to breach the impact zone of ₹5,233–₹5,263. This former support has now flipped decisively into supply, adding pressure on intraday rallies.
🔻 Key Developments:
AI Bearish Probability: Rises to 50.9%, surpassing bullish odds.
Target 1 (₹5,036–₹5,103) achieved successfully.
Target 2 set at ₹4,750–₹4,818, with potential for deeper correction toward ₹4,465–₹4,533.
Profit Booking Alert: ₹5,084 marked as short-term profit-taking zone.
📉 Market Sentiment:
Volatility remains elevated at 23 PPB, with good volatility reading at 21 PPB, suggesting controlled but active movement.
Despite bearish strength, the AI warns of a possible seller trap, especially if prices reclaim levels above ₹5,084.
🧠 Analyst Take: “The rejection at ₹5,212 confirms the breakdown structure. As long as crude trades below this zone, lower targets remain open. However, a surprise reclaim could trigger short covering,” analysts from WaveNodes noted.
📊 Outlook:
Trend: Bearish
Resistance: ₹5,212–₹5,263
Support: ₹4,750 → ₹4,465
Traders are advised to watch volumes closely as crude approaches the next support band. A failure to break lower could validate the seller trap thesis.

CRUDE OIL (Ready to short)TF use-Daily
If a candle closes below 5275 in daily TF, then the price will touch the last swing low (i.e. 4798) in upcoming days.
Below the swing low ABCD pattern will be activated & then we may see the target of 4323.
ABCD will be activated only below 4798.
View got invalid if any weekly candle closes above 5566
.
I am not a SEBI Registered. This analysis is purely for educational purposes only.
.
If you gain some learning from this chart, then please like this post for more reach & also do comment if you have any questions regarding this.

Crude 5435 and 5370 range will give movement after range breakHow to take trades using Harmonic pattern projection Trade setup is explained below :-
Entry : 1st SL point : 0% is recent top or bottom.
Trailing D: 15.1% is work as trailing SL of buy or sell trade if hit then we have to book profit
.If price goes below 2nd D 22.5% to 24.5% range then early traders can make fresh reversals trade after breaking 1st D 15.1% safe traders can reversal trade after breaking Point D 22.5.4% to 24.5% range
Targets :
Target T1 : 36.1% to 38.3%
Target T3 : 49.1% to 52.5%
T3: 60.9% to 64.8% is our 3rd Target since this is reversal zone so must book profit if break then take fresh trade again
Target T4 : 76.4% to 79.7%
Next Targets are 100% , 127.2% ,141.4% and final Target 161.8%.
How to take reversal trade :
If price going upside/ downside then then buy or sell levels appear on Chart ( Automatically show when price reach any reversal zone of harmonic projection ).
Trailing SL:
After reach 1st Target trail SL to just above or below cost ( for example we are holding sell trade from 100 1st Target 110 hit then move trailing sl to 104-105 and move SL as price move upside or Downside)
Re- Entry :
For Re-entry in any pull back Point D ( 15.1% ) is used for re-entry then SL recent high or low Point SL ( 0% ) .
Blue Line is 1st support/ Resistance
Green line is 2nd support/ resistance
Red line is 3rd Support/ resistance

crude sell trade ideaWill sell crude when price 5522 sl marked and tareget 1 and target 2 marked reason for the sell is crude taking rejection from Supply Zone of Comex charts . our trading style is buy from demand zone and sell from supply zone . marked this levels keeping buffer according to comex charts .

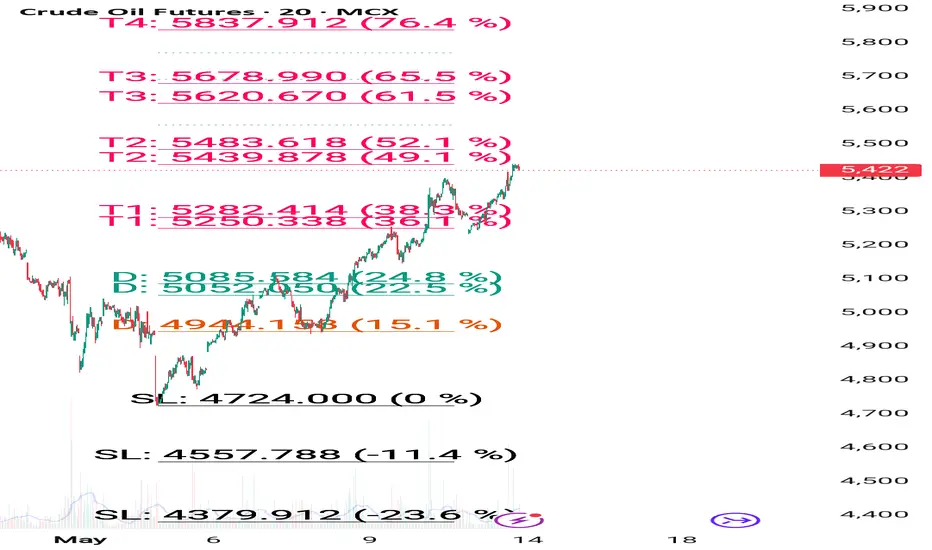
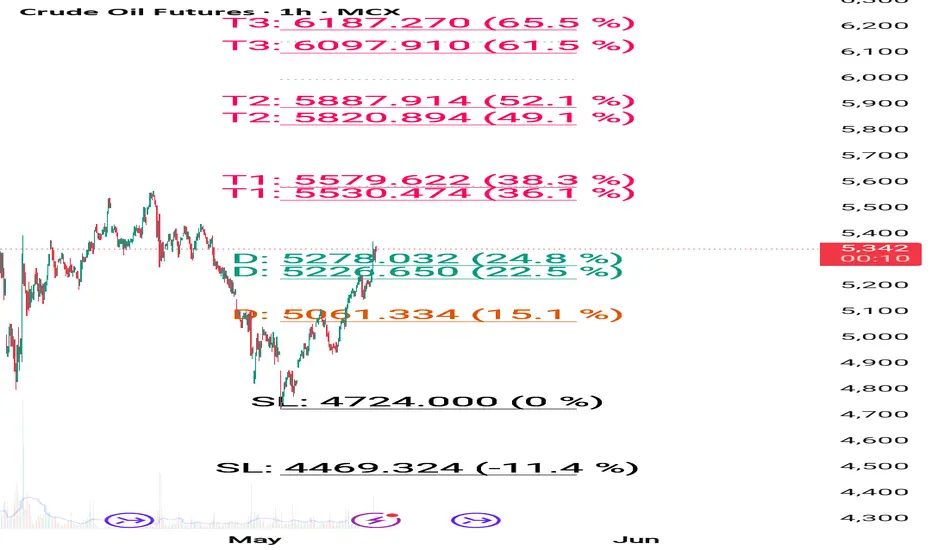
Crude buy on dip near support 5550-5620 upside Target How to take trades using Harmonic pattern projection Trade setup is explained below :-
Entry : 1st SL point : 0% is recent top or bottom.
Trailing D: 11.4% is work as trailing SL of buy or sell trade if hit then we have to book profit
.If price goes below 2nd D 21.4% to 23.6% range then early traders can make fresh reversals trade after breaking 1st D 11.4% safe traders can reversal trade after breaking Point D 21.4% to 23.6% range
Targets :
Target T1 : 35.1% to 38.3%
Target T3 : 49.1% to 53.2%
T3: 60.9% to 64.8% is our 3rd Target since this is reversal zone so must book profit if break then take fresh trade again
Target T4 : 76.4% to 79.7%
Next Targets are 100% , 127.2% ,141.4% and final Target 161.8%.
How to take reversal trade :
If price going upside/ downside then then buy or sell levels appear on Chart ( Automatically show when price reach any reversal zone of harmonic projection pattern based .
After showing reversal levels wait for confirmation until 21.4% or 28.3 % level not break if break then exit from current buy / sell trade and take fresh reverse trade buy/ sell .
Trailing SL:
After reach 1st Target trail SL to just above or below cost ( for example we are holding sell trade from 100 1st Target 110 hit then move trailing sl to 104-105 and move SL as price move upside or Downside)
Re- Entry :
For Re-entry in any pull back Point D ( 11.4% ) is used for re-entry then SL recent high or low Point SL ( 0% ) .
Blue Line is 1st support/ Resistance
Green line is 2nd support/ resistance
Red line is 3rd Support/ resistance
