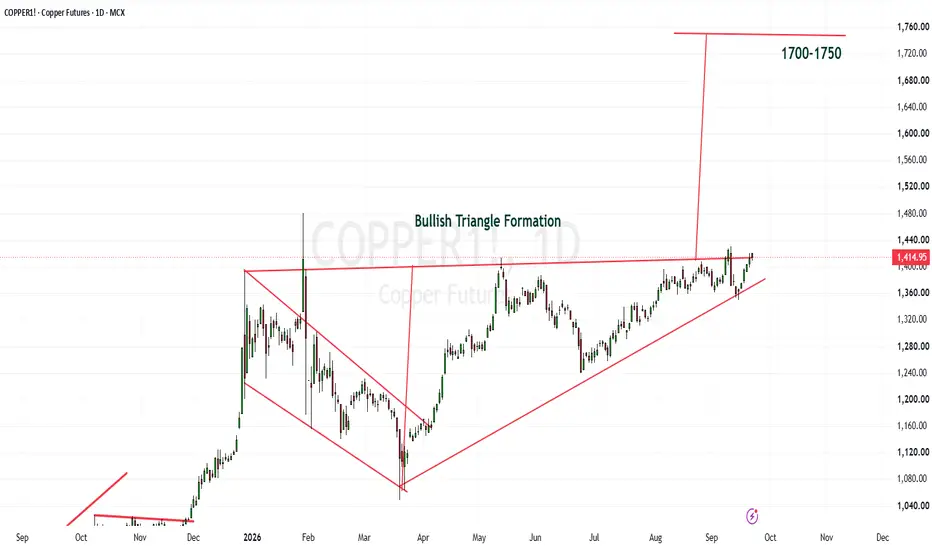
Copper Breakout SetupCopper is currently trading near ₹1,404/kg and appears to be forming a symmetrical triangle pattern, with price consolidating between a descending resistance trendline and a rising support trendline.
🔹 Breakout Zone: ₹1,430–₹1,435
🔹 Pattern Support: ₹1,380–₹1,385
🔹 A decisive close above ₹1,430–₹1,
Sorry, this is only available to registered users
MCX provides data to our registered users only, so to get it you'll need to sign up for a TradingView account.
Compare with Copper Futures
Contract highlights
Copper : Hidden Gem Bullish Breakout soonCopper is about to have a breakout from a very Bullish Triangle pattern. A close above Rs.1430 with a big candle and volume will give a massive rally, whose target may be Rs. 1700-1750 in near future.
My advice don't short the commodities for a long period.
Be careful about investment / trading.
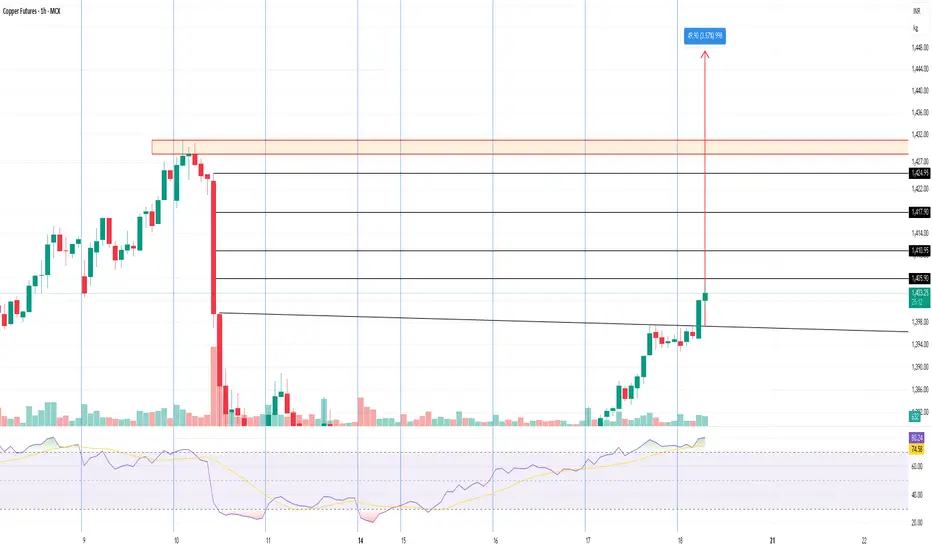
COPPER FUTURES – 1H CHART | MCX BULLISH BREAKOUT SETUP
Copper has broken above the descending trendline with strong bullish momentum. Price is approaching key resistance levels, indicating potential for further upside.
🎯 TRADE LEVELS:
🟢 Entry: Above ₹1,405.90
🛑 Stop Loss: ₹1,398.00
🎯 Target 1: ₹1,410.95
🎯 Target 2: ₹1,417.90
🎯
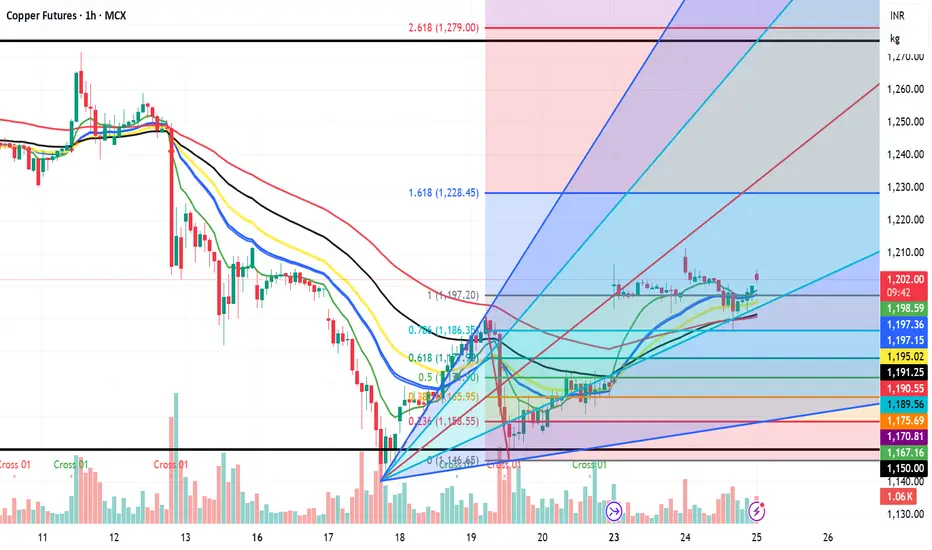
copperhas corrected last week from major resistance zone now coming towards retest zone it will be interesting to see action in 1300-1320 zone if consolidates start making higher high on 2 hour -4 hrs. time frame will confirm start of new upward rally after correction good time to enter it can bounce bac
Copper Poised for Rebound as Demand Recovers and Dollar WeakensCopper’s recent drift lower runs deeper than energy-led macro headwinds. China’s pullback in demand and elevated inventories have weighed on sentiment, though early signs of stabilisation are emerging. With the Fed holding rates and the dollar at risk of softening, the setup is shifting toward a mor
Copper Showing Strength — Upside Potential in Coming DaysCopper is often called “Dr. Copper” because it reflects the health of the global economy. When copper starts stabilizing or showing strength, it usually signals that growth expectations are not collapsing, even if there is short-term uncertainty in the markets.
Right now, despite ongoing global ten
MCX COPPER: RSI Overheated – Prepare for the Final ClimaxTicker: COPPER1! Timeframe: Weekly (1W)
Key Observations
1. Wave Structure
MCX Copper is mirroring the global structure, confined within a perfect rising channel.
The market is in the final stages of Wave 5.
2. The RSI Warning (Crucial)
RSI is at 81.15: This is an extreme "Overbought" reading.
I
copper crucial update in long term copper month chart showing again stair pattern like gold which indicate heavy bull zone possible yes some down correction can be seen due to dxy strength or some profit booking at higher lvl. technical ideas---- copper has strong support 950-40 if mkt comes down due to given reason than should b
See all ideas
A representation of what an asset is worth today and what the market thinks it will be worth in the future.
Sorry, this is only available to registered users
MCX provides data to our registered users only, so to get it you'll need to sign up for a TradingView account.
Displays a symbol's price movements over previous years to identify recurring trends.
Frequently asked questions
The nearest expiration date for Copper Futures is Oct 30, 2020.
Traders prefer to sell futures contracts when they've already made money on the investment, but still have plenty of time left before the expiration date. Thus, many consider it a good option to sell Copper Futures before Oct 30, 2020.