CRUDE REVERSAL POSSIBLE ?TREND - NEGATIVE Previous high must be taken out and sustained
PRESENT ZONE-Taken support at montly demand zone
FORECAST-if Powel statement today is positive it may reverse and gain upto 80 or may fall to 72.5
Crude Oil Futures
Trade ideas

Crude Oil November SeriesCrude Expected upside move above 7121
All study explained on charts
Please do your own study before taking any trades

crude stya blw 6810 looks dwn fall 6760--6728 as per chart more crude stya blw 6810 looks dwn fall 6760--6728 as per chart tutorial purpose---if any one want take short thna sl looks like interday 6851

Crude Oil short covering Short covering possible in crude oil
Above 6477 Closing of 15min candle
Target 6520 possible
Strictly Stop of 6650

CrudeOil Important levels to watch ! CrudeOil important levels to watch are as follows
#Support: 6830
Sell below: 6830 only on 15 minute candle closure below the level.
Target 1: 6760
Target 2: 6700
Target 2: 6650
#Resistance: 6950
Buy Above: 6950 only on 15 minute candle closure Above the level.
Target 1: 7030
Target 2: 7130
=> # Remember each level will act as a support and resistance individually so there is a probability of reversal and a pullback on either side so its better to make an habit to book profits at each targets and re-enter again after a breakout from the same with a proper stoploss as per your own risk appetite.
=> # Please do your own research before initiating any trade. Always use stoploss in order to protect your capital.
=> #If you are Unable to trade properly and dissatisfied with your manual trading results due to psychological disadvantages or busy schedule or "Fear & Greed" emotions, then Algorithmic trading can be the most useful solution to overcome such problems. Kindly follow us and join us using details mentioned below the idea.
=> # Please refer our swing based support and resistance indicator if you find it useful give it a like.
=> # Follow us for more such information and educational ideas and Indicators. Give it a like if you appreciate the idea. Queries will be answered in comment section.
#Disclaimer: This is just a view and published here only for educational purpose, this should not be considered as a buy or sell signal. Trading in stock market may involve financial risk therefore, do your own research before taking any position.

Crude Oil in for a crude shockThis is a zig zag corrective pattern, this is the only correction where the B leg doesn't go back to the highs. The A leg has five waves. B leg is an expanded flat corrective pattern. The C leg has started with a Railway Track which is a directional signal. The C wave will again have 5 waves. The minimum target is the 61.8% of the swing which is 4439. We are talking about a good 33% correction from the current levels.

Crude Oil Bounce Previous 6 October 2023 full day selling and Monday Big Gap Up
Its a reasoning pattern my Expectations is Crude Oil Gap Up on Monday and target possible 6750, 6840, 6900

Crude Oil Important Levels For 3rd November 2023.Dear Traders
These are important Support and Resistance Levels for Crude Oil as per price action.
NOTE:
1: For the candle that has broken resistance or support, let it close before taking a trade. This way you can avoid traps and fake breakouts.
2: The price tends to return to 20 EMA. Hence if the price is very far from 20 EMA, the chances are that the price will go back to 20 EMA unless it's a trending day.
3: Trade using 15 minutes or 5 minutes. The higher the time frame of the candle, the higher the accuracy. Do maintain a minimum 1:2 risk-reward ratio.
Hope the levels stand strong tomorrow.
Happy Trading !!
Only for Educational Purposes.

crudeoil chart analysis 15 minute time if crudeoil sustain above 6840 level then we can expect next target level 6950 .
( educational purpose only)


BANKNIFTY WE CAN GO LONGIn this video we analyse Nifty Banknifty and crude charts in detail and see where it can go in the coming days.
Banknifty is a good long play in the coming week as it was highly oversold. We have discussed Levels, Targets on the same.
Do check it out.
Thanks!

CrudeOil Important levels to watch !! CrudeOil important levels to watch are as follows
#Support: 7025
Sell below: 7025 only on 15 minute candle closure below the level.
Target 1: 6960
Target 2: 6860
#Resistance: 7130
Buy Above: 7130 only on 15 minute candle closure Above the level.
Target 1: 7200
Target 2: 7290-7300
=> # Remember each level will act as a support and resistance individually so there is a probability of reversal and a pullback on either side so its better to make an habit to book profits at each targets and re-enter again after a breakout from the same with a proper stoploss as per your own risk appetite.
=> # Please do your own research before initiating any trade. Always use stoploss in order to protect your capital.
=> #If you are Unable to trade properly and dissatisfied with your manual trading results due to psychological disadvantages or busy schedule or "Fear & Greed" emotions, then Algorithmic trading can be the most useful solution to overcome such problems. Kindly follow us and join us using details mentioned below the idea.
=> # Please refer our swing based support and resistance indicator if you find it useful give it a like.
=> # Follow us for more such information and educational ideas and Indicators. Give it a like if you appreciate the idea. Queries will be answered in comment section.
#Disclaimer: This is just a view and published here only for educational purpose, this should not be considered as a buy or sell signal. Trading in stock market may involve financial risk therefore, do your own research before taking any position.

Crude oil Range bond (6900-7500) ****************************************************************************************************
****************************************************************************************************
* All the information shared in this chart is provided for strictly educational purposes only.
* This chart is sharing information are based on the theory of technical analysis .
* This is not an offer to buy or sell stocks, futures , options, commodity, forex, interests or any other trading security.
* Back test yourself before jump into live market consult your financial adviser and use proper risk management.
******************************************************************************************************
******************************************************************************************************
Crude oil bullish till 7500 (rangebound 6900-7500) my buying price around 6850-7000-7100
Stop loss will be buy at hammer at support with Stop loss of same candle
I will kept my order selling order around 7500 -7550-7600 same stop loss will be inverted hammer candle or any bearish candle.
____________________________________________________________
Visit Us for more details and follow us for more Education Analysis
____________________________________________________________
Trading_Cafe24
Thank you :)

Nifty can make a bottom tomorrow.In this video we study the charts and analyse Nifty, Banknifty and Crude oil charts and see the targets for future and also where it can go from these levels.
Also if you like our video please do like and boost it.

NIFTY TECHNICAL CHART ANALYSIS 27th OctToday let's analyse the technical charts and study where we can see the Indian stock markets going in the coming days.
Nifty is trying to sustain above an important resistance zone and Banknifty is already trading above the resistance levels.
Also Crude cooling off is an good sign for the coming days.
Thanks.

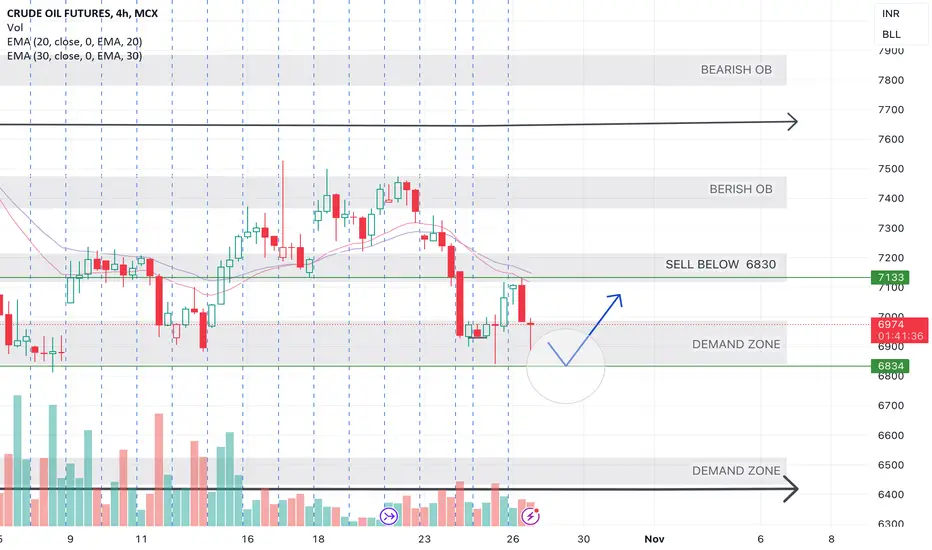
🛢️ #CRUDEOIL Update 📆 26th October
🚨 Critical Juncture Alert 🚨
Crude oil is teetering ( changing direction) near a pivotal level, with potential correction ahead.
Should it hold steady, support at 6830 is plausible in the demand zone.
Crude Oil Important levels to watch !! CrudeOil important levels to watch are as follows
#Support: 7385
Sell below: 7385 only on 15 minute candle closure below the level.
Target 1: 7320
Target 2: 7240
#Resistance: 7475
Buy Above: 7475 only on 15 minute candle closure Above the level.
Target 1: 7525
Target 2: 7580
Target 3: 7680
=> # Remember each level will act as a support and resistance individually so there is a probability of reversal and a pullback on either side so its better to make an habit to book profits at each targets and re-enter again after a breakout from the same with a proper stoploss as per your own risk appetite.
=> # Please do your own research before initiating any trade. Always use stoploss in order to protect your capital.
=> #If you are Unable to trade properly and dissatisfied with your manual trading results due to psychological disadvantages or busy schedule or "Fear & Greed" emotions, then Algorithmic trading can be the most useful solution to overcome such problems. Kindly follow us and join us using details mentioned below the idea.
=> # Please refer our swing based support and resistance indicator if you find it useful give it a like.
=> # Follow us for more such information and educational ideas and Indicators. Give it a like if you appreciate the idea. Queries will be answered in comment section.
#Disclaimer: This is just a view and published here only for educational purpose, this should not be considered as a buy or sell signal. Trading in stock market may involve financial risk therefore, do your own research before taking any position.

Expectations for Crude OIL (NFA)This is what I am thinking for Crude Oil for this week and the upcoming week

Next to fall - NiftyIn this video we discuss how Banknifty has lead the Indian markets for a fall and now the next to go down will be Nifty50.
Do check it out and our old videos, and boost if you liked our ideas.
Thanks.

did u see yesterda crude gold natral gas rocked all gvn lvl heredid u see yesterda crude gold natral gas rocked all gvn lvl here more lvl keep eys here soon will update dontmisssssss

crude spot eyes on 85$ if stya lw nxt dwn rally possible 84-83$crude spot eyes on 85$ if stya lw nxt dwn rally possible 84-83$ in mcx blw 7100 stya blw thna nxt dwn rally 7044-7010++++ sell on rise woth tight sl 86.10

Banknifty May lead the Fall for Indian Markets - Oct 2023In this video we study the charts of BankNifty and analyse as to how this time Banknifty can lead the fall for Nifty and why we need to be cautious in going long on the same.
Please do share your views.

BankNifty Falls - What Next?In this video we use Chart analysis to discuss todays fall on Banknifty and what would be the possible targets for this fall.
Do check it out.
Thanks.
