CRUDE OIL By KRS ChartsDate: 2nd July 2025 / 19:35
Why Crude Oil ?
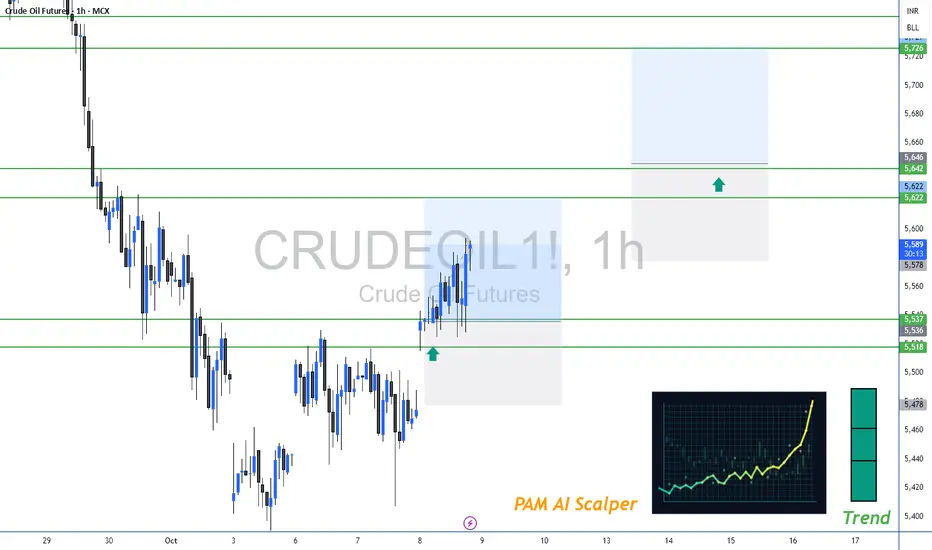
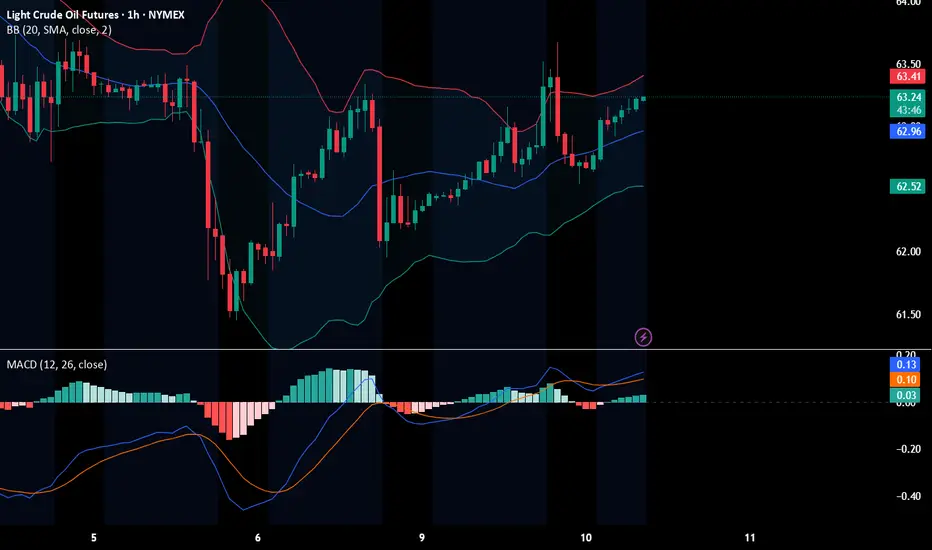
1. Starting with 1H Tf. Accumulation is visible with LLs to Sideways and now HHs & HLs
2. Crude oil Price is currently in Buy Zone with strong support.
3. Recent Gap Dow is likely to be Shakeout for Buyers.
4. In Bigger Timeframe price has made Low in March is likely to be the bottom as per Wave thoery.
5. After that bottom price on Higher low side price accumulating.
6. From Here it seems like bullish side trades will be better option for Crude Oil for Targets which are mentioned in Chart. (Medium Term View).
Crude Oil Mini Futures
Trade ideas

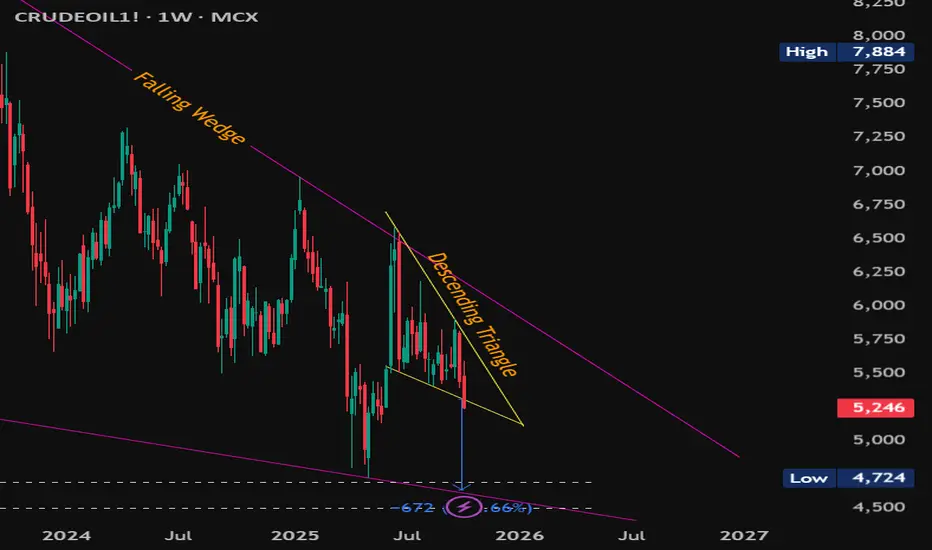
#MCXCrudeOil Weekly – Breakdown into Major Support Zone#MCXCrudeOil Weekly – Breakdown into Major Support Zone
CMP: 5,246
Crude Oil has broken down from a descending triangle with a confirmed weekly close below 5,308 , triggering target of 4,636 . This move unfolds within a larger falling wedge pattern , adding confluence and signaling potential volatility ahead.
This breakdown aligns with two key confluences :
📉 The falling wedge lower trendline.
🟠 A major historical demand zone at 4,692 – 4,499 , which was previous resistance turned strong support on multiple occasions.
This make-or-break support zone could act as:
🔄 A reversal zone , potentially triggering a bullish breakout from the wedge.
📉 Or, if breached, it may invalidate the wedge and lead to extended downside.
Key Levels:
Resistance: 5,903 & 6,184 (price action + wedge top)
Support: 4,692 – 4,499 (confluence zone)
Breakdown Target: 4,636 (descending triangle pattern)
Watch weekly candle behavior near this zone closely for signs of either rejection or continuation .
#CrudeOil #MCXCrude #ChartPatterns #FallingWedge #DescendingTriangle #PriceAction #BreakdownAlert #SwingTrading #CommodityTrading
📌 Disclaimer: This analysis is shared for educational purposes only. It is not a buy/sell recommendation. Please do your own research before making any trading decisions.
Swing Trading SecretsMastering Short-to-Medium Term Market Moves.
1. Understanding the Essence of Swing Trading
Swing trading lies between day trading and long-term investing. Day traders open and close positions within a single day, while investors may hold assets for months or years. Swing traders, however, aim to profit from short-term price swings caused by shifts in market sentiment, news, or momentum.
The main goal of a swing trader is to identify a stock that is likely to move strongly in one direction — up or down — and enter the trade at the beginning of that move. Traders typically use a combination of technical analysis, volume studies, and trend confirmation tools to spot these opportunities.
Key Characteristics of Swing Trading:
Holding period: 2 days to 3 weeks.
Focus on short-term price trends.
Reliance on chart patterns and indicators.
Moderate risk and higher flexibility.
Works well in volatile markets.
Swing trading is ideal for traders who cannot watch the market all day but still want to take advantage of short-term market opportunities.
2. The Secret Foundation: Understanding Market Cycles
The first secret of swing trading mastery is understanding market cycles. Every market moves in repetitive phases — accumulation, uptrend, distribution, and downtrend.
a. Accumulation Phase
This is when smart money (institutional investors) starts buying an asset quietly after a downtrend. The price moves sideways, showing low volatility and volume.
Secret tip: Look for subtle increases in volume and higher lows — signs of accumulation before a breakout.
b. Uptrend Phase
Once accumulation is complete, price begins to rise with increasing momentum. Swing traders thrive here — buying on pullbacks or breakouts.
Secret tip: Use moving averages like the 20-day EMA to confirm trend continuation.
c. Distribution Phase
In this stage, big players start taking profits. The market may move sideways again with false breakouts.
Secret tip: Watch for divergences in RSI or MACD — a classic sign of distribution.
d. Downtrend Phase
Selling pressure increases, creating a bearish phase. Swing traders can profit from short-selling opportunities here.
Secret tip: Trade with the trend — look for pullbacks to resistance levels to enter shorts.
Understanding where the market stands in this cycle is a hidden key to timing your trades effectively.
3. Technical Secrets of Successful Swing Trading
Swing trading is built on the foundation of technical analysis. The most successful swing traders rely on chart patterns, indicators, and price action.
a. Chart Patterns
Recognizing chart patterns can help predict future price moves.
Bullish patterns: Ascending triangle, cup and handle, flag, double bottom.
Bearish patterns: Descending triangle, head and shoulders, double top.
These patterns signal continuation or reversal of trends, guiding entry and exit points.
b. Moving Averages
Moving averages smooth price data and reveal the underlying trend.
20-day EMA: Ideal for short-term trend confirmation.
50-day SMA: Used to identify medium-term trend direction.
Golden Cross: When 50-day SMA crosses above 200-day SMA — strong bullish sign.
c. RSI (Relative Strength Index)
RSI measures momentum.
Buy when RSI is below 30 (oversold) and starts turning up.
Sell when RSI is above 70 (overbought) and begins to fall.
d. MACD (Moving Average Convergence Divergence)
MACD helps identify momentum shifts.
Bullish signal: MACD line crosses above the signal line.
Bearish signal: MACD line crosses below the signal line.
e. Volume Analysis
Volume confirms price movement. A breakout with high volume is more trustworthy than one with low volume.
Secret tip: Combine volume with candlestick patterns to detect genuine breakouts.
4. Price Action Secrets: Reading the Story Behind Candles
Price action is the purest form of market analysis — studying the movement of prices without relying too heavily on indicators.
a. Support and Resistance
Support is where the price tends to bounce up, while resistance is where it usually faces selling pressure.
Secret tip: Strong swing entries occur near these zones with confirmation candles like hammers or engulfing patterns.
b. Candlestick Signals
Certain candlestick formations indicate strong market sentiment:
Bullish engulfing: Reversal signal after a downtrend.
Hammer: Shows rejection of lower prices — potential bottom.
Doji: Indicates indecision — potential reversal ahead.
c. Breakouts and Retests
Breakouts above resistance or below support are strong signals. However, waiting for a retest before entry helps avoid fake moves.
5. Risk Management Secrets: Protecting Your Capital
No swing trading secret is more powerful than proper risk management. Even with the best analysis, losses are inevitable. The key is to limit losses and let profits run.
a. Position Sizing
Never risk more than 1–2% of your total trading capital on a single trade. Calculate your position based on the stop-loss distance.
b. Stop-Loss Placement
Set stop-loss below the most recent swing low (for buy trades) or above swing high (for short trades).
Secret tip: Use ATR (Average True Range) to set dynamic stop-losses based on volatility.
c. Reward-to-Risk Ratio
Always aim for a minimum 2:1 reward-to-risk ratio. This means if you risk ₹1000, your target should be at least ₹2000.
d. Trailing Stop
As the price moves in your favor, use a trailing stop to lock in profits. This ensures you capture bigger moves without exiting too early.
6. Psychological Secrets: Mastering Your Mind
Trading psychology often determines success more than strategy. The secret lies in discipline, patience, and emotional control.
a. Avoid Impulsive Decisions
Don’t trade just because you “feel” the market will move. Wait for confirmation from technical setups.
b. Stick to Your Plan
Have a predefined entry, exit, and stop-loss for every trade. Avoid changing them mid-trade out of fear or greed.
c. Control Overtrading
Swing trading doesn’t require multiple trades daily. Fewer, high-quality trades often produce better results.
d. Embrace Losses
Losses are part of the game. Learn from them instead of chasing revenge trades.
e. Journal Every Trade
Maintain a detailed trading journal — entry reason, outcome, emotions, and lessons learned. This is one of the most underrated swing trading secrets.
7. Secret Strategies That Work
a. Moving Average Crossover Strategy
Use the 20 EMA and 50 EMA.
Buy when 20 EMA crosses above 50 EMA (bullish crossover).
Sell when 20 EMA crosses below 50 EMA (bearish crossover).
Combine this with RSI confirmation for accuracy.
b. Breakout Pullback Strategy
When price breaks a key resistance, wait for a pullback (retest) to enter. This avoids false breakouts and improves entry timing.
c. Fibonacci Retracement Strategy
Use Fibonacci levels (38.2%, 50%, 61.8%) to identify potential pullback zones during a trend. Combine with price action for confirmation.
d. Volume Spike Strategy
Sudden volume increase indicates strong institutional participation. When volume spikes with a bullish candle, it often signals the start of a big swing.
e. Multi-Timeframe Analysis
Analyze higher time frames (like daily or weekly) for trend direction and lower time frames (4-hour or 1-hour) for entries. This alignment increases trade success probability.
8. Swing Trading Tools and Platforms
a. Charting Platforms
TradingView
MetaTrader 4/5
Thinkorswim
b. Scanning Tools
Use screeners to identify stocks showing breakout patterns or high momentum:
Finviz
TrendSpider
StockEdge (for Indian markets)
c. News and Data Sources
Stay updated with earnings announcements, interest rate decisions, and global events — these can influence swing trades significantly.
9. Swing Trading in Indian Markets
In India, swing trading opportunities are abundant due to high market liquidity and volatility in mid-cap and large-cap stocks.
Best Sectors for Swing Trading:
Banking and Financials (HDFC Bank, SBI, ICICI)
IT Stocks (Infosys, TCS, Tech Mahindra)
Energy (ONGC, Reliance Industries)
Auto and Pharma sectors
Secret Tip for Indian Swing Traders:
Focus on F&O stocks with strong volume and price momentum. These tend to show cleaner technical patterns and stronger moves.
10. Common Mistakes and Hidden Lessons
Even experienced swing traders make costly mistakes. Recognizing them early can save your capital.
Common Mistakes:
Ignoring stop-loss or moving it further.
Trading against the trend.
Overusing leverage.
Entering late after a big move.
Lack of patience and consistency.
Hidden Lessons:
Consistency beats intensity.
One good trade can make up for multiple small losses.
Never trade when emotionally unstable.
Backtesting your strategy builds confidence.
11. The Future of Swing Trading: Technology and AI
AI-based tools, algorithmic trading, and real-time data analytics are changing swing trading. Predictive models now identify trend reversals faster than ever. However, human intuition and discipline still remain irreplaceable. The future lies in combining data-driven insights with human strategy.
Conclusion
Swing trading is an art and a science. It demands a sharp eye for patterns, deep understanding of market cycles, strong discipline, and emotional intelligence. By mastering these swing trading secrets, traders can capture lucrative short-term moves while maintaining control over risk.
The true secret, however, lies not in finding the “perfect” strategy — but in consistency, patience, and continuous learning. Markets evolve, but principles of discipline and risk management never change. Whether you trade Indian equities or global markets, swing trading rewards those who respect the process and stay committed to mastering it.
Crude mostly in range buy near support sell near resistance Crudecoil range bound move giving
How My Harmonic pattern projection Indicator work is explained below :
Recent High or Low :
D-0% is our recent low or high
Profit booking zone ( Early / Risky entry) : D 13.2% -D 16.1 % is
range if break them profit booking start on uptrend or downtrend but only profit booking, trend not changed
SL reversal zone (Safe entry ) : SL 23.1% and SL 25.5% is reversal zone if break then trend reverse and we can take reverse trade
Target : T1, T2, T3, T4 and .
Are our Target zone
Any Upside or downside level will activate only if break 1st level then 2nd will be active if break 2nd then 3rd will be active.
Total we have 7 important level which are support and resistance area
Until , 16% not break uptrend will continue if break then profit booking will start.
If break 25% then fresh downtrend will start then T1, T2,T3 will activate
1,3,5,10,15,20 minutes are short term levels.
30 minutes 60 minutes , 2 hours,3 hours, ... 1 day and 1 week chart positional and long term levels

Crude Oil Levels For October 2025Important support and Resistance Levels For Crude Oil.
When Market touches the level, the price action plays important roles.
For More Learning Reach out to us.
CRUDE OILHello & welcome to this analysis
USOIL in daily time frame has activated a bullish Harmonic Gartley suggesting probable upside till $62 - 64.50 - 69 as long as it does not breach $59.25
Crude (MCX) is forming a bullish candlestick - Hammer also suggesting likelihood of a rally till 5575 - 5750 - 6150 as long as it does not breach 5300
After a very long time a bullish formation is giving a follow through signal in CRUDE
All the best
Regards

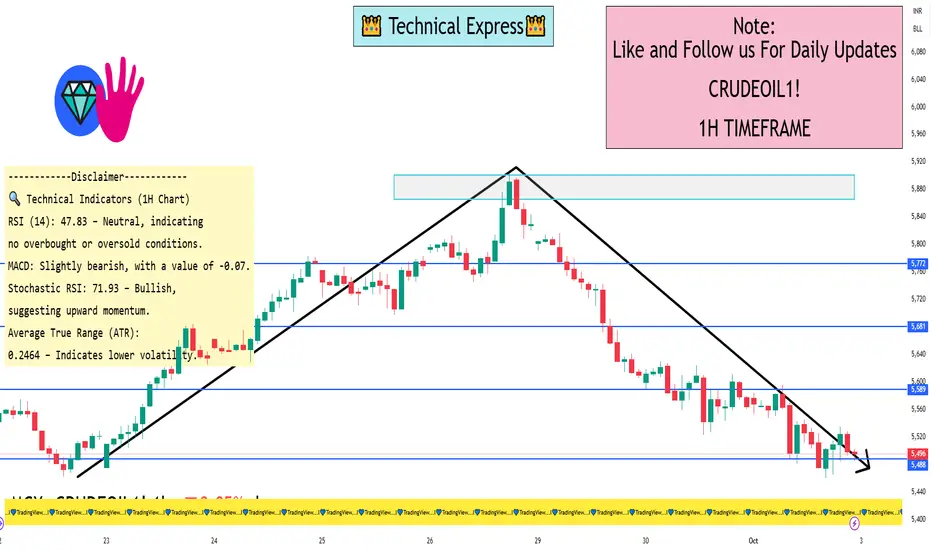
ITC 1 Day View📉 Key Support Levels (1H Timeframe)
₹5,436.67 – Immediate support level.
₹5,357.00 – Next support zone.
📈 Key Resistance Levels (1H Timeframe)
₹5,629.00 – Immediate resistance level.
₹5,708.67 – Next resistance zone.
🔍 Technical Indicators (1H Chart)
RSI (14): 47.83 – Neutral, indicating no overbought or oversold conditions.
MACD: Slightly bearish, with a value of -0.07.
Stochastic RSI: 71.93 – Bullish, suggesting upward momentum.
Average True Range (ATR): 0.2464 – Indicates lower volatility.
Overall, the 1-hour chart shows a neutral to slightly bullish trend, with price action confined between ₹5,436.67 and ₹5,629.00. A breakout above ₹5,629.00 could target ₹5,708.67, while a drop below ₹5,436.67 may lead to retesting lower support levels.
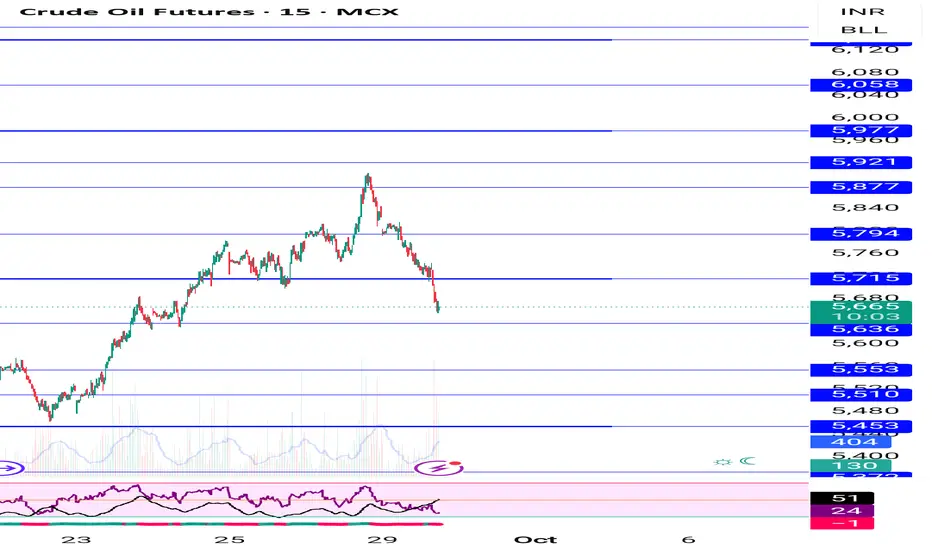
Crude sell recommended near 5780 now Book profit at 5470-5460 Crude sell on eise recommended near 5780 now book profit at 5470-5460 and wait for some consolidation they buy also if inventory data positive
How My Harmonic pattern projection Indicator work is explained below :
Recent High or Low :
D-0% is our recent low or high
Profit booking zone ( Early / Risky entry) : D 12.3% -D 16.1 % is
range if break them profit booking start on uptrend or downtrend but only profit booking, trend not changed
SL reversal zone (Safe entry ) : SL 23.1% and SL 25.5% is reversal zone if break then trend reverse and we can take reverse trade
Target : T1, T2, T3, T4 and .
Are our Target zone
Any Upside or downside level will activate only if break 1st level then 2nd will be active if break 2nd then 3rd will be active.
Total we have 7 important level which are support and resistance area
Until , 16% not break uptrend will continue if break then profit booking will start.
If break 25% then fresh downtrend will start then T1, T2,T3 will activate
1,3,5,10,15,20 minutes are short term levels.
30 minutes 60 minutes , 2 hours,3 hours, ... 1 day and 1 week chart positional and long term levels

Will crude drop to $61.70?hello,
according to my analysis on 2h time frame there is high probability that crude oil futures could drop to 61.7 IN FEW HOURS,

Thematic and Sectoral Rotation Trading1. Introduction
In financial markets, investors and traders are continuously seeking methods to maximize returns while managing risk. Among the myriad strategies, thematic and sectoral rotation trading has gained immense popularity because it aligns investment decisions with evolving economic trends, technological advancements, and market cycles. Unlike traditional strategies that might focus purely on individual securities, sectoral and thematic approaches leverage broader economic patterns, industry performance, and market sentiment.
At its core, sectoral rotation involves shifting capital from one industry sector to another based on their performance in different phases of the economic cycle. Thematic trading, meanwhile, focuses on investing in specific themes or trends, such as renewable energy, digitalization, or electric vehicles, which have potential long-term growth driven by structural shifts in society and the economy.
Understanding these strategies requires a deep dive into economic cycles, market behavior, sector dynamics, and thematic trends.
2. Concept of Sectoral Rotation Trading
2.1 Definition
Sectoral rotation trading is a strategy where investors systematically move investments between sectors to capitalize on varying performances of sectors during different phases of the economic cycle.
2.2 Rationale
Different sectors perform differently depending on macroeconomic conditions. For example:
Early economic recovery: Cyclical sectors like consumer discretionary and technology often lead.
Economic expansion: Industrial and capital goods sectors see strong growth.
Late-stage expansion: Defensive sectors like healthcare, utilities, and consumer staples tend to outperform.
Recession: Safe-haven sectors such as utilities and healthcare gain attention due to lower volatility.
This rotation is based on the understanding that capital flows dynamically between sectors to optimize returns based on economic conditions.
2.3 Sector Classification
Sectors are typically classified into:
Cyclical sectors: Highly sensitive to economic cycles (e.g., consumer discretionary, industrials, technology).
Defensive sectors: Less sensitive to economic cycles (e.g., utilities, healthcare, consumer staples).
Financial sectors: Banks and insurance, which are influenced by interest rate policies.
Commodity sectors: Energy, materials, metals, and mining.
3. Concept of Thematic Trading
3.1 Definition
Thematic trading is investing in broader trends or megatrends that transcend individual sectors. Unlike sectoral trading, themes are based on structural changes in society, technology, or regulations, rather than the economic cycle alone.
3.2 Examples of Themes
Some of the most prominent themes include:
Renewable Energy: Solar, wind, and battery storage companies.
Electric Vehicles (EVs): EV manufacturers, battery producers, and charging infrastructure.
Artificial Intelligence (AI) & Automation: AI software, robotics, and automation solutions.
Healthcare Innovation: Biotech, genomics, telemedicine.
Digital Transformation: Cloud computing, cybersecurity, e-commerce platforms.
3.3 Advantages
Exposure to long-term structural growth.
Diversification beyond traditional sector boundaries.
Ability to capitalize on global megatrends.
4. Key Differences Between Sectoral and Thematic Trading
Feature Sectoral Rotation Trading Thematic Trading
Basis Economic cycles and sector performance Structural trends or megatrends
Time Horizon Medium-term to short-term Medium-term to long-term
Focus Sector performance Specific themes cutting across sectors
Risk Profile Moderately lower if diversified across sectors Can be higher due to concentration in themes
Performance Drivers GDP growth, interest rates, inflation Technological innovation, regulatory changes, societal shifts
Examples Shifting from energy to technology during recovery Investing in EV and renewable energy stocks
5. Economic Cycle and Sector Rotation
The sectoral rotation strategy is closely tied to the economic cycle, which can be divided into four phases:
5.1 Early Recovery
Characteristics: Low interest rates, improving GDP, rising consumer confidence.
Outperforming sectors: Cyclical sectors like consumer discretionary, technology, and industrials.
Trading strategy: Rotate capital from defensive sectors to high-growth cyclical sectors.
5.2 Economic Expansion
Characteristics: High consumer spending, rising corporate profits.
Outperforming sectors: Industrials, financials, materials.
Trading strategy: Increase exposure to sectors benefiting from rising demand and investments.
5.3 Late-Stage Expansion
Characteristics: Slowing growth, inflation concerns, peak corporate earnings.
Outperforming sectors: Defensive sectors such as healthcare, utilities, and consumer staples.
Trading strategy: Shift from high-risk cyclical sectors to low-volatility defensive sectors.
5.4 Recession
Characteristics: Declining GDP, falling corporate profits, rising unemployment.
Outperforming sectors: Utilities, healthcare, consumer staples (defensive sectors).
Trading strategy: Reduce exposure to cyclical sectors and allocate to defensive sectors for capital preservation.
6. Key Indicators for Sectoral Rotation
Traders often use a combination of macro indicators, technical analysis, and sector-specific metrics to guide rotation strategies.
6.1 Economic Indicators
GDP growth
Inflation rate
Interest rates
Consumer confidence
Industrial production
6.2 Market Indicators
Relative strength of sector indices
Sector ETF flows
Price-to-earnings (P/E) ratios
Moving averages and technical trends
6.3 Sector-Specific Metrics
Financials: Net interest margin, credit growth
Technology: Revenue growth, R&D expenditure
Energy: Oil prices, renewable capacity growth
Consumer: Retail sales, brand performance
7. Tools and Instruments for Sectoral Rotation
Sectoral rotation strategies can be executed through multiple instruments:
Sector ETFs: Exchange-Traded Funds representing specific sectors (e.g., technology, healthcare).
Mutual Funds: Sector-specific funds for active management.
Stocks: Direct investment in companies leading their respective sectors.
Options and Futures: Derivatives to hedge or leverage sector exposure.
8. Advantages of Sectoral Rotation Trading
Optimized Returns: Capitalizes on outperforming sectors during different phases.
Diversification: Reduces risk by not being tied to a single sector.
Tactical Flexibility: Can adjust quickly to macroeconomic changes.
Evidence-Based: Relies on historical patterns of sector performance.
9. Risks of Sectoral Rotation Trading
Timing Risk: Misjudging the start or end of a sector’s cycle can lead to losses.
Concentration Risk: Overweighting a sector exposes the portfolio to sector-specific downturns.
Market Volatility: Rapid market changes can disrupt rotation strategy.
Transaction Costs: Frequent trading may increase costs, reducing net returns.
10. Conclusion
Thematic and sectoral rotation trading is a powerful approach to optimizing returns by leveraging macroeconomic cycles and long-term structural trends. While sectoral rotation aligns with the economic phases to identify cyclical and defensive opportunities, thematic trading focuses on long-term megatrends that cut across sectors and markets.
Both strategies require:
Thorough research
Economic and market analysis
Risk management
When implemented correctly, these approaches can help traders and investors maximize growth, diversify risk, and stay ahead of market trends. Integrating sectoral and thematic approaches provides a robust portfolio strategy that captures cyclical performance while riding long-term structural growth trends.
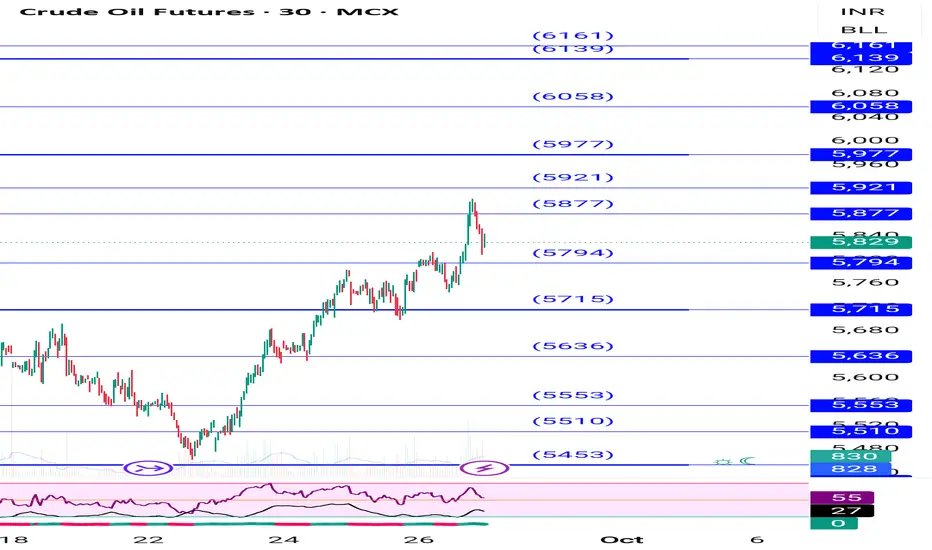
Crude sell Trade given at 5780 5630-5560 next target Crude sell given at 5780 holding sell trade, downside target 5630,5560
How My Harmonic pattern projection Indicator work is explained below :
Recent High or Low :
D-0% is our recent low or high
Profit booking zone ( Early / Risky entry) : D 12.3% -D 16.1 % is
range if break them profit booking start on uptrend or downtrend but only profit booking, trend not changed
SL reversal zone (Safe entry ) : SL 23.1% and SL 25.5% is reversal zone if break then trend reverse and we can take reverse trade
Target : T1, T2, T3, T4 and .
Are our Target zone
Any Upside or downside level will activate only if break 1st level then 2nd will be active if break 2nd then 3rd will be active.
Total we have 7 important level which are support and resistance area
Until , 16% not break uptrend will continue if break then profit booking will start.
If break 25% then fresh downtrend will start then T1, T2,T3 will activate
1,3,5,10,15,20 minutes are short term levels.
30 minutes 60 minutes , 2 hours,3 hours, ... 1 day and 1 week chart positional and long term levels
Crude mcx updated levels buy on dip until 5650 not break Crude mcx updated levels given on chart buy in dip until 5650 not break
How My Harmonic pattern projection Indicator work is explained below :
Recent High or Low :
D-0% is our recent low or high
Profit booking zone ( Early / Risky entry) : D 12.3% -D 16.1 % is
range if break them profit booking start on uptrend or downtrend but only profit booking, trend not changed
SL reversal zone (Safe entry ) : SL 23.1% and SL 25.5% is reversal zone if break then trend reverse and we can take reverse trade
Target : T1, T2, T3, T4 and .
Are our Target zone
Any Upside or downside level will activate only if break 1st level then 2nd will be active if break 2nd then 3rd will be active.
Total we have 7 important level which are support and resistance area
Until , 16% not break uptrend will continue if break then profit booking will start.
If break 25% then fresh downtrend will start then T1, T2,T3 will activate
1,3,5,10,15,20 minutes are short term levels.
30 minutes 60 minutes , 2 hours,3 hours, ... 1 day and 1 week chart positional and long term levels
Crudeoil make or break levelAs indicated in chart crudeoil can give minimum 1:2 or three RR ratio ,plan accordingly after breakout or rejection . I wil plan for sell side ,let us observe what will happen
Disclaimer: it is only for education purpose
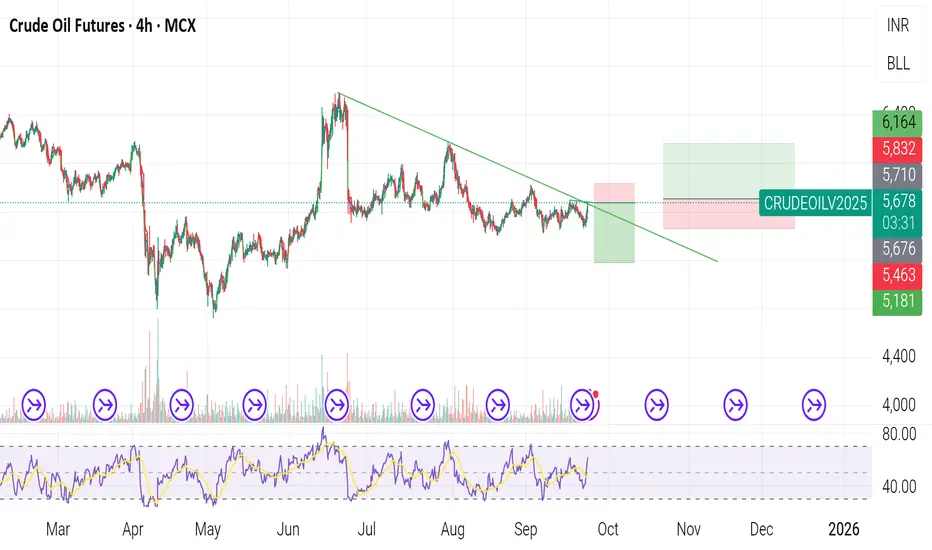
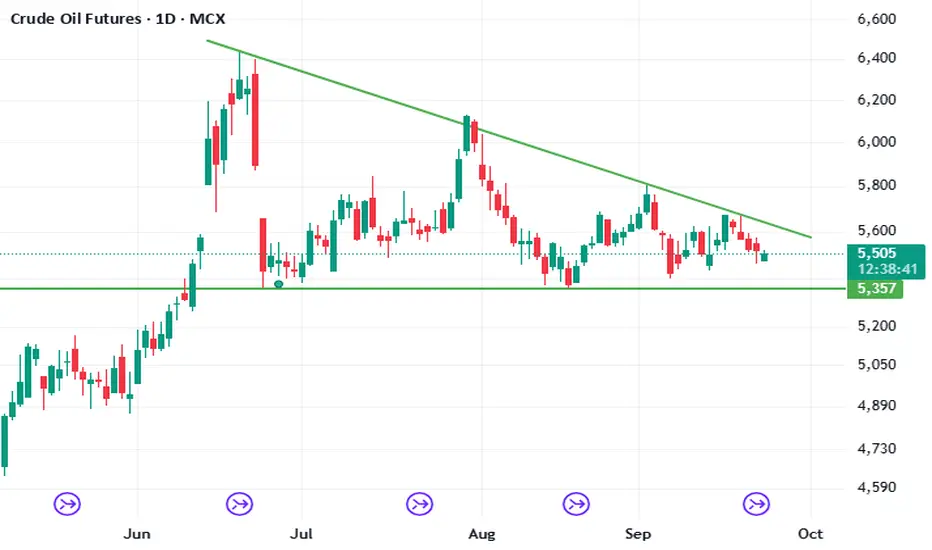
BIG MOVECrude Oil
Look at crude oil daily chart. Big move will come, either bullish or bearish. Observe two trend lines.
I am not SEBI Registered
This is my view Only.
Pair Trading & Statistical Arbitrage1. Introduction
Financial markets are inherently volatile, influenced by macroeconomic trends, geopolitical events, corporate performance, and investor sentiment. Traders and quantitative analysts have developed sophisticated strategies to profit from these market movements while minimizing risk. Among these strategies, Pair Trading and Statistical Arbitrage have gained prominence due to their market-neutral nature, making them less dependent on overall market direction.
Pair trading is a type of market-neutral strategy that exploits the relative pricing of two correlated assets, typically stocks, to profit from temporary divergences. Statistical arbitrage, or Stat Arb, extends this concept to a broader portfolio of securities and uses advanced statistical and mathematical models to identify mispricings.
These strategies are widely used by hedge funds, quantitative trading firms, and institutional investors because they can generate consistent returns with controlled risk. In this essay, we will explore the conceptual framework, methodology, statistical underpinnings, practical applications, challenges, and real-world examples of pair trading and statistical arbitrage.
2. Understanding Pair Trading
2.1 Definition
Pair trading is a relative-value trading strategy where a trader identifies two historically correlated securities. When the price relationship deviates beyond a predetermined threshold, the trader simultaneously takes a long position in the undervalued asset and a short position in the overvalued asset. The expectation is that the price divergence will eventually converge, allowing the trader to profit from the relative movement rather than market direction.
2.2 Market Neutrality
The key advantage of pair trading is its market-neutral approach. Since the strategy relies on the relative pricing between two securities rather than the overall market trend, it is less exposed to systemic risk. For example, if the broader market declines, a pair trade may still be profitable as long as the relative relationship between the two securities converges.
2.3 Selection of Pairs
Successful pair trading depends on selecting the right pair of securities. The two primary methods of selection are:
Correlation-Based Approach: Identify securities with high historical correlation (e.g., 0.8 or higher). Highly correlated stocks are more likely to maintain their relative price behavior over time.
Example: Coca-Cola (KO) and PepsiCo (PEP), which often move in tandem due to similar business models and market factors.
Cointegration-Based Approach: While correlation measures the linear relationship between two assets, cointegration assesses whether a stable long-term equilibrium relationship exists. Cointegrated assets are statistically bound such that their price spread tends to revert to a mean over time, making them ideal candidates for pair trading.
2.4 Entry and Exit Rules
Entry Rule: Open a trade when the spread between the two securities deviates significantly from the historical mean, typically measured in standard deviations (z-score).
Example: If the spread between Stock A and Stock B is 2 standard deviations above the mean, short the overperforming stock and go long on the underperforming stock.
Exit Rule: Close the trade when the spread reverts to its historical mean, capturing the profit from convergence. Stop-loss rules are often applied to manage risk if the divergence widens further instead of converging.
2.5 Example of a Pair Trade
Suppose Stock X and Stock Y historically move together, but Stock X rises faster than Stock Y. A trader could:
Short Stock X (overvalued)
Long Stock Y (undervalued)
If the prices revert to their historical spread, the trader profits from the convergence. The market's overall direction is irrelevant; the trade relies solely on the relative movement.
3. Statistical Arbitrage: Expanding Pair Trading
3.1 Definition
Statistical Arbitrage refers to a class of trading strategies that use statistical and mathematical models to identify mispricings across a portfolio of securities. Unlike pair trading, which focuses on two assets, statistical arbitrage can involve dozens or hundreds of securities and uses algorithms to detect temporary pricing anomalies.
Statistical arbitrage aims to exploit mean-reverting behavior, co-movements, or price inefficiencies while keeping market exposure minimal.
3.2 Core Concepts
Mean Reversion: Many statistical arbitrage strategies assume that asset prices or spreads revert to a historical average. The idea is similar to pair trading but applied to larger groups of assets.
Market Neutrality: Like pair trading, statistical arbitrage attempts to remain neutral with respect to market direction. Traders hedge exposure to indices or sectors to isolate the alpha generated from relative mispricing.
Diversification: By analyzing multiple assets simultaneously, statistical arbitrage spreads risk and reduces dependence on any single asset, increasing the probability of consistent returns.
3.3 Methodology
Data Collection and Cleaning: High-quality historical price data is critical. This includes closing prices, intraday prices, volumes, and corporate actions like splits and dividends.
Model Selection:
Linear Regression Models: Estimate relationships between multiple securities.
Cointegration Models: Identify groups of assets that share long-term equilibrium relationships.
Principal Component Analysis (PCA): Reduce dimensionality and identify dominant market factors affecting securities.
Spread Construction: For a set of assets, construct linear combinations (spreads) expected to revert to the mean.
Trade Signal Generation:
Compute z-scores of spreads.
Enter trades when spreads exceed a predefined threshold.
Exit trades when spreads revert to mean or hit stop-loss levels.
Risk Management:
Limit exposure to any single stock or sector.
Monitor residual market beta to maintain neutrality.
Use dynamic hedging and stop-loss rules.
3.4 Examples of Statistical Arbitrage Strategies
Equity Market Neutral: Long undervalued stocks and short overvalued stocks based on statistical models.
Index Arbitrage: Exploit price differences between a stock index and its constituent stocks.
High-Frequency Stat Arb: Uses intraday price movements and algorithms to capture small, short-lived mispricings.
ETF Arbitrage: Exploit deviations between ETFs and the net asset value (NAV) of underlying assets.
4. Challenges and Limitations
Model Risk: Incorrect assumptions about mean reversion or correlations can lead to significant losses.
Changing Market Dynamics: Relationships between securities may break down due to macroeconomic events, mergers, or structural market changes.
Execution Risk: High-frequency stat arb requires fast execution; delays can erode profitability.
Capital and Transaction Costs: Frequent trades and leverage increase transaction costs, which can offset profits.
Overfitting: Overly complex models may perform well historically but fail in live markets.
5. Conclusion
Pair trading and statistical arbitrage represent a sophisticated intersection of finance, mathematics, and technology. Both strategies exploit mispricings in a market-neutral way, offering opportunities for consistent returns with reduced exposure to market direction. Pair trading focuses on two correlated securities, while statistical arbitrage extends the concept to multi-asset portfolios using statistical models. Despite challenges such as model risk and execution hurdles, these strategies remain fundamental tools for modern quantitative trading, especially in highly efficient markets where traditional directional strategies may struggle.
The future of these strategies is closely tied to technological advancements, from high-frequency trading to artificial intelligence, ensuring that quantitative finance continues to evolve toward more data-driven and precise market insights.
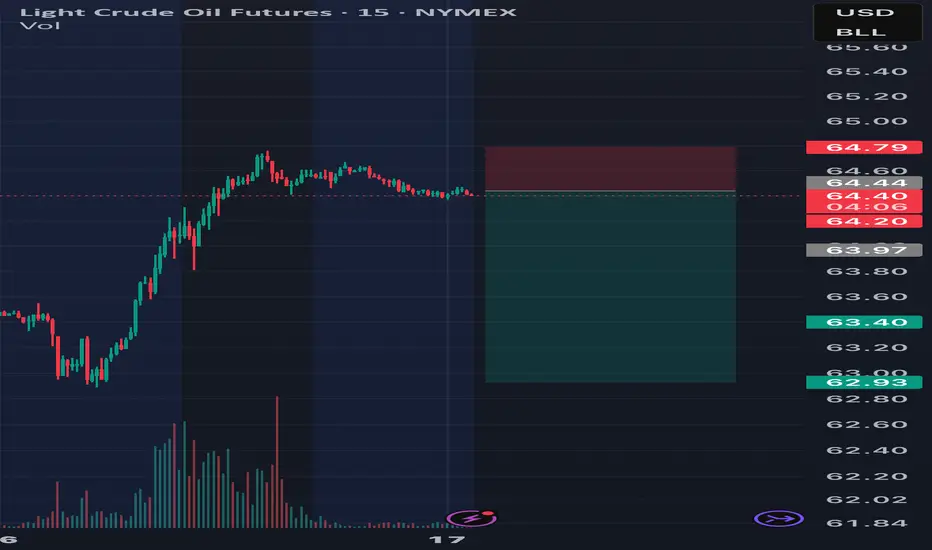
17 sep - CL ShortCrude seems in likely level to bounce back. Crude seems in likely level to bounce Crude seems in likely level to bounce Crude seems in likely level to bounce Crude seems in likely level to bounce back. Crude seems in likely level to bounce Crude seems in likely level to bounce Crude seems in likely level to bounce Crude seems in likely level to bounce back. Crude seems in likely level to bounce Crude seems in likely level to bounce Crude seems in likely level to bounce back
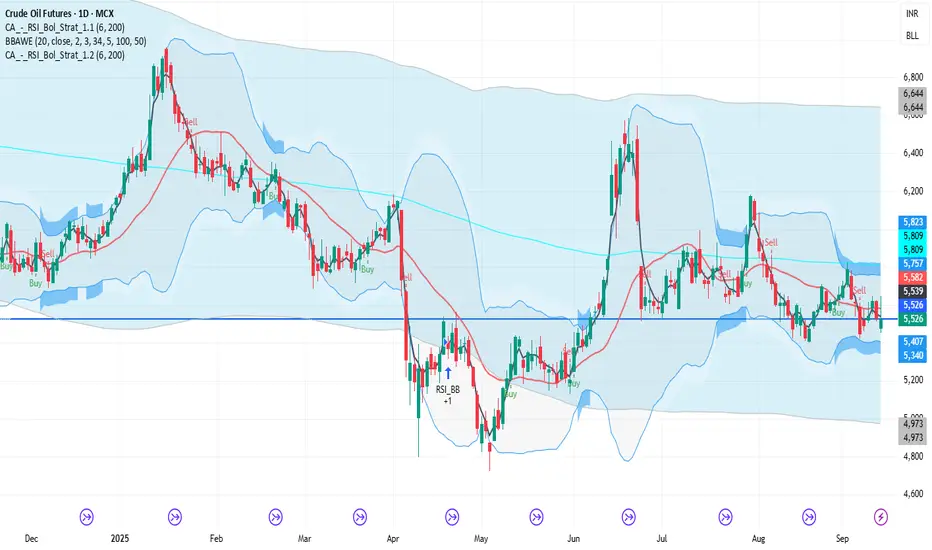
CRUDEOIL1! 1D Time frame📉 Current Market Snapshot (as of September 13, 2025)
Previous Close: ₹5,526
Day's Range: ₹5,454 – ₹5,647
Open: ₹5,480
Close: ₹5,530
📊 Key Levels
Support: ₹5,495, ₹5,442
Resistance: ₹5,663, ₹5,800, ₹5,865
Crude Oil - Sell around 63.80, target 62.00-60.00Crude Oil Market Analysis:
We have been consistently bearish on crude oil for three months now. Our approach is completely in line with the market. As you can see, crude oil currently only needs a simple rebound to make money. Although volatility is minimal, the market will respond accordingly. We are watching for a technical rebound between 61.20 and 60.00. This rebound presents an opportunity to sell again. We sold today when it rebounded to 63.80.
Fundamental Analysis:
The CPI estimate was 2.7%, while the market expected 2.9%, and the price also reached 2.9%. Both market expectations and results were higher than expected, which should have weighed on gold in the long term. However, gold did not fall, but instead surged.
Trading Recommendations:
Crude Oil - Sell around 63.80, target 62.00-60.00

Crude oil - Sell around 65.00, target 62.00-60.00Crude Oil Market Analysis:
Crude oil closed with a small positive candlestick yesterday, rebounding for three consecutive trading days. It appears that the 60.00 support level remains very strong and difficult to break in the short term. If it rebounds near 65.00, continue selling. Crude oil remains bearish. Today's strategy remains unchanged. Yesterday's positive close is somewhat related to the EIA crude oil inventory data.
Fundamental Analysis:
The most important data this week, the CPI, will be released today. The recent surge in gold prices is due to increased market expectations of a September rate cut by the Federal Reserve. This CPI may be the last data the Fed will use as a reference.
Trading Recommendation:
Crude oil - Sell around 65.00, target 62.00-60.00.

Crude oil - Sell around 63.30, target 62.00-60.00Crude Oil Market Analysis:
The strategy for crude oil is simple: a rebound is a selling opportunity. Don't dwell on the details. Crude oil has been fluctuating for a long time. If it breaks through, we will adjust our strategy. Today, sell crude oil around 64.30. The key resistance level for crude oil is around 65.60. A break of this level will trigger a strong trend. Sell crude oil in the short term during short-term fluctuations. A break of 60.00 will open up new room for significant declines.
Fundamental Analysis:
Today, focus on the EIA crude oil inventory data. The CPI will be released tomorrow, and this week's major action will also be tomorrow.
Trading Recommendations:
Crude oil - Sell around 63.30, target 62.00-60.00

WTI(20250910)Today's AnalysisMarket News:
U.S. employment data was significantly revised downward, with jobs for the 12 months ending in March revised down by 911,000.
Technical Analysis:
Today's buy/sell levels:
62.62
Support and resistance levels:
63.88
63.41
63.10
62.14
61.83
61.36
Trading Strategy:
On a breakout above 63.10, consider a buy entry, with the first target at 63.41.
On a breakout below 62.62, consider a sell entry, with the first target at 62.14
Crude oil - Sell near 63.50, target 62.00-60.00Crude Oil Market Analysis:
Crude oil has recently been recovering on the daily chart, with the focus of the recovery shifting downward. Weak inventory data is also the primary reason for the continued decline in crude oil prices. Today, we maintain a bearish outlook and focus on sell orders near 63.50. Don't chase crude oil today; wait for a small rebound before selling. It's been volatile, and the buying and selling game has been going on for a long time.
Fundamental Analysis:
The previous sharp drop in non-farm payroll data led to a surge in gold prices. This week, we will monitor CPI data.
Trading Recommendations:
Crude oil - Sell near 63.50, target 62.00-60.00

Crude oil - Sell around 64.00, with a target range of 62.00-60.0Crude Oil Market Analysis:
Crude oil has recently begun to move slowly, with the daily chart beginning to decline. This week, we will focus on gains and losses around 60.00. If this level is broken, further downside is possible. We remain bearish on crude oil and continue to sell on rebounds. Every rebound presents an opportunity to sell again. Today, we are focusing on sell opportunities near 64.00. The recently released crude oil inventories are essentially flat, with no significant gap to support buying.
Fundamental Analysis:
Last week's non-farm payroll data showed a figure of 22,000, compared to expectations of 75,000 and a previous estimate of 79,000. This result is quite disappointing. In short, fewer US jobs, a weaker economy, and therefore a stronger gold price. This week, we will monitor the CPI.
Trading Recommendations:
Crude oil - Sell around 64.00, with a target range of 62.00-60.00.
