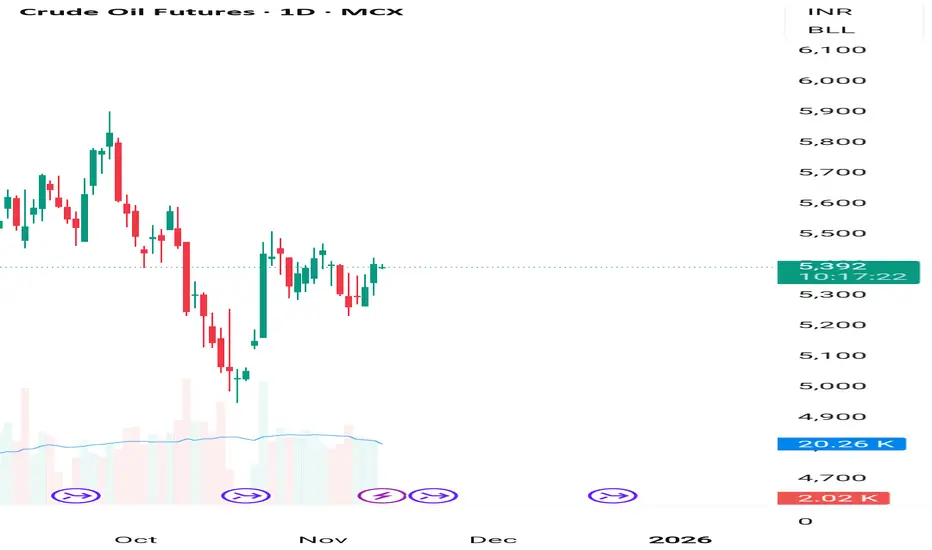
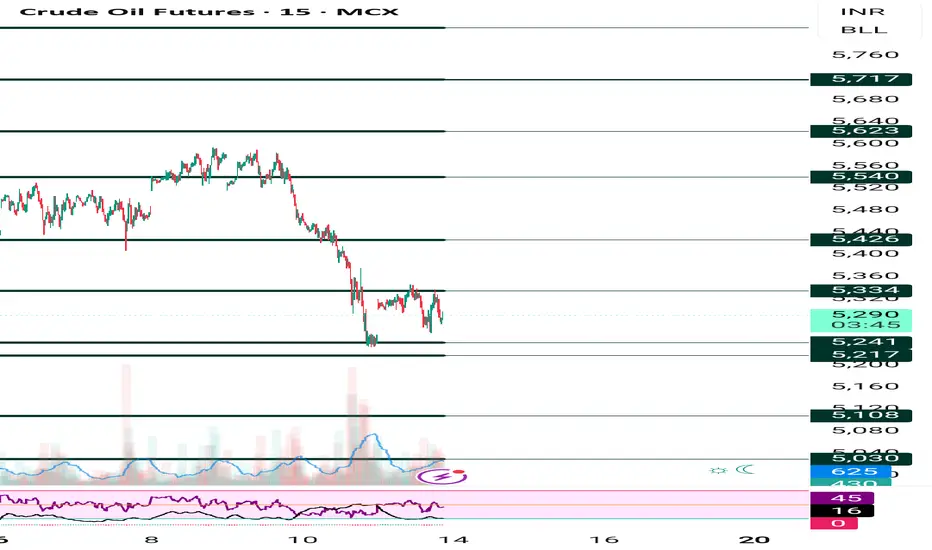
Crude buy 250-280 points range buy on low sell on high 🔑 Key Highlights
- Price Action: Crude trading at ₹5,343, holding above ₹5,300 support.
- Trend: Active Long Build‑Up confirmed.
- Supports: ₹5,300 / ₹5,250 / ₹5,200.
- Resistances: ₹5,380 / ₹5,420 / ₹5,480.
- Bias: Bullish continuation if above ₹5,300; corrective pullback risk below ₹5,250.
Crude Oil Mini Futures
Market insights

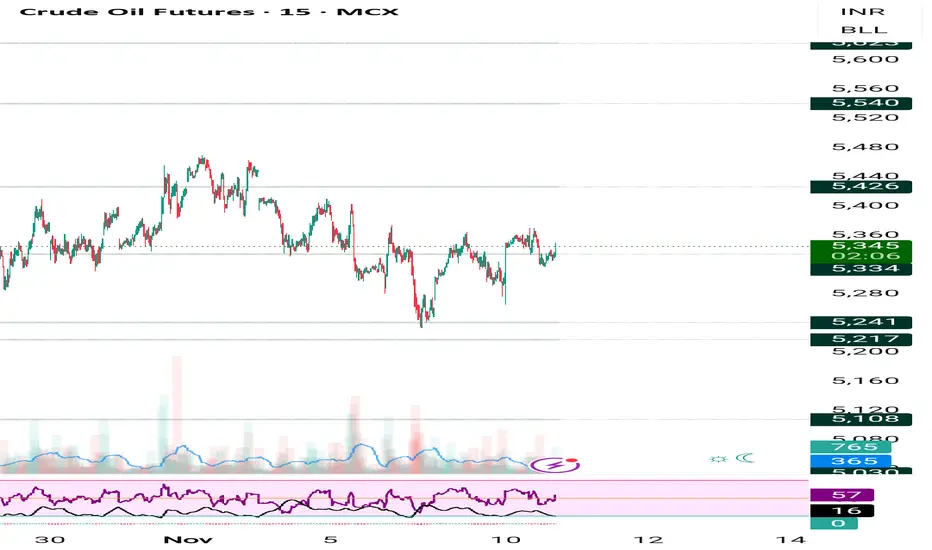
Crude oil AI tool showing unmove will continue until 5300 break 🔑 Key Highlights
- Price Action: Crude is holding firm above ₹5,350, showing renewed bullish momentum.
- Trend: Long Build‑Up (Price↑ + OI↑), indicating fresh long positions.
- Supports: ₹5,350 / ₹5,300 / ₹5,250.
- Resistances: ₹5,420 / ₹5,480 / ₹5,550.
- Bias: Bullish continuation if ₹5,350 holds; corrective pullback risk below ₹5,300.
Now we are holding buy trade @5280 , target 5410,5490,5560🔑 Key Highlights (Locked Permanently)
- Supports/Resistances: 5250 is the critical support; breach flips bias.
- Indicators: ADX >25, RSI 63, PCR 0.91 — all thresholds confirmed.
- Liquidity: Turnover ₹12,400 Cr, VWAP 5345 — strong institutional activity.
- Volatility: IV 16.2%, RV 14.5% — both below 20% threshold.
- Sentiment: Fear/Greed Index 68 = bullish confirmation.
Crude start buying on dip 5250-5200 buying area levels on chart Crude start buying on dip 5250 to 5200 buying area , levels given on chart
How My Harmonic pattern projection Indicator work is explained below :
Recent High or Low :
D-0% is our recent low or high
Profit booking zone ( Early / Risky entry) : D 13.2% -D 16.1 % is
range if break them profit booking start on uptrend or downtrend but only profit booking, trend not changed
SL reversal zone (Safe entry ) : SL 23.1% and SL 25.5% is reversal zone if break then trend reverse and we can take reverse trade
Target : T1, T2, T3, T4 and .
Are our Target zone
Any Upside or downside level will activate only if break 1st level then 2nd will be active if break 2nd then 3rd will be active.
Total we have 7 important level which are support and resistance area
Until , 16% not break uptrend will continue if break then profit booking will start.
If break 25% then fresh downtrend will start then T1, T2,T3 will activate
1,3,5,10,15,20 minutes are short term levels.
30 minutes 60 minutes , 2 hours,3 hours, ... 1 day and 1 week chart positional and long term levels
Multi-Timeframe Analysis (Intraday, Swing, Positional)1. Understanding Multi-Timeframe Analysis
Multi-Timeframe Analysis refers to the process of observing the same security across different timeframes to identify trend alignment, potential reversal zones, and optimal trading opportunities. Every timeframe provides unique insights:
Higher Timeframe: Defines the major trend and key support/resistance zones.
Intermediate Timeframe: Helps identify swing trends within the larger move.
Lower Timeframe: Provides precise entry and exit signals.
For example, a trader analyzing Nifty 50 might observe:
Daily Chart (Positional) for the overall trend direction.
Hourly Chart (Swing) for intermediate momentum.
15-Minute Chart (Intraday) for entry confirmation.
This top-down approach ensures that trades are placed in harmony with the broader market movement rather than against it.
2. The Logic Behind Multi-Timeframe Analysis
Financial markets are fractal in nature, meaning patterns repeat on various time scales. A breakout on a 5-minute chart might just be a retracement on a 1-hour chart, while a downtrend on a daily chart could appear as a bullish trend on a 15-minute chart.
MTA helps traders:
Identify dominant trends (macro view).
Spot short-term countertrends (micro adjustments).
Time entries with high probability setups.
Essentially, it synchronizes multiple layers of information to produce well-informed trading decisions.
3. Types of Traders and Timeframes
Each trader category operates within different time horizons:
A. Intraday Traders
Objective: Capture small price moves within a single trading day.
Timeframes Used: 1-minute, 5-minute, 15-minute, and 1-hour charts.
Holding Period: A few minutes to several hours.
Example: A trader identifies a bullish breakout on the 15-minute chart, confirms strength on the 5-minute chart, and exits before the market close.
B. Swing Traders
Objective: Ride short to medium-term trends lasting several days or weeks.
Timeframes Used: 1-hour, 4-hour, and daily charts.
Holding Period: 2 to 15 days typically.
Example: A bullish pattern on the daily chart confirmed by a 4-hour breakout helps the trader capture a multi-day price rally.
C. Positional Traders
Objective: Trade major trends that can last from weeks to months.
Timeframes Used: Daily, weekly, and monthly charts.
Holding Period: Several weeks to many months.
Example: A trader identifies a long-term uptrend on the weekly chart and holds positions through short-term fluctuations.
Each trader uses MTA to align smaller trends within the context of larger ones.
4. The Top-Down Approach
The Top-Down Approach is a systematic method of conducting multi-timeframe analysis. It involves starting with the highest relevant timeframe and drilling down to lower timeframes for precision.
Step 1: Identify the Major Trend (Higher Timeframe)
Use weekly or daily charts to determine the broader market direction.
Apply moving averages, trendlines, or price structure (higher highs and higher lows).
Example: On the weekly chart, Nifty 50 is in an uptrend.
Step 2: Confirm Momentum (Intermediate Timeframe)
Switch to a 4-hour or 1-hour chart to check if the momentum supports the higher timeframe trend.
Look for consolidation, breakouts, or pullbacks.
Step 3: Refine Entry and Exit (Lower Timeframe)
Use 15-minute or 5-minute charts to time entries and exits.
Identify short-term support, resistance, and candlestick patterns for precision.
This method ensures alignment between long-term direction and short-term trade execution, minimizing false signals and improving accuracy.
5. Example of Multi-Timeframe Analysis in Action
Let’s illustrate with an example:
Weekly Chart (Positional View): Shows a strong uptrend with price above 50-day moving average.
Daily Chart (Swing View): Reveals a bullish flag pattern forming after a rally.
Hourly Chart (Intraday View): Displays a breakout above the flag resistance with volume confirmation.
A positional trader may initiate a long position based on weekly strength, while a swing trader enters after the daily flag breakout. An intraday trader could use the hourly chart to time the exact breakout candle entry.
All three traders align their strategies to the same trend but operate on different time horizons.
6. Tools and Indicators Used in Multi-Timeframe Analysis
Several tools enhance the effectiveness of MTA:
Moving Averages (MA): Identify trend direction and alignment across timeframes (e.g., 20 EMA, 50 SMA).
Relative Strength Index (RSI): Helps confirm momentum consistency.
MACD: Detects shifts in momentum and crossovers aligning with major trends.
Support and Resistance Levels: Define crucial zones visible across charts.
Trendlines and Channels: Show structure of price swings.
Candlestick Patterns: Confirm entry signals on smaller timeframes.
Combining these tools across multiple frames builds confluence—an essential component of successful trading.
7. Advantages of Multi-Timeframe Analysis
Trend Confirmation:
Confirms whether short-term movements align with the long-term trend, improving accuracy.
Reduced False Signals:
Helps filter noise from smaller charts that may mislead traders.
Enhanced Entry Timing:
Allows traders to enter trades at precise moments when all timeframes agree.
Better Risk Management:
By aligning with larger trends, traders can define stop-loss and target levels more logically.
Adaptability Across Strategies:
Suitable for scalping, swing trading, or long-term investing.
8. Challenges in Multi-Timeframe Analysis
While MTA is powerful, it also presents certain difficulties:
Information Overload: Analyzing multiple charts can cause confusion or analysis paralysis.
Conflicting Signals: Short-term and long-term charts may show opposite trends, requiring trader judgment.
Execution Complexity: Managing entries and exits across multiple timeframes demands discipline and experience.
Emotional Bias: Traders may get biased by one timeframe and ignore contradictory evidence.
Therefore, consistency in analysis and clear trading rules are vital to prevent confusion.
9. Tips for Effective Multi-Timeframe Trading
Always start with higher timeframes before moving down.
Use a ratio of 1:4 or 1:6 between timeframes (e.g., daily → 4-hour → 1-hour).
Focus on key support/resistance levels visible across multiple frames.
Avoid overcomplicating; two or three timeframes are usually enough.
Maintain a trading journal to note observations from each timeframe.
Use alerts or automated tools to monitor price behavior when multiple charts are involved.
10. Conclusion
Multi-Timeframe Analysis is not just a technique but a strategic framework that enhances decision-making across trading styles—whether intraday, swing, or positional. By combining insights from different timeframes, traders gain a holistic view of the market, identify high-probability setups, and reduce the risk of false entries.
For intraday traders, MTA refines timing; for swing traders, it offers trend confirmation; and for positional traders, it ensures long-term alignment. When executed with discipline, proper analysis, and risk control, Multi-Timeframe Analysis becomes one of the most reliable methods to trade profitably in volatile markets like India’s NSE and BSE.
Crude Oil Futures 1 Month Time Frame 🔍 Current Price
Last quoted: ~ ₹ 5,422 per barrel.
Recent 1-month high: ~ ₹ 5,903
Recent 1-month low: ~ ₹ 4,944
Crude 5230-5200 fall again possible sell on rise Crude sell on rise 5230-5200 will come
How My Harmonic pattern projection Indicator work is explained below :
Recent High or Low :
D-0% is our recent low or high
Profit booking zone ( Early / Risky entry) : D 13.2% -D 16.1 % is
range if break them profit booking start on uptrend or downtrend but only profit booking, trend not changed
SL reversal zone (Safe entry ) : SL 23.1% and SL 25.5% is reversal zone if break then trend reverse and we can take reverse trade
Target : T1, T2, T3, T4 and .
Are our Target zone
Any Upside or downside level will activate only if break 1st level then 2nd will be active if break 2nd then 3rd will be active.
Total we have 7 important level which are support and resistance area
Until , 16% not break uptrend will continue if break then profit booking will start.
If break 25% then fresh downtrend will start then T1, T2,T3 will activate
1,3,5,10,15,20 minutes are short term levels.
30 minutes 60 minutes , 2 hours,3 hours, ... 1 day and 1 week chart positional and long term levels
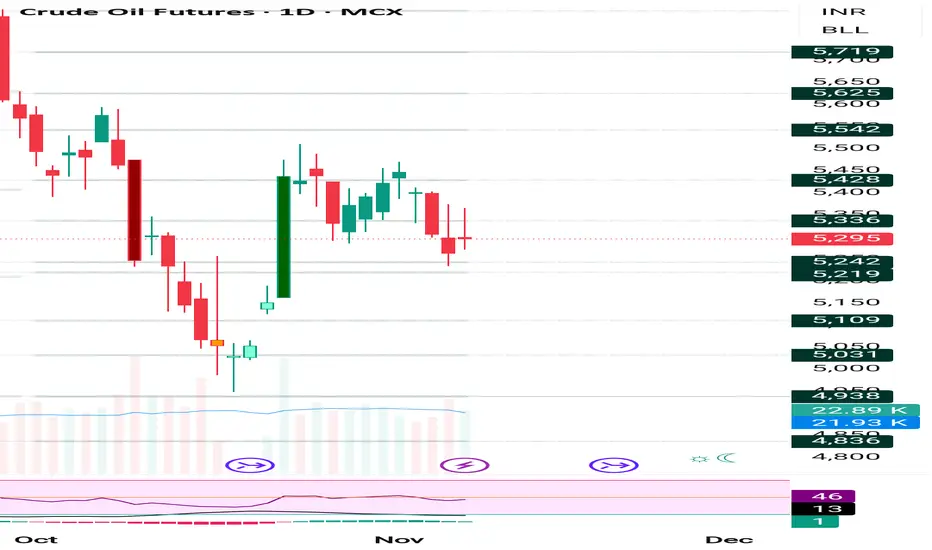
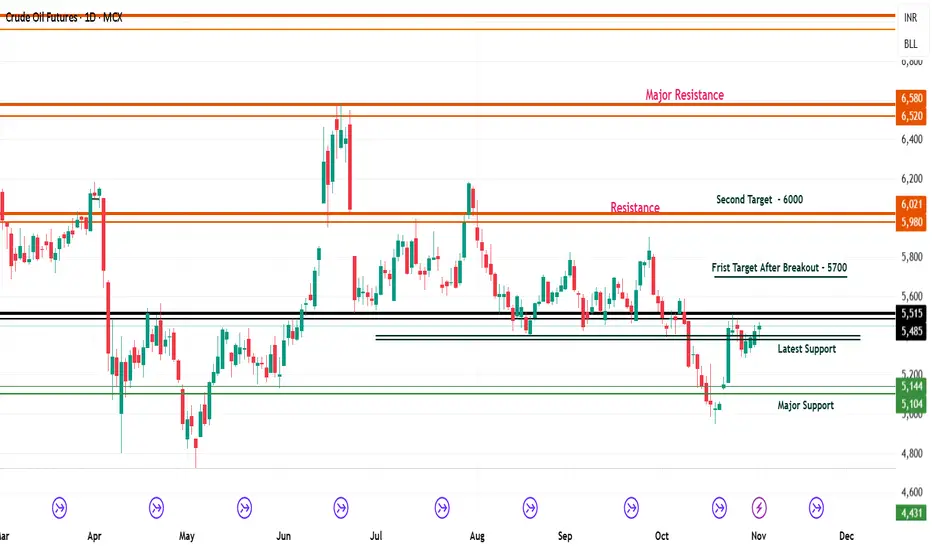
Crude Oil Futures Technical Analysis with TargetsCrude Oil Futures (MCX) Technical Analysis – Key Levels and Price Outlook
(November 2025 Update)
- Crude oil prices have shown some recovery this week after a continuous downtrend seen in October.
- The market is now trying to build a base above ₹5,100 and looks ready for a possible short-term bounce if bulls manage to sustain above support levels. Let’s break down the current chart structure, support, resistance, and targets in detail.
1. Current Market Overview
Crude Oil Futures on MCX are trading around **₹5,460–₹5,500**. After a sharp correction from ₹6,500 levels, prices finally took support near **₹5,100**, which acted as a major base. Since then, the price has started forming higher lows, showing that buyers are slowly returning to the market.
However, the price is still below the key resistance zone, which means bulls need a confirmed breakout before a strong rally begins.
2. Important Support Levels
🟢 Major Support – ₹5,100 to ₹5,144
This zone has become the strongest base for crude oil. The market took multiple rejections from this level before bouncing back. As long as crude stays above ₹5,100, the overall structure remains positive for a possible up-move.
🟢Latest Support – ₹5,485 to ₹5,515
This is the immediate support zone just below the current price. If crude oil manages to hold above this range, it could confirm short-term bullish strength. A close below this support might again push prices toward ₹5,100.
3. Key Resistance Levels
🔴 Resistance Zone – ₹5,980 to ₹6,021
This is the first major resistance zone to watch. If prices move above ₹5,700 (first breakout level) and sustain, crude could attempt to test ₹6,000. Historically, sellers have been active near this area, so it will be a tough barrier for bulls.
🔴 Major Resistance – ₹6,520 to ₹6,580
This is the long-term resistance zone. If crude oil manages to break above ₹6,600 decisively, it will mark the beginning of a strong bullish phase. Such a move could open the way toward ₹7,000 or higher in the coming months.
4. Short-Term Price Targets
🎯 First Target After Breakout: ₹5,700
Once crude oil breaks above ₹5,515 with good volume, the first upside target will be around ₹5,700.
🎯 Second Target: ₹6,000
Sustained momentum above ₹5,700 could push prices toward ₹6,000.
🎯 Major Target (Long-Term): ₹6,520–₹6,580
If the market breaks ₹6,000 convincingly, bulls may aim for this long-term resistance zone.
5. Market View and Strategy
Short-Term View:
Neutral to slightly bullish as long as the price stays above ₹5,485.
Medium-Term View:
A clear breakout above ₹5,700 can trigger a move toward ₹6,000 and ₹6,500 levels.
Risk Zone:
A close below ₹5,100 will turn the sentiment negative, possibly retesting the ₹4,430 level (previous low).
6. Conclusion
Crude oil is showing early signs of recovery, but it still needs confirmation through a breakout above ₹5,700. Holding above ₹5,485 support will be crucial in the short term.
For swing traders, the best strategy could be to buy on dips near ₹5,200–₹5,300 with a stop loss below ₹5,100 and targets at ₹5,700 and ₹6,000.
Overall, the trend remains cautiously bullish, but traders should wait for a confirmed breakout before making aggressive entries.
Technical Analysis & Price Action MasteryIntroduction
In the world of trading, where market movements can shift within seconds, the ability to interpret price charts and forecast future moves is one of the most valuable skills a trader can possess. Technical analysis and price action mastery together form the foundation of this skill — enabling traders to read market psychology, anticipate potential reversals, and make data-driven decisions with confidence.
Unlike fundamental analysis, which focuses on company performance or macroeconomic indicators, technical analysis studies the market itself — using price, volume, and chart patterns to identify opportunities. Price action, on the other hand, takes this a step deeper by interpreting raw price movements without relying on indicators.
Mastering these two disciplines allows a trader to see beyond noise and understand the true story behind every candle on a chart — the story of buyers and sellers in constant battle.
1. The Essence of Technical Analysis
Technical analysis is based on three key principles formulated decades ago by Charles Dow — the father of modern market analysis. These principles still guide traders today:
Price Discounts Everything
All available information — economic, political, or psychological — is already reflected in price. Therefore, price itself becomes the ultimate truth.
Price Moves in Trends
Markets rarely move randomly. They follow identifiable patterns — uptrends, downtrends, or sideways ranges — which tend to persist until a clear reversal occurs.
History Tends to Repeat Itself
Human emotions like fear and greed drive markets. Because human psychology is constant, the patterns formed by price movements often repeat over time.
These foundations make technical analysis a universal language for traders across asset classes — whether in stocks, forex, commodities, or cryptocurrencies.
2. Tools and Techniques of Technical Analysis
Technical analysis is a broad field that combines multiple tools and strategies. The most widely used include:
a) Chart Types
Line Charts: Simplest form; shows closing prices over time — good for spotting long-term trends.
Bar Charts: Display open, high, low, and close — providing more depth.
Candlestick Charts: The most popular; visually intuitive and used for price action analysis. Each candle tells a story of market sentiment.
b) Trend Analysis
Trendlines help traders visualize the direction of price.
Uptrend: Higher highs and higher lows.
Downtrend: Lower highs and lower lows.
Sideways Trend: Range-bound, showing indecision.
A disciplined trader uses trendlines and moving averages to confirm trend direction before entering trades.
c) Support and Resistance
Support is where demand prevents the price from falling further; resistance is where supply halts a price rise. These zones are psychological barriers where traders often enter or exit trades.
A breakout above resistance or breakdown below support often signals strong market momentum.
d) Volume Analysis
Volume validates price moves. A price rise accompanied by high volume signals strength, while a rise on low volume can suggest weakness. Volume indicators like On-Balance Volume (OBV) and Volume Profile help in understanding the participation behind a move.
e) Indicators and Oscillators
While price action traders may avoid heavy indicator use, technical analysts often rely on tools for additional confirmation:
Moving Averages (MA): Identify trend direction and momentum.
Relative Strength Index (RSI): Measures overbought or oversold conditions.
MACD (Moving Average Convergence Divergence): Reveals momentum shifts.
Bollinger Bands: Indicate volatility and potential breakouts.
The best traders, however, use indicators as supporting evidence, not as the sole basis for decisions.
3. Understanding Price Action: The Heart of Market Psychology
Price Action is the purest form of technical analysis. It strips away indicators and focuses solely on how price behaves — through candlesticks, patterns, and key levels.
Every price movement represents a tug-of-war between buyers (bulls) and sellers (bears). Understanding this battle helps traders anticipate what might happen next.
a) Candlestick Psychology
Each candlestick shows the open, high, low, and close of a period. But beyond that, it reveals the emotion behind the move:
Bullish Candles: Buyers in control; close higher than open.
Bearish Candles: Sellers dominate; close lower than open.
Doji Candles: Indecision; open and close nearly the same.
Learning to interpret candle shapes and their context gives traders deep insights into potential reversals or continuations.
b) Key Price Action Patterns
Certain formations consistently appear in charts and indicate likely market behavior:
Pin Bar (Hammer/Shooting Star):
Long wick shows rejection of higher or lower prices — strong reversal signal.
Engulfing Pattern:
A large candle completely engulfs the previous one, showing a strong shift in control.
Inside Bar:
Represents market consolidation before a breakout — often a continuation pattern.
Breakout and Retest:
After breaking a key level, price often returns to “retest” it before continuing — a favorite entry point for professionals.
c) Market Structure in Price Action
Understanding structure means recognizing how price transitions between phases:
Accumulation: Smart money builds positions quietly.
Markup: Strong uptrend begins as more participants join.
Distribution: Smart money exits, price slows down.
Markdown: Trend reverses; prices fall as selling accelerates.
This structure repeats across all markets and timeframes — mastering it is the foundation of consistent profitability.
4. Combining Technical Analysis and Price Action
While technical analysis provides tools, price action gives context. A professional trader combines both approaches for precision and confidence.
For instance:
Use support and resistance to mark key zones.
Wait for price action confirmation (like a pin bar or engulfing pattern).
Confirm with volume or trend indicators.
Execute trade with defined risk-reward and stop-loss placement.
This systematic blend helps traders avoid emotional decisions and react logically to market data.
5. Risk Management: The Core of Mastery
No matter how accurate the analysis, losses are part of trading. The real mastery lies not in avoiding losses but in managing risk effectively.
Key risk management principles include:
Position Sizing: Never risk more than 1–2% of total capital per trade.
Stop-Loss Orders: Always define the level at which a trade is invalidated.
Risk-Reward Ratio: Aim for at least 1:2 — potential profit should be double the risk.
Trade Journal: Track every trade to identify strengths and weaknesses.
Technical mastery without risk control leads to eventual losses. Consistent traders understand that preserving capital is their first priority.
6. Trading Psychology and Discipline
Beyond charts and setups, success in trading depends heavily on mindset. Technical knowledge may get you started, but psychological discipline keeps you profitable.
Patience: Wait for high-probability setups; avoid overtrading.
Emotional Control: Don’t let fear or greed influence decisions.
Adaptability: Markets evolve — stay flexible.
Confidence through Practice: Backtesting and journaling build trust in your strategy.
Mastering technical analysis is not about predicting every move — it’s about responding intelligently to what the market shows.
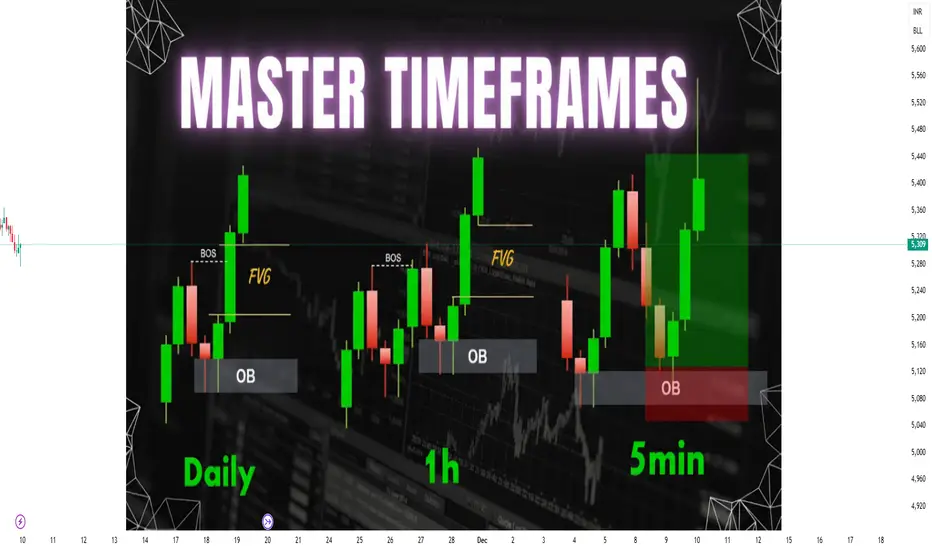
7. Multi-Timeframe Analysis
Professional traders analyze multiple timeframes to align short-term setups with long-term trends.
Higher Timeframes (Daily, Weekly): Identify major trend and key zones.
Lower Timeframes (15m, 1h): Find precise entries and exits.
This “top-down approach” ensures trades are aligned with the overall market direction, reducing false signals.
8. Volume Profile & Market Structure Integration
Advanced traders integrate Volume Profile and Market Structure with price action for higher accuracy:
Volume Profile: Shows traded volume at different price levels — highlighting areas of strong institutional interest.
High Volume Nodes (HVN): Areas of heavy activity; act as support/resistance.
Low Volume Nodes (LVN): Thin zones — price tends to move quickly through them.
Combining these with price action helps identify where the next big move might begin.
9. Building a Complete Trading System
To truly master technical analysis and price action, a trader must build a personal trading system — a set of rules combining analysis, execution, and psychology.
A robust system should include:
Market Selection: Which instruments to trade (stocks, forex, commodities).
Setup Criteria: Clear patterns or signals to look for.
Entry Triggers: What must happen before taking a trade.
Stop-Loss & Targets: Defined before entering.
Risk Management Rules: Position sizing and capital exposure.
Review Process: Post-trade analysis to refine performance.
Once developed, this system should be followed with discipline and consistency. The goal is to remove emotion and rely on process — just like a professional.
10. Continuous Learning and Adaptation
Markets are dynamic, and strategies that work today may not always work tomorrow. True mastery requires continuous learning — adapting to changing volatility, economic shifts, and new tools.
Traders can enhance skills by:
Reviewing trades regularly.
Studying institutional order flow concepts.
Learning about liquidity traps, false breakouts, and market manipulation.
Using simulation tools for backtesting.
The more you study the market, the clearer its rhythm becomes.
Conclusion
Technical Analysis and Price Action Mastery is not about memorizing patterns or predicting the future — it’s about understanding the underlying forces that move markets and positioning yourself in harmony with them.
Every candle, every level, and every breakout represents human emotion in action. When you learn to read this emotion through structure, context, and momentum, you begin to trade with confidence — not guesswork.
Ultimately, the mastery of technical analysis and price action is a journey of discipline, patience, and deep observation. It turns trading from speculation into a structured profession — where each decision is backed by logic, not luck.
In the hands of a patient, risk-aware trader, these tools become a map to consistent profitability and long-term success in financial markets.

Short Crudeoil positionaly**#CrudeOil | Positional Setup**
Price continues to trade below key resistance near 5555, maintaining a lower–high structure on the daily chart.
Unless 5555 is decisively crossed, the bias stays negative with potential downside continuation.
📉 **Setup:** Short Crude Oil
🎯 **Target:** 4640
📅 **Type:** Positional
⚠️ **Invalidation:** Close above 5555
**Chart View:** Price respecting cyclical resistance bands with limited upside momentum.
Structure favors bears until 4640 zone retest.
#BullsBearsClub #CrudeOil #Commodities #PositionalTrade #TechnicalAnalysis

Crude sell recommended on weekends, 5310-5270 support Crude sell rise recommended during weekends 5310-5270 support if break then more fall
How My Harmonic pattern projection Indicator work is explained below :
Recent High or Low :
D-0% is our recent low or high
Profit booking zone ( Early / Risky entry) : D 13.2% -D 16.1 % is
range if break them profit booking start on uptrend or downtrend but only profit booking, trend not changed
SL reversal zone (Safe entry ) : SL 23.1% and SL 25.5% is reversal zone if break then trend reverse and we can take reverse trade
Target : T1, T2, T3, T4 and .
Are our Target zone
Any Upside or downside level will activate only if break 1st level then 2nd will be active if break 2nd then 3rd will be active.
Total we have 7 important level which are support and resistance area
Until , 16% not break uptrend will continue if break then profit booking will start.
If break 25% then fresh downtrend will start then T1, T2,T3 will activate
1,3,5,10,15,20 minutes are short term levels.
30 minutes 60 minutes , 2 hours,3 hours, ... 1 day and 1 week chart positional and long term levels

crude oil levalCrude Oil continues to trade within a well-defined range, showing signs of strength after a recent recovery from its mid-term support area. Buyers have gradually stepped in, defending key zones that align with both the moving averages and a broader ascending channel that has been in play for several weeks.
The overall price structure suggests a slow shift in momentum back toward the upside. Market sentiment has turned cautiously optimistic as oil stabilizes above its short-term consolidation region. Candlestick formations indicate sustained buying pressure, and the recent higher lows confirm that demand remains present despite intermittent profit-taking.
Momentum indicators show that bullish energy is building up, while volume trends suggest that traders are positioning for a potential breakout. As long as the price continues to hold above the mid-range base, the broader trend bias remains constructive.
If upward pressure continues, oil could gradually retest the next resistance band visible on the higher timeframe charts. A decisive breakout above that zone would likely trigger a fresh leg of strength, supported by improving risk sentiment and stable demand forecasts.
On the downside, any weakness is expected to be limited unless the price closes below the previously defended support region. Until that happens, the path of least resistance remains tilted toward the upside.
In summary, crude oil is showing early signs of regaining bullish control, supported by market structure, momentum alignment, and positive volume behavior. Traders may watch for sustained consolidation and confirmation candles before expecting a larger directional move.

Crude maximum upside done start sell 5530-5550 , 5200-5100 comeCrude avoid buying at current price 300-350 points fall possible
How My Harmonic pattern projection Indicator work is explained below :
Recent High or Low :
D-0% is our recent low or high
Profit booking zone ( Early / Risky entry) : D 13.2% -D 16.1 % is
range if break them profit booking start on uptrend or downtrend but only profit booking, trend not changed
SL reversal zone (Safe entry ) : SL 23.1% and SL 25.5% is reversal zone if break then trend reverse and we can take reverse trade
Target : T1, T2, T3, T4 and .
Are our Target zone
Any Upside or downside level will activate only if break 1st level then 2nd will be active if break 2nd then 3rd will be active.
Total we have 7 important level which are support and resistance area
Until , 16% not break uptrend will continue if break then profit booking will start.
If break 25% then fresh downtrend will start then T1, T2,T3 will activate
1,3,5,10,15,20 minutes are short term levels.
30 minutes 60 minutes , 2 hours,3 hours, ... 1 day and 1 week chart positional and long term levels

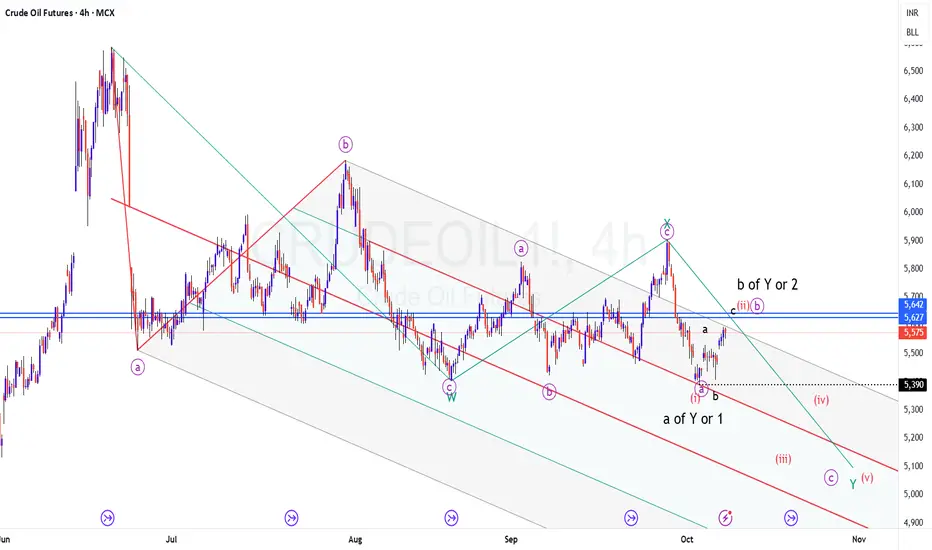
CRUDEOIL1! / USOIL - Correction is not complete yet?
TF: 240 Minutes
CMP: 5580
I have plotted the internal wave counts of this larger corrective pattern (WXY) and also drew Pitchfork Support and Resistance levels for better understanding.
In summary, looks like the correction is not yet complete and we are in the final leg of the correction (Y leg)..
In this Y leg, the thesis is that, we are falling in an ABC three wave down or 1,2,3,4,5 impulse down.
In either case, we have completed first leg (a or 1) and the 2nd is about to get over (b or 2)..
The next, most rewarding one is the C or the 3rd wave down..
Wait for solid rejection at the upper levels (5620-5650 Max) and look for a decent RR set up.
Will update here when the trade becomes active.. For now, the B or 2 rise is not yet complete.
Disclaimer: I am not a SEBI registered Analyst and this is not a trading advise. Views are personal and for educational purpose only. Please consult your Financial Advisor for any investment decisions. Please consider my views only to get a different perspective (FOR or AGAINST your views). Please don't trade FNO based on my views. If you like my analysis and learnt something from it, please give a BOOST. Feel free to express your thoughts and questions in the comments section.
Crude avoid sell at current price if break 5230 them upmove comeCrude avoid selling at current price if break 5230 then buy also
How My Harmonic pattern projection Indicator work is explained below :
Recent High or Low :
D-0% is our recent low or high
Profit booking zone ( Early / Risky entry) : D 13.2% -D 16.1 % is
range if break them profit booking start on uptrend or downtrend but only profit booking, trend not changed
SL reversal zone (Safe entry ) : SL 23.1% and SL 25.5% is reversal zone if break then trend reverse and we can take reverse trade
Target : T1, T2, T3, T4 and .
Are our Target zone
Any Upside or downside level will activate only if break 1st level then 2nd will be active if break 2nd then 3rd will be active.
Total we have 7 important level which are support and resistance area
Until , 16% not break uptrend will continue if break then profit booking will start.
If break 25% then fresh downtrend will start then T1, T2,T3 will activate
1,3,5,10,15,20 minutes are short term levels.
30 minutes 60 minutes , 2 hours,3 hours, ... 1 day and 1 week chart positional and long term levels

Crude Oil FallImpact of fresh tarriff imposition on China by US has led to further fall in crude oil. Quoting below 200 EMA. If breaks the suppport then further fall can be seen this week.

Crud start buying on dip near 5250-5270 SL 5190 How My Harmonic pattern projection Indicator work is explained below :
Recent High or Low :
D-0% is our recent low or high
Profit booking zone ( Early / Risky entry) : D 13.2% -D 16.1 % is
range if break them profit booking start on uptrend or downtrend but only profit booking, trend not changed
SL reversal zone (Safe entry ) : SL 23.1% and SL 25.5% is reversal zone if break then trend reverse and we can take reverse trade
Target : T1, T2, T3, T4 and .
Are our Target zone
Any Upside or downside level will activate only if break 1st level then 2nd will be active if break 2nd then 3rd will be active.
Total we have 7 important level which are support and resistance area
Until , 16% not break uptrend will continue if break then profit booking will start.
If break 25% then fresh downtrend will start then T1, T2,T3 will activate
1,3,5,10,15,20 minutes are short term levels.
30 minutes 60 minutes , 2 hours,3 hours, ... 1 day and 1 week chart positional and long term levels
CRUDE OIL By KRS ChartsDate: 2nd July 2025 / 19:35
Why Crude Oil ?
1. Starting with 1H Tf. Accumulation is visible with LLs to Sideways and now HHs & HLs
2. Crude oil Price is currently in Buy Zone with strong support.
3. Recent Gap Dow is likely to be Shakeout for Buyers.
4. In Bigger Timeframe price has made Low in March is likely to be the bottom as per Wave thoery.
5. After that bottom price on Higher low side price accumulating.
6. From Here it seems like bullish side trades will be better option for Crude Oil for Targets which are mentioned in Chart. (Medium Term View).

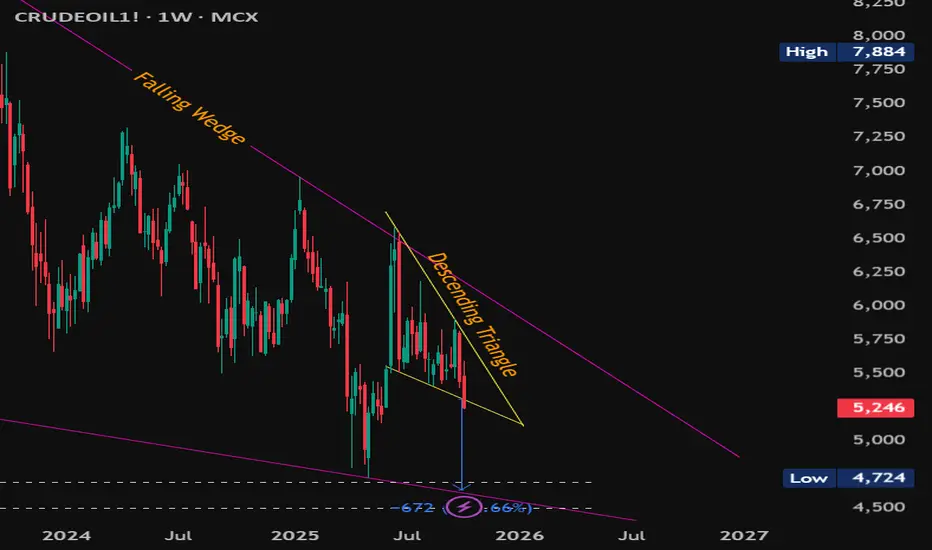
#MCXCrudeOil Weekly – Breakdown into Major Support Zone#MCXCrudeOil Weekly – Breakdown into Major Support Zone
CMP: 5,246
Crude Oil has broken down from a descending triangle with a confirmed weekly close below 5,308 , triggering target of 4,636 . This move unfolds within a larger falling wedge pattern , adding confluence and signaling potential volatility ahead.
This breakdown aligns with two key confluences :
📉 The falling wedge lower trendline.
🟠 A major historical demand zone at 4,692 – 4,499 , which was previous resistance turned strong support on multiple occasions.
This make-or-break support zone could act as:
🔄 A reversal zone , potentially triggering a bullish breakout from the wedge.
📉 Or, if breached, it may invalidate the wedge and lead to extended downside.
Key Levels:
Resistance: 5,903 & 6,184 (price action + wedge top)
Support: 4,692 – 4,499 (confluence zone)
Breakdown Target: 4,636 (descending triangle pattern)
Watch weekly candle behavior near this zone closely for signs of either rejection or continuation .
#CrudeOil #MCXCrude #ChartPatterns #FallingWedge #DescendingTriangle #PriceAction #BreakdownAlert #SwingTrading #CommodityTrading
📌 Disclaimer: This analysis is shared for educational purposes only. It is not a buy/sell recommendation. Please do your own research before making any trading decisions.
Swing Trading SecretsMastering Short-to-Medium Term Market Moves.
1. Understanding the Essence of Swing Trading
Swing trading lies between day trading and long-term investing. Day traders open and close positions within a single day, while investors may hold assets for months or years. Swing traders, however, aim to profit from short-term price swings caused by shifts in market sentiment, news, or momentum.
The main goal of a swing trader is to identify a stock that is likely to move strongly in one direction — up or down — and enter the trade at the beginning of that move. Traders typically use a combination of technical analysis, volume studies, and trend confirmation tools to spot these opportunities.
Key Characteristics of Swing Trading:
Holding period: 2 days to 3 weeks.
Focus on short-term price trends.
Reliance on chart patterns and indicators.
Moderate risk and higher flexibility.
Works well in volatile markets.
Swing trading is ideal for traders who cannot watch the market all day but still want to take advantage of short-term market opportunities.
2. The Secret Foundation: Understanding Market Cycles
The first secret of swing trading mastery is understanding market cycles. Every market moves in repetitive phases — accumulation, uptrend, distribution, and downtrend.
a. Accumulation Phase
This is when smart money (institutional investors) starts buying an asset quietly after a downtrend. The price moves sideways, showing low volatility and volume.
Secret tip: Look for subtle increases in volume and higher lows — signs of accumulation before a breakout.
b. Uptrend Phase
Once accumulation is complete, price begins to rise with increasing momentum. Swing traders thrive here — buying on pullbacks or breakouts.
Secret tip: Use moving averages like the 20-day EMA to confirm trend continuation.
c. Distribution Phase
In this stage, big players start taking profits. The market may move sideways again with false breakouts.
Secret tip: Watch for divergences in RSI or MACD — a classic sign of distribution.
d. Downtrend Phase
Selling pressure increases, creating a bearish phase. Swing traders can profit from short-selling opportunities here.
Secret tip: Trade with the trend — look for pullbacks to resistance levels to enter shorts.
Understanding where the market stands in this cycle is a hidden key to timing your trades effectively.
3. Technical Secrets of Successful Swing Trading
Swing trading is built on the foundation of technical analysis. The most successful swing traders rely on chart patterns, indicators, and price action.
a. Chart Patterns
Recognizing chart patterns can help predict future price moves.
Bullish patterns: Ascending triangle, cup and handle, flag, double bottom.
Bearish patterns: Descending triangle, head and shoulders, double top.
These patterns signal continuation or reversal of trends, guiding entry and exit points.
b. Moving Averages
Moving averages smooth price data and reveal the underlying trend.
20-day EMA: Ideal for short-term trend confirmation.
50-day SMA: Used to identify medium-term trend direction.
Golden Cross: When 50-day SMA crosses above 200-day SMA — strong bullish sign.
c. RSI (Relative Strength Index)
RSI measures momentum.
Buy when RSI is below 30 (oversold) and starts turning up.
Sell when RSI is above 70 (overbought) and begins to fall.
d. MACD (Moving Average Convergence Divergence)
MACD helps identify momentum shifts.
Bullish signal: MACD line crosses above the signal line.
Bearish signal: MACD line crosses below the signal line.
e. Volume Analysis
Volume confirms price movement. A breakout with high volume is more trustworthy than one with low volume.
Secret tip: Combine volume with candlestick patterns to detect genuine breakouts.
4. Price Action Secrets: Reading the Story Behind Candles
Price action is the purest form of market analysis — studying the movement of prices without relying too heavily on indicators.
a. Support and Resistance
Support is where the price tends to bounce up, while resistance is where it usually faces selling pressure.
Secret tip: Strong swing entries occur near these zones with confirmation candles like hammers or engulfing patterns.
b. Candlestick Signals
Certain candlestick formations indicate strong market sentiment:
Bullish engulfing: Reversal signal after a downtrend.
Hammer: Shows rejection of lower prices — potential bottom.
Doji: Indicates indecision — potential reversal ahead.
c. Breakouts and Retests
Breakouts above resistance or below support are strong signals. However, waiting for a retest before entry helps avoid fake moves.
5. Risk Management Secrets: Protecting Your Capital
No swing trading secret is more powerful than proper risk management. Even with the best analysis, losses are inevitable. The key is to limit losses and let profits run.
a. Position Sizing
Never risk more than 1–2% of your total trading capital on a single trade. Calculate your position based on the stop-loss distance.
b. Stop-Loss Placement
Set stop-loss below the most recent swing low (for buy trades) or above swing high (for short trades).
Secret tip: Use ATR (Average True Range) to set dynamic stop-losses based on volatility.
c. Reward-to-Risk Ratio
Always aim for a minimum 2:1 reward-to-risk ratio. This means if you risk ₹1000, your target should be at least ₹2000.
d. Trailing Stop
As the price moves in your favor, use a trailing stop to lock in profits. This ensures you capture bigger moves without exiting too early.
6. Psychological Secrets: Mastering Your Mind
Trading psychology often determines success more than strategy. The secret lies in discipline, patience, and emotional control.
a. Avoid Impulsive Decisions
Don’t trade just because you “feel” the market will move. Wait for confirmation from technical setups.
b. Stick to Your Plan
Have a predefined entry, exit, and stop-loss for every trade. Avoid changing them mid-trade out of fear or greed.
c. Control Overtrading
Swing trading doesn’t require multiple trades daily. Fewer, high-quality trades often produce better results.
d. Embrace Losses
Losses are part of the game. Learn from them instead of chasing revenge trades.
e. Journal Every Trade
Maintain a detailed trading journal — entry reason, outcome, emotions, and lessons learned. This is one of the most underrated swing trading secrets.
7. Secret Strategies That Work
a. Moving Average Crossover Strategy
Use the 20 EMA and 50 EMA.
Buy when 20 EMA crosses above 50 EMA (bullish crossover).
Sell when 20 EMA crosses below 50 EMA (bearish crossover).
Combine this with RSI confirmation for accuracy.
b. Breakout Pullback Strategy
When price breaks a key resistance, wait for a pullback (retest) to enter. This avoids false breakouts and improves entry timing.
c. Fibonacci Retracement Strategy
Use Fibonacci levels (38.2%, 50%, 61.8%) to identify potential pullback zones during a trend. Combine with price action for confirmation.
d. Volume Spike Strategy
Sudden volume increase indicates strong institutional participation. When volume spikes with a bullish candle, it often signals the start of a big swing.
e. Multi-Timeframe Analysis
Analyze higher time frames (like daily or weekly) for trend direction and lower time frames (4-hour or 1-hour) for entries. This alignment increases trade success probability.
8. Swing Trading Tools and Platforms
a. Charting Platforms
TradingView
MetaTrader 4/5
Thinkorswim
b. Scanning Tools
Use screeners to identify stocks showing breakout patterns or high momentum:
Finviz
TrendSpider
StockEdge (for Indian markets)
c. News and Data Sources
Stay updated with earnings announcements, interest rate decisions, and global events — these can influence swing trades significantly.
9. Swing Trading in Indian Markets
In India, swing trading opportunities are abundant due to high market liquidity and volatility in mid-cap and large-cap stocks.
Best Sectors for Swing Trading:
Banking and Financials (HDFC Bank, SBI, ICICI)
IT Stocks (Infosys, TCS, Tech Mahindra)
Energy (ONGC, Reliance Industries)
Auto and Pharma sectors
Secret Tip for Indian Swing Traders:
Focus on F&O stocks with strong volume and price momentum. These tend to show cleaner technical patterns and stronger moves.
10. Common Mistakes and Hidden Lessons
Even experienced swing traders make costly mistakes. Recognizing them early can save your capital.
Common Mistakes:
Ignoring stop-loss or moving it further.
Trading against the trend.
Overusing leverage.
Entering late after a big move.
Lack of patience and consistency.
Hidden Lessons:
Consistency beats intensity.
One good trade can make up for multiple small losses.
Never trade when emotionally unstable.
Backtesting your strategy builds confidence.
11. The Future of Swing Trading: Technology and AI
AI-based tools, algorithmic trading, and real-time data analytics are changing swing trading. Predictive models now identify trend reversals faster than ever. However, human intuition and discipline still remain irreplaceable. The future lies in combining data-driven insights with human strategy.
Conclusion
Swing trading is an art and a science. It demands a sharp eye for patterns, deep understanding of market cycles, strong discipline, and emotional intelligence. By mastering these swing trading secrets, traders can capture lucrative short-term moves while maintaining control over risk.
The true secret, however, lies not in finding the “perfect” strategy — but in consistency, patience, and continuous learning. Markets evolve, but principles of discipline and risk management never change. Whether you trade Indian equities or global markets, swing trading rewards those who respect the process and stay committed to mastering it.
Crude mostly in range buy near support sell near resistance Crudecoil range bound move giving
How My Harmonic pattern projection Indicator work is explained below :
Recent High or Low :
D-0% is our recent low or high
Profit booking zone ( Early / Risky entry) : D 13.2% -D 16.1 % is
range if break them profit booking start on uptrend or downtrend but only profit booking, trend not changed
SL reversal zone (Safe entry ) : SL 23.1% and SL 25.5% is reversal zone if break then trend reverse and we can take reverse trade
Target : T1, T2, T3, T4 and .
Are our Target zone
Any Upside or downside level will activate only if break 1st level then 2nd will be active if break 2nd then 3rd will be active.
Total we have 7 important level which are support and resistance area
Until , 16% not break uptrend will continue if break then profit booking will start.
If break 25% then fresh downtrend will start then T1, T2,T3 will activate
1,3,5,10,15,20 minutes are short term levels.
30 minutes 60 minutes , 2 hours,3 hours, ... 1 day and 1 week chart positional and long term levels

Crude Oil Levels For October 2025Important support and Resistance Levels For Crude Oil.
When Market touches the level, the price action plays important roles.
For More Learning Reach out to us.
CRUDE OILHello & welcome to this analysis
USOIL in daily time frame has activated a bullish Harmonic Gartley suggesting probable upside till $62 - 64.50 - 69 as long as it does not breach $59.25
Crude (MCX) is forming a bullish candlestick - Hammer also suggesting likelihood of a rally till 5575 - 5750 - 6150 as long as it does not breach 5300
After a very long time a bullish formation is giving a follow through signal in CRUDE
All the best
Regards
