Crude oil sell on rise we will see 6330 , SL 6750 sell active Disclaimer -
This information is only for educational purposes, this is not for any buy or sell recommendations .
On Our Harmonic pattern indicator
based trade setup take trade as explained below :-
ENTRY -
When price breaks 30% retracement Which is D points then take Entry on Buy or Sell Trade
SL -
SL is (-3%) Which is mentioned in Chart . our SL is just above or below of Recent high or Low .
TARGET -
Target 1- (T1 : 61.8 %)
Target 2- (T2 : 88.6 %)
Target 3- (T3 : 127.2 %)
Target 4- (T4 : 161.8 %)
Please note:-
It's working on news based and volitile market very well so exit if SL hit
Crude Oil Mini Futures
Market insights

WTI Crude Oil’s pullback appears elusive beyond $78.00WTI crude oil pares the biggest daily gain in a week while posting mild losses near $79.50 early Tuesday. Even so, the black gold holds onto the previous trading beyond the 200-SMA and a downward-sloping resistance line from late April. Also keeping the energy buyers hopeful are the bullish MACD signals and upbeat RSI (14) line. It’s worth noting, however, that a 15-week-old horizontal resistance area surrounding $80.50-81.00 appears a tough nut to crack for the bulls. Following that, the quote will aim for the late April swing high of around $84.50 before challenging the yearly high marked in April near $87.70.
Alternatively, the WTI crude oil’s further decline could highlight the seven-week-old resistance-turned-support line surrounding $78.50 for sellers. However, the energy bears remain off the table unless witnessing a clear downside break of the 200-SMA support of nearly $77.90. Following that, the previous monthly bottom of $76.15 will try stopping the downside before allowing sellers to challenge the yearly bottom of $72.48 marked earlier in June.
Overall, the WTI Crude Oil price remains on the bull’s radar unless portraying successful trading beyond the 200-SMA. The upside move, however, needs validation from $81.00 and the fundamentals.

CRUDEOIL UPDATE - JUNE 14
Technical Analysis:
Crude oil prices closed above a key resistance level of $65.88 on Friday.
This breakout suggests a potential continuation of the uptrend.
Target:
Crude Oil (CL) - Potential Breakout Targeting 6650 - 6700
Current Price: Above 6588
If the bulls can maintain momentum, the next potential target zone could be 6622 - 6650
Key Levels:
Resistance: 6622, 6650
Support: 6588 (broken)
The overall market sentiment and any relevant news events can impact the price movement.
This is just a technical analysis, and other factors should be considered before making any trading decisions.
Disclaimer: This information is for educational purposes only and should not be considered financial advice. Please consult with a licensed financial professional before making any investment decisions.

Crude we booked 500 points profit at 6600 avoid any buy tradenowDisclaimer -
This information is only for educational purposes, this is not for any buy or sell recommendations .
On Our Harmonic pattern indicator
based trade setup take trade as explained below :-
Early trades Buy or sell below/ above 23.6 %, safe trades buy or sell above / below 41% , after taking trade next upside or downside levels will be target ,
When reverse buy or sell signal appear then book profit on Target or trail SL to 23.6 % If trailing SL hit then early trade can be taken above or below 23.6 and safe trade can b taken above/ below 41% ..
Please note:-
It's working on news based and volitile market very well so exit if SL hit

Crude oil possible short for very short termCrude oil can be a possible short and can be covered after a small down move around 6400. if it breaks 6400 levels then 2nd target at 6300 and final target near 6100.

CRUDEOIL WEEKLY CHART CRUDEOIL Looks like formed a Head and Shoulder Pattern - How many of you identified.
No confirmation in breakdown.

Crude Oil Technical Analysis | MCX | June 12th - 13th Crude Oil Technical Analysis: Potential Bullish Breakout
Oil prices are rising on news of lower-than-expected US crude oil inventories and a bullish outlook for global oil demand.
Technical Analysis:
A potential bullish breakout is forming above 6570.
Trading Strategy
Entry: Long above $6570 with sustained move (>50-60 points) to confirm the breakout.
Targets:
T1: 6680 (1st profit target, +100 points from entry)
T2: 6767 (2nd profit target, +200 points from entry)
Stop-Loss: Below 6510 (placement below potential support level)
Risk Management:
Always remember to practice proper risk management. This strategy suggests a stop-loss placement 50-60 points below the entry point, limiting potential losses if the price reverses.
Disclaimer: This information is for educational purposes only and should not be considered financial advice. Please consult with a licensed financial professional before making any trading decisions.

Crude MCx buy given at 6100 , 425 points profit hold buy 6600,++Disclaimer -
This information is only for educational purposes, this is not for any buy or sell recommendations .
On Our Harmonic pattern indicator
based trade setup take trade as explained below :-
Early trades Buy or sell below/ above 23.6 %, safe trades buy or sell above / below 41% , after taking trade next upside or downside levels will be target ,
When reverse buy or sell signal appear then book profit on Target or trail SL to 23.6 % If trailing SL hit then early trade can be taken above or below 23.6 and safe trade can b taken above/ below 41% ..
Please note:-
It's working on news based and volitile market very well so exit if SL hit

CRUDEOIL UPDATE JUNE 12Crude Oil Breakout Levels (Technical Analysis, Disclaimer Applies)
Breakout Strategy:
Long Entry: Above 6510 with sustained move (>90 points) above breakout point.
Targets: 6560 - 6600 (profit targets based on potential price movement after breakout).
Stop-Loss: Below 6400 (potential loss if price falls below support).
Neutral Zone: Price remains between 6400 and 6510. No clear directional bias in this range.
Breakdown Scenario:
Short Entry: Below 6400 with confirmation (e.g., additional bearish candlestick pattern).
Target: Open (depends on market momentum after breakdown). Short sellers aim to profit from price decline.
Disclaimer: This information is for educational purposes only and should not be considered financial advice. Please consult with a licensed financial professional before making any trading decisions. Past performance is not necessarily indicative of future results.

Crude oil forming a huge triangle Crude oil will show further direction after it comes out of this pattern

Long CRUDEOIL | TARGETS 7000 & 7300 in 1-2 monthsBased on technical analysis, I believe crude oil is likely to break through the minor rejection trendline and move upwards towards the higher trendline.
At the current stage, our entry point is around 6500, with target levels set at 7000 and 7300.
Furthermore, I anticipate that this time it will break through the major trendline, initiating Wave 3 and potentially aiming for 8000.
Imp. Note: This analysis is provided for informational purposes only and does not constitute a direct recommendation to buy or sell stocks. Investors should conduct their own research and consult with financial advisors before making any investment decisions, as market conditions and individual circumstances may vary.
Market Risk: However, it's important to acknowledge the inherent risks associated with investing in the stock market, including but not limited to volatility, economic downturns, regulatory changes, and unforeseen events that can impact stock prices. It's crucial for investors to remain vigilant and diversify their portfolios to mitigate potential losses.

Crude buy holding from 6100 hold it Target 6790-6800Disclaimer -
This information is only for educational purposes, this is not for any buy or sell recommendations .
On Our Harmonic pattern indicator
based trade setup take trade as explained below :-
Early trades Buy or sell below/ above 23.6 %, safe trades buy or sell above / below 41% , after taking trade next upside or downside levels will be target ,
When reverse buy or sell signal appear then book profit on Target or trail SL to 23.6 % If trailing SL hit then early trade can be taken above or below 23.6 and safe trade can b taken above/ below 41% ..
Please note:-
It's working on news based and volitile market very well so exit if SL hit

CRUDE oil buy on dip levels mention on chart Disclaimer -
This information is only for educational purposes, this is not for any buy or sell recommendations .
On Our Harmonic pattern indicator
based trade setup take trade as explained below :-
Early trades Buy or sell below/ above 23.6 %, safe trades buy or sell above / below 41% , after taking trade next upside or downside levels will be target ,
When reverse buy or sell signal appear then book profit on Target or trail SL to 23.6 % If trailing SL hit then early trade can be taken above or below 23.6 and safe trade can b taken above/ below 41% ..
Please note:-
It's working on news based and volitile market very well so exit if SL hit

Crude Oil MCX Future Intraday Analysis 7 June, 24📈 Crude Oil MCX Future Technical Chart Analysis
📆 Daily Levels for 7 June, 2024:
📊 Range Point: 6326
📉 Day Range: 138
📈 Buy Above: 6279
💼 Average At: 6263
🎯 Buy Target 1: 6411
🎯 Buy Target 2: 6464
🛑 Buyer Stoploss: 6233
💰 Sale Below: 6247
🎯 Sale Target 1: 6241
🎯 Sale Target 2: 6188
🛑 Seller Stoploss: 6293
✨ Boost, follow, and engage for more insightful updates. For detailed analysis and live discussions, check out our community channels. Your engagement fuels our dedication to providing top-notch content! 🚀❤️
#Crude #CrudeOil #CrudeOption #CrudeFuture #MCX #MCXLevels #OilFuture

IS RAPID BUYINGTAKING PLACE IN CRUDE??Discover the serenity of joy and peace in every moment, enriching your journey with sublime beauty.
I delve into the dynamic world of growing stocks, providing valuable analysis and commentary on significant levels that traders need to keep an eye on. From crucial support and resistance zones to potential breakout points, I aim to equip you with the insights you need to navigate the stocks with confidence.
Stay tuned for regular updates, technical analysis, and market commentary to help you stay ahead of the curve in your trading journey. Whether you're a seasoned investor or just dipping your toes into the market, our publication strives to provide actionable insights to enhance your trading decisions.
I uncover the nuances of all stocks & indices and uncover opportunities in this ever-evolving market landscape. Don't miss out on the latest analysis – hit that follow button and embark on your journey to trading success with me

CRUDEOIL UPDATE | 6th - 7th JUNECrude oil is looking bullish above 6255! Target prices are set at 6315 and 6355.
However, it's important to be aware of the rising wedge pattern that's forming, as this could indicate a potential bearish reversal.
Here's a breakdown of the analysis:
Current Price: 6238
Target 1: 6315
Target 2: 6355
Rising Wedge Pattern: This pattern can signal a trend reversal, so be cautious even though the price is bullish right now.
Disclaimer: This information is for educational purposes only and should not be considered financial advice. Please consult with a qualified financial advisor before making any investment decisions.

Crude Oil MCX Future Intraday Technical Analysis 6 June, 24📈 Crude Oil MCX Future Technical Chart Analysis
📆 Daily Levels for 6 June, 2024:
📊 Range Point: 6190
📉 Day Range: 118
📈 Buy Above: 6152
💼 Average At: 6138
🎯 Buy Target 1: 6263
🎯 Buy Target 2: 6308
🛑 Buyer Stoploss: 6113
💰 Sale Below: 6124
🎯 Sale Target 1: 6117
🎯 Sale Target 2: 6072
🛑 Seller Stoploss: 6163
✨ Boost, follow, and engage for more insightful updates. For detailed analysis and live discussions, check out our community channels. Your engagement fuels our dedication to providing top-notch content! 🚀❤️
#Crude #CrudeOil #CrudeOption #CrudeFuture #MCX #MCXLevels #OilFuture

CRUDE is ready to go up from long term SupportCrude oil will blast upside if Support is held !!
Crude Oil (MCX) is around 6200
Its long term Support or Law of Polarity is around 5900-6000
These channels are working since 2015 in Crude Linear chart
Price action & RSI is indicating that Crude to take support around these levels.
Thank You !!

Buy Buy crude at cmp 6247 sl 6210 target 6350-6389
Disc : It's not an investment advise to buy or sell

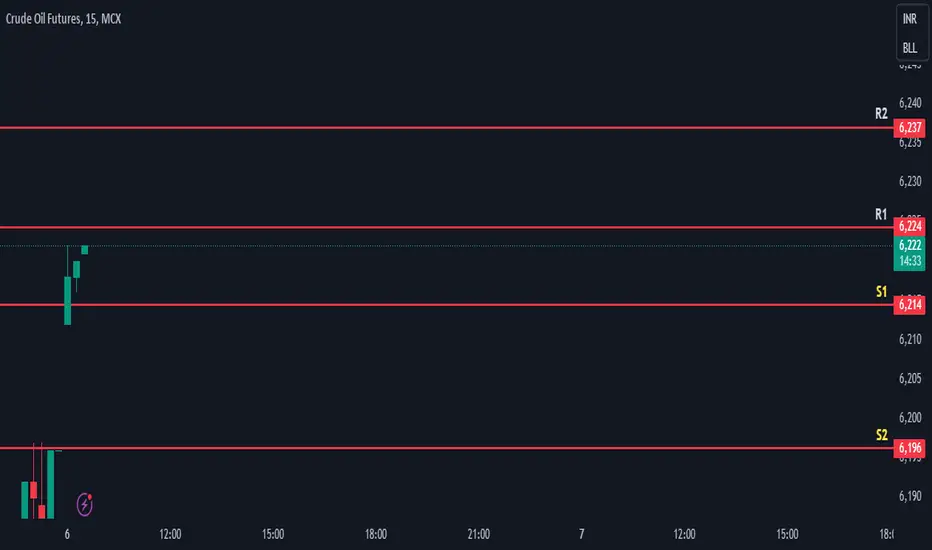
MCX Crude 06/06 daily levelsDear traders,Important daily levels for mcx crude - 06/06/2024
Important support
S4-6171, S3-6182, S2-6196
Important resistance
R3-6263, R2-6237
CRUDE OIL is at Support Line1. Price is respecting the trendline from Feb 2021 and it is now near the trendline and formed Hammer candle previous day.
2. Price might go up atleast 6500 in short term
3. If the price breaks the red line it will go upto 7400.
Please like and share if you like this idea.
Chart is Self Explanatory. I am not SEBI registered advisor and all Ideas posted by me are for Educational Purpose.

Crude Oil MCX Future Intraday Chart Analysis for 5 June, 2024📈 Crude Oil MCX Future Technical Chart Analysis
📆 Daily Levels for 5 June, 2024:
📊 Range Point: 6167
📉 Day Range: 102
📈 Buy Above: 6136
💼 Average At: 6124
🎯 Buy Target 1: 6230
🎯 Buy Target 2: 6269
🛑 Buyer Stoploss: 6102
💰 Sale Below: 6112
🎯 Sale Target 1: 6104
🎯 Sale Target 2: 6065
🛑 Seller Stoploss: 6146
✨ Boost, follow, and engage for more insightful updates. For detailed analysis and live discussions, check out our community channels. Your engagement fuels our dedication to providing top-notch content! 🚀❤️
#Crude #CrudeOil #CrudeOption #CrudeFuture #MCX #MCXLevels #OilFuture

CRUDE OIL ( 8-10% UPSIDE POTENTIAL)
WTF as we can see HTF structure bullish and price makes HH & HL pattern and face resistance from HTF counter trendline 7150-7200 around....
DAILY TF consolidation in HTF demand zone
LTF structure turns bullish n start making HL & HH....
on DAILY TF RSI N BOLLINGER BAND also support the IDEA...
price may face resistance at 6550-6580 LTF supply zone,6750-6850 daily supply , 6950-7000 HTF supply zone....
so plan your trade accordingly...
Activate to view larger image,
