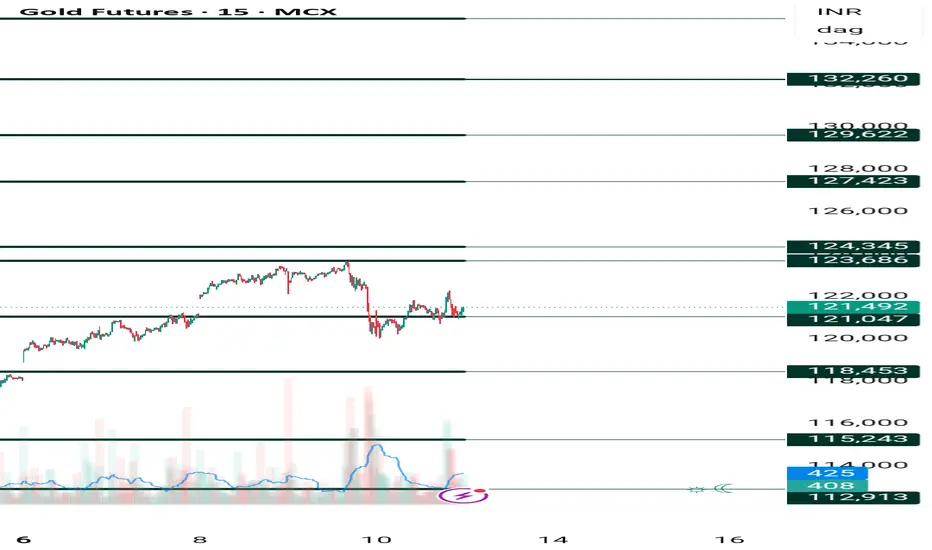
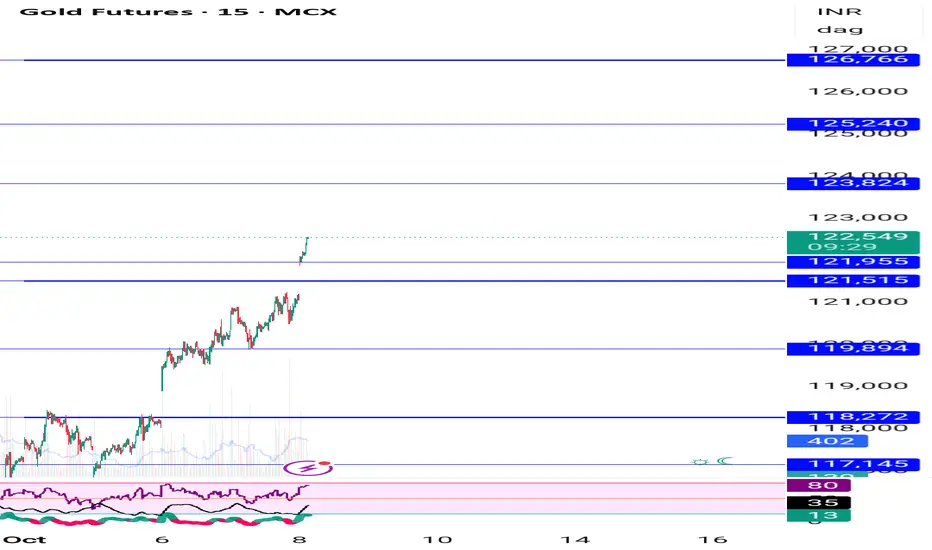
Gold buy on dip given near 121100 near now at 128000 book profitGold buy recommended at 121100 near now at 128000 book profit and wait for dip then again buy
How My Harmonic pattern projection Indicator work is explained below :
Recent High or Low :
D-0% is our recent low or high
Profit booking zone ( Early / Risky entry) : D 13.2% -D 16.1 % is
range if break them profit booking start on uptrend or downtrend but only profit booking, trend not changed
SL reversal zone (Safe entry ) : SL 23.1% and SL 25.5% is reversal zone if break then trend reverse and we can take reverse trade
Target : T1, T2, T3, T4 and .
Are our Target zone
Any Upside or downside level will activate only if break 1st level then 2nd will be active if break 2nd then 3rd will be active.
Total we have 7 important level which are support and resistance area
Until , 16% not break uptrend will continue if break then profit booking will start.
If break 25% then fresh downtrend will start then T1, T2,T3 will activate
1,3,5,10,15,20 minutes are short term levels.
30 minutes 60 minutes , 2 hours,3 hours, ... 1 day and 1 week chart positional and long term levels
Market insights

XAUUSD: 15/10/25_ TP HitOver all Trend is bullish
1. Entered on a fakeout setup
2. Entered when candle retraced 50% of the fakeout candle
3. next candle took deep liquidity ( Fuelcandle has formed )
4. Waited for TP to hit

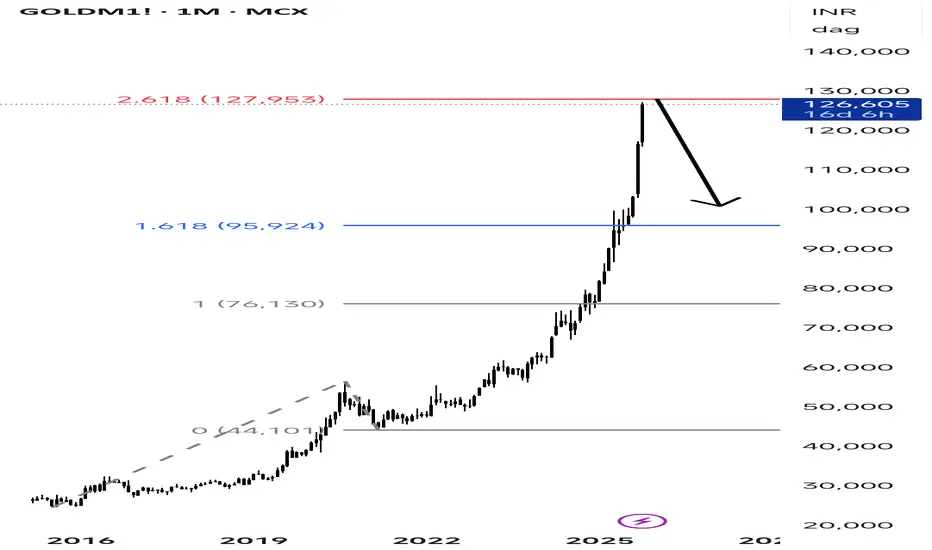
Gold positional target reachedGOLDM1 (MCX) Monthly Fibonacci Extension Analysis The current price of GOLDM1 is around ■126,690. Using Fibonacci extension levels, we identify major resistance and reversal zones. The
1.618 Fibonacci level at ■95,924 has already been breached strongly, indicating strong bullish
momentum. However, the price is now approaching the 2.618 level at ■127,953, which ishistorically considered an exhaustion point in trending markets. At this stage, gold is likely to face
selling pressure or profit booking from major market participants. If the price fails to break above
■128,000 convincingly, a downward correction towards ■100,000 is highly probable, which aligns
with the previous Fibonacci support zone. Conclusion: GOLDM1 is in a parabolic rise but has
entered a high-probability reversal zone. A short-term correction towards ■100,000 may occur
unless ■128,000 is broken with high volume.
XAUUSD : 14/10/24 _ TP HIT1. Trend is bullish- Daily
2. Support confirmed in 30 min during NY session
3. Entered on opening of next candle
4. Anticipated previous canlde wickfull
5. Closed full after wick fill

Part 2 Candle Stick PatternUnderstanding Call and Put Options
There are two basic types of options: Call Options and Put Options.
Call Option:
A call option gives the holder the right, but not the obligation, to buy an underlying asset at a specific price (called the strike price) before a specific date (called the expiry date).
Put Option:
A put option gives the holder the right, but not the obligation, to sell an underlying asset at a specific strike price before expiry.

Introduction and Types of Financial Markets1. Introduction to Financial Markets
A financial market is a marketplace where buyers and sellers engage in trading financial assets such as stocks, bonds, currencies, and derivatives. These markets play a crucial role in the financial system by ensuring the allocation of resources, facilitating liquidity, and enabling price discovery.
1.1 Definition
Financial markets can be defined as structured systems through which financial instruments are issued, bought, sold, or exchanged. These instruments represent claims on real assets or future income and include equities, debt instruments, currencies, and derivatives.
Key definitions:
Investopedia: "A financial market is any marketplace where trading of securities occurs, including the stock market, bond market, forex market, and derivatives markets."
Mishkin and Eakins: "Financial markets are markets where funds are transferred from savers to borrowers."
1.2 Importance of Financial Markets
Financial markets serve as a backbone for economic growth. Some of their major functions include:
Capital Formation: Financial markets channel funds from savers to investors, facilitating business expansion and economic development.
Liquidity: Investors can quickly buy or sell financial instruments, ensuring access to cash when needed.
Price Discovery: Financial markets determine the price of assets based on supply and demand dynamics.
Risk Management: Markets offer instruments such as derivatives to hedge against price fluctuations.
Efficiency: Efficient markets ensure optimal allocation of resources, reducing the cost of capital for businesses.
Economic Indicator: The performance of financial markets often reflects the health of an economy.
2. Key Functions of Financial Markets
Financial markets are not just for trading—they perform several vital functions that sustain the economy:
Mobilization of Savings: They attract individual and institutional savings and channel them into productive investments.
Facilitating Transactions: They enable the smooth transfer of funds between buyers and sellers.
Reducing Transaction Costs: Standardized processes reduce the cost of trading and make markets efficient.
Providing Marketability: Investors can sell securities quickly in liquid markets without significant losses.
Credit Availability: Financial markets provide mechanisms for borrowing and lending funds for various purposes.
Investment Opportunities: They provide diverse options for investing based on risk-return preferences.
Regulation and Stability: Well-regulated financial markets ensure transparency, fairness, and stability.
3. Classification of Financial Markets
Financial markets can be classified based on different criteria, such as the type of instrument traded, maturity period, and mode of trading. Broadly, they are divided into money markets and capital markets.
3.1 Money Market
The money market deals with short-term debt instruments that typically mature within one year. It is essential for managing liquidity in the economy.
Characteristics:
Short-term instruments
Low risk and low returns
High liquidity
Participants include commercial banks, corporations, and governments
Major Instruments in Money Market:
Treasury Bills (T-Bills): Government-issued short-term securities with maturities ranging from 91 to 364 days.
Commercial Paper (CP): Unsecured, short-term promissory notes issued by corporations to meet working capital needs.
Certificates of Deposit (CDs): Time deposits offered by banks, tradable in secondary markets.
Repurchase Agreements (Repos): Short-term borrowing using securities as collateral.
Significance: Money markets allow governments, banks, and corporations to efficiently manage short-term funding requirements.
3.2 Capital Market
The capital market deals with long-term securities with maturities beyond one year. It is divided into the primary market and the secondary market.
3.2.1 Primary Market
The primary market is where new securities are issued for the first time. It is crucial for capital formation.
Initial Public Offering (IPO): Companies raise funds from the public by issuing shares.
Follow-on Public Offer (FPO): Additional shares are issued by a company after an IPO.
Private Placements: Securities are sold directly to a limited number of institutional investors.
Rights Issue: Existing shareholders are offered new shares proportionate to their holdings.
Significance: The primary market provides the initial funding for companies, helping them expand operations and invest in growth.
3.2.2 Secondary Market
The secondary market is where previously issued securities are traded between investors.
Stock Exchanges: Organized platforms like NYSE, NASDAQ, and NSE facilitate trading of equities.
Over-the-Counter (OTC) Market: Securities are traded directly between parties without a centralized exchange.
Significance: Secondary markets provide liquidity, enabling investors to buy or sell securities easily, while also helping in price discovery.
4. Types of Financial Markets Based on Instruments
Apart from the money and capital market distinction, financial markets can also be classified based on instruments:
4.1 Stock Market (Equity Market)
Deals in company shares.
Provides investors ownership in corporations.
Helps companies raise equity capital for growth.
Examples: NYSE, NASDAQ, BSE, NSE.
4.2 Bond Market (Debt Market)
Deals in bonds and debentures issued by governments and corporations.
Investors lend money and receive periodic interest.
Less risky than equities but offer fixed returns.
Examples: Government bond markets, corporate bond markets.
4.3 Foreign Exchange Market (Forex)
Involves the trading of currencies.
Ensures liquidity for international trade and investment.
Influenced by macroeconomic factors like inflation, interest rates, and geopolitical events.
Participants: Central banks, commercial banks, multinational corporations, and retail traders.
4.4 Derivatives Market
Deals in contracts whose value is derived from underlying assets like stocks, bonds, currencies, or commodities.
Includes futures, options, swaps, and forwards.
Used for hedging risk and speculation.
Significance: Derivatives help investors manage financial risk efficiently.
4.5 Commodity Market
Trades raw materials like gold, silver, oil, and agricultural products.
Includes spot markets (immediate delivery) and futures markets (delivery at a future date).
Provides a platform for price discovery and risk management.
4.6 Cryptocurrency Market
Emerging digital asset market trading cryptocurrencies like Bitcoin, Ethereum, and stablecoins.
Operates 24/7 globally, often outside traditional financial systems.
High risk but offers significant opportunities for diversification and speculative trading.
5. Classification Based on Trading Mechanism
Financial markets can also be divided based on how trading occurs:
Organized/Exchange-Traded Markets: Regulated platforms with standardized contracts, like stock exchanges.
Over-the-Counter (OTC) Markets: Decentralized trading between two parties, e.g., Forex OTC markets.
Electronic/Online Markets: Internet-based platforms facilitating global trading with high efficiency and low costs.
6. Participants in Financial Markets
Financial markets include a wide range of participants who perform specific functions:
Investors: Individuals and institutions seeking returns.
Issuers: Companies and governments raising funds.
Intermediaries: Banks, brokers, and investment firms facilitating transactions.
Regulators: Authorities like SEBI, SEC, and RBI ensuring transparency and protecting investors.
Speculators: Traders aiming to profit from price fluctuations.
Hedgers: Participants managing risk using derivatives or other financial instruments.
7. Modern Trends in Financial Markets
Globalization: Markets are increasingly interconnected, enabling cross-border capital flows.
Technological Advancements: High-frequency trading, blockchain, and AI-driven analytics are transforming trading.
Sustainable Finance: ESG and green bonds are gaining importance.
Cryptocurrencies & Digital Assets: Digital currencies are expanding market opportunities.
Fintech Innovations: Mobile trading platforms and robo-advisors are democratizing access to markets.
8. Conclusion
Financial markets are the lifeblood of modern economies, facilitating the flow of capital, promoting investment, and enabling risk management. From money markets dealing with short-term debt instruments to capital markets providing long-term funding, each segment has a distinct role in economic development.
The evolution of financial markets—from traditional equity and debt instruments to sophisticated derivatives and digital assets—highlights their adaptability and centrality to global financial stability. Understanding these markets is essential for investors, policymakers, and businesses seeking to navigate the complex financial landscape efficiently.
Gold mcx 2450 points profit booked bought @121500 booked 123950Gold mcx 2450 points profit booked bought at 121500 on Friday today booked at 123950
Buy on dip will be continued
How My Harmonic pattern projection Indicator work is explained below :
Recent High or Low :
D-0% is our recent low or high
Profit booking zone ( Early / Risky entry) : D 13.2% -D 16.1 % is
range if break them profit booking start on uptrend or downtrend but only profit booking, trend not changed
SL reversal zone (Safe entry ) : SL 23.1% and SL 25.5% is reversal zone if break then trend reverse and we can take reverse trade
Target : T1, T2, T3, T4 and .
Are our Target zone
Any Upside or downside level will activate only if break 1st level then 2nd will be active if break 2nd then 3rd will be active.
Total we have 7 important level which are support and resistance area
Until , 16% not break uptrend will continue if break then profit booking will start.
If break 25% then fresh downtrend will start then T1, T2,T3 will activate
1,3,5,10,15,20 minutes are short term levels.
30 minutes 60 minutes , 2 hours,3 hours, ... 1 day and 1 week chart positional and long term levels

Part 7 Trading Master Class With Experts Factors That Affect Option Trading Decisions
When trading options, traders must analyze several aspects beyond just price direction:
Market Volatility: Options thrive on volatility. High volatility increases premiums.
Time to Expiry: The closer to expiry, the faster time decay (Theta effect).
Trend and Technical Analysis: Price patterns, volume, and support/resistance levels guide strike selection.
Implied Volatility (IV): It reflects the market’s expectation of future movement.
Events: Earnings announcements, policy decisions, and global news can move volatility and price sharply.
A skilled trader combines these factors with proper strategy and money management.

Market Microstructure and Institutional Trading Strategies1. Understanding Market Microstructure
Market microstructure focuses on the mechanics of trading rather than the fundamental valuation of assets. While traditional finance examines “why” prices should move based on information, market microstructure investigates how prices move, what factors influence trading efficiency, and how different participants interact.
1.1 Key Components
Trading Mechanisms:
Order-driven markets: Prices are determined by matching buy and sell orders (e.g., stock exchanges like NYSE, NSE).
Quote-driven markets (dealer markets): Market makers provide continuous bid and ask prices (e.g., forex markets, bond markets).
Hybrid markets: Combine order-driven and quote-driven features for improved liquidity and transparency.
Market Participants:
Retail traders: Small-scale investors making trades based on personal strategies.
Institutional investors: Large organizations trading significant volumes.
Market makers: Ensure liquidity by standing ready to buy or sell assets.
High-frequency traders (HFTs): Exploit very short-term inefficiencies using advanced algorithms.
Price Formation:
Market microstructure studies how the interaction of supply and demand, order types, and trading rules create asset prices. Concepts like bid-ask spread, depth of the order book, and price impact are central to understanding price formation.
Transaction Costs:
Every trade incurs costs: explicit costs (commissions, fees) and implicit costs (slippage, market impact). Understanding these is critical for large-scale traders to optimize execution.
2. Microstructure Theories
Market microstructure is supported by multiple theoretical frameworks:
The Inventory Model:
Market makers adjust prices based on inventory levels to mitigate risk. A dealer holding excess stock may lower prices to encourage buying and reduce exposure.
The Information Model:
Price movements reflect private information. Informed traders (e.g., institutions with advanced research) can cause prices to move before public information becomes available.
The Strategic Trading Model:
Large orders influence price movement. Traders may split large orders into smaller ones to avoid adverse market impact, a concept central to institutional trading strategies.
3. Institutional Trading
Institutional trading represents the actions of large entities managing substantial pools of capital. Their trades are not only larger than those of retail investors but also significantly influence market dynamics.
3.1 Types of Institutional Investors
Mutual Funds: Pool investor capital to invest across diverse assets.
Pension Funds: Focus on long-term investments to meet future liabilities.
Hedge Funds: Pursue high-risk, high-reward strategies using derivatives, leverage, and complex models.
Insurance Companies: Invest premiums to cover claims and generate steady returns.
Sovereign Wealth Funds: State-owned entities investing for national economic objectives.
3.2 Objectives and Constraints
Institutional investors balance return objectives with regulatory and liquidity constraints. Their strategies often prioritize minimizing market impact and execution costs while adhering to risk management mandates.
4. Institutional Trading Strategies
Large-scale investors deploy specialized trading strategies that reflect their goals, risk tolerance, and market conditions. These strategies can broadly be categorized into execution strategies, alpha strategies, and liquidity provision strategies.
4.1 Execution Strategies
Execution strategies aim to minimize the cost and market impact of large trades.
Algorithmic Trading:
Uses computer algorithms to automate order placement. Popular methods include:
VWAP (Volume Weighted Average Price): Splits large orders to execute at the average market volume price.
TWAP (Time Weighted Average Price): Spreads execution evenly over a set time frame.
Implementation Shortfall: Minimizes the difference between the decision price and execution price.
Iceberg Orders:
Large orders are broken into smaller visible slices to hide the true size and reduce market impact.
Dark Pools:
Private trading venues where institutions can execute large orders without revealing intentions to the broader market, thus limiting price impact.
4.2 Alpha Strategies
Alpha strategies aim to generate excess returns beyond the market benchmark.
Statistical Arbitrage:
Exploits short-term pricing inefficiencies using historical correlations and advanced quantitative models.
Momentum and Trend-Following:
Buys assets with upward momentum and sells those trending downward, often using technical indicators for timing.
Pairs Trading:
Trades two correlated securities: long on the underperformer and short on the outperformer, expecting convergence.
Event-Driven Strategies:
Capitalizes on events like mergers, acquisitions, earnings releases, or regulatory changes.
4.3 Liquidity Provision Strategies
Institutional traders often act as liquidity providers, profiting from the bid-ask spread while managing inventory risk.
Market Making:
Providing continuous quotes to facilitate trading while managing risk exposure.
Cross-Market Arbitrage:
Exploiting price differences between correlated markets, such as futures and underlying assets.
5. Interaction Between Market Microstructure and Institutional Strategies
The behavior of institutional investors shapes market microstructure significantly:
Price Impact:
Large trades move prices temporarily (or permanently), affecting short-term volatility. Market microstructure models help quantify these impacts and guide execution.
Liquidity Dynamics:
Institutions influence liquidity by their trading activity. Passive liquidity provision supports market stability, while aggressive trades can reduce depth temporarily.
Information Dissemination:
Institutional trades often signal private information to the market. Microstructure research examines how this information leaks through trading patterns.
Order Book Dynamics:
Large orders change the visible order book, affecting how other participants place orders. High-frequency traders often respond to these signals, amplifying market reactions.
6. Advanced Concepts
6.1 High-Frequency Trading (HFT)
HFT strategies operate at microsecond speeds, exploiting order book imbalances, latency arbitrage, and short-term momentum. These strategies interact with institutional trading, sometimes acting as liquidity providers and sometimes competing for the same alpha opportunities.
6.2 Transaction Cost Analysis (TCA)
TCA measures the effectiveness of trade execution by analyzing costs such as:
Explicit costs: Commissions, exchange fees.
Implicit costs: Market impact, slippage, timing risk.
Opportunity costs: Missed favorable prices.
Institutional traders use TCA to refine execution strategies, balancing speed and price improvement.
6.3 Dark Pools and Alternative Trading Systems (ATS)
Dark pools allow institutions to trade off-exchange, hiding the size and timing of large trades. While reducing market impact, they raise concerns about transparency and fair access for smaller investors.
7. Regulatory and Ethical Considerations
Institutional trading operates under strict regulatory frameworks to ensure market fairness, transparency, and risk management. Key areas include:
Best Execution: Mandates that brokers execute orders at the most favorable terms for clients.
Insider Trading Laws: Prevent trading based on non-public material information.
Market Manipulation Rules: Prohibit practices like spoofing and layering that distort prices.
Risk Management Requirements: Institutions must maintain capital adequacy and liquidity buffers.
Ethical concerns arise when strategies prioritize profit over market integrity, such as front-running or excessive use of dark pools.
8. Case Studies and Real-World Examples
BlackRock and Passive Investing:
As one of the world’s largest asset managers, BlackRock’s trades influence market microstructure, especially in ETFs. Their strategies aim to minimize tracking error while executing large orders efficiently.
Hedge Fund Activism:
Activist investors like Elliott Management target undervalued companies, executing trades that signal private information and provoke strategic changes, demonstrating the interaction between microstructure and institutional impact.
Flash Crashes and HFT:
Events like the 2010 “Flash Crash” highlight how high-frequency and institutional trading interact with microstructure, causing sudden liquidity shortages and extreme price volatility.
9. Future Trends
AI and Machine Learning in Execution:
Algorithms are increasingly leveraging AI to predict market impact, optimize order slicing, and anticipate short-term price movements.
Blockchain and Decentralized Markets:
Distributed ledgers could reshape market microstructure by providing transparency and reducing settlement times, impacting institutional strategies.
Environmental, Social, and Governance (ESG) Factors:
Institutional investors increasingly integrate ESG considerations into trading strategies, influencing demand patterns and market microstructure in specific sectors.
Globalization of Trading:
Cross-border trading increases complexity, requiring institutions to navigate different regulations, liquidity conditions, and currency exposures.
10. Conclusion
Market microstructure and institutional trading strategies are interlinked dimensions of modern financial markets. Microstructure provides insights into how markets operate, highlighting the role of liquidity, order flows, and price formation. Institutional strategies, in turn, reflect how large participants navigate these mechanics to execute trades efficiently, generate alpha, and manage risk.
Understanding these concepts is crucial not only for institutional traders but also for regulators, retail participants, and market analysts. It provides a framework to interpret market behavior, anticipate price movements, and design better trading systems. As technology evolves and global markets integrate, the interplay between microstructure and institutional strategies will remain a cornerstone of finance, shaping liquidity, volatility, and the efficiency of markets worldwide.
Gold uptrend will continue on tarrif uncertainty and rate cutGold buy on dip will continue on tarrif uncertainty and rate cut bets.
Updated levels given on chart for next week
How My Harmonic pattern projection Indicator work is explained below :
Recent High or Low :
D-0% is our recent low or high
Profit booking zone ( Early / Risky entry) : D 13.2% -D 16.1 % is
range if break them profit booking start on uptrend or downtrend but only profit booking, trend not changed
SL reversal zone (Safe entry ) : SL 23.1% and SL 25.5% is reversal zone if break then trend reverse and we can take reverse trade
Target : T1, T2, T3, T4 and .
Are our Target zone
Any Upside or downside level will activate only if break 1st level then 2nd will be active if break 2nd then 3rd will be active.
Total we have 7 important level which are support and resistance area
Until , 16% not break uptrend will continue if break then profit booking will start.
If break 25% then fresh downtrend will start then T1, T2,T3 will activate
1,3,5,10,15,20 minutes are short term levels.
30 minutes 60 minutes , 2 hours,3 hours, ... 1 day and 1 week chart positional and long term levels
As said earlier buy on dip willon gold new ATH next week Gold new ATH will come in next week buy on dop on support , levels given on chart
How My Harmonic pattern projection Indicator work is explained below :
Recent High or Low :
D-0% is our recent low or high
Profit booking zone ( Early / Risky entry) : D 13.2% -D 16.1 % is
range if break them profit booking start on uptrend or downtrend but only profit booking, trend not changed
SL reversal zone (Safe entry ) : SL 23.1% and SL 25.5% is reversal zone if break then trend reverse and we can take reverse trade
Target : T1, T2, T3, T4 and .
Are our Target zone
Any Upside or downside level will activate only if break 1st level then 2nd will be active if break 2nd then 3rd will be active.
Total we have 7 important level which are support and resistance area
Until , 16% not break uptrend will continue if break then profit booking will start.
If break 25% then fresh downtrend will start then T1, T2,T3 will activate
1,3,5,10,15,20 minutes are short term levels.
30 minutes 60 minutes , 2 hours,3 hours, ... 1 day and 1 week chart positional and long term levels

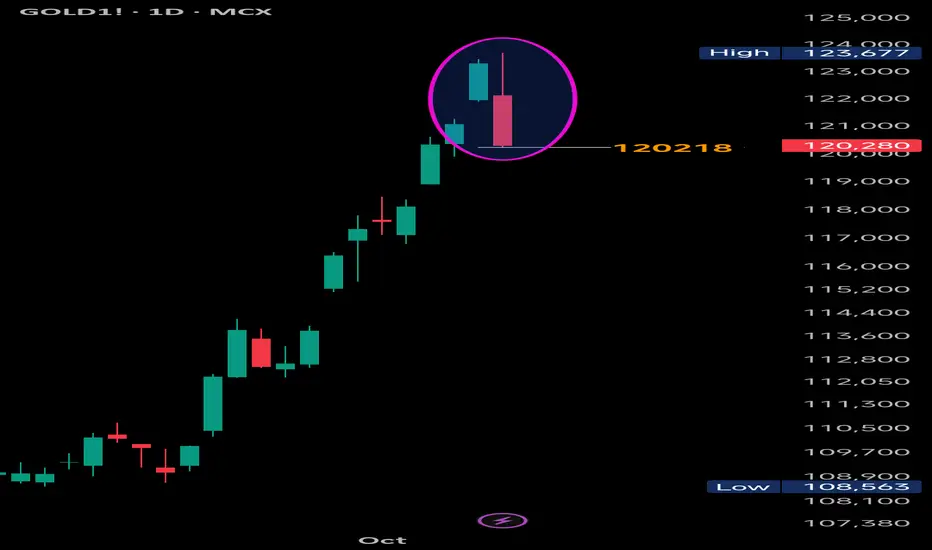
Gold: Bearish Engulfing – Is the Top In?Gold View:
Potential temporary top may be forming in Gold, marked by a strong Bearish Engulfing pattern on the daily chart. While it’s still early to confirm a full reversal, price action suggests caution for bulls.
✅ Confirmation:
A daily close below today's low 120,218 , especially with increased volume, would confirm the pattern and likely trigger further downside momentum.
❌ Negation:
If Gold manages to close above 123,677 (today’s high), the bearish structure will be invalidated.
🎯 Key Levels to Watch:
Resistance: 123,677 (pattern high)
Support: 120,218 (pattern low)
Stay alert for follow-through candles and volume spikes in coming sessions.
#Gold | #XAUUSD | #BearishEngulfing | #CandlestickPatterns | #TechnicalAnalysis | #PriceAction | #GoldAnalysis
📌 Disclaimer: This analysis is shared for educational purposes only. It is not a buy/sell recommendation. Please do your own research before making any trading decisions.
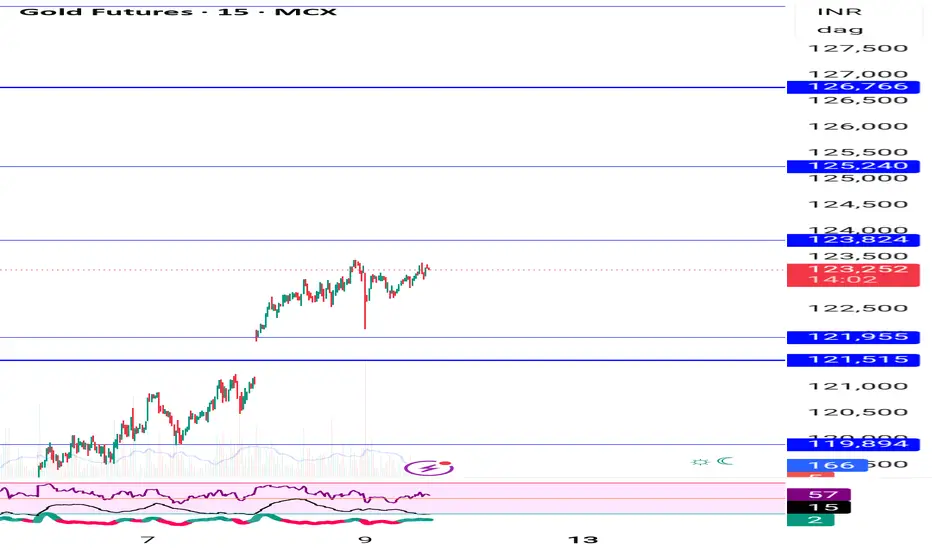
Gold mcx holding buy from 122550 in today fall upside continue Gold mcx holding buy trade from 122550 , upmove will continue, updated levels given on chart
How My Harmonic pattern projection Indicator work is explained below :
Recent High or Low :
D-0% is our recent low or high
Profit booking zone ( Early / Risky entry) : D 13.2% -D 16.1 % is
range if break them profit booking start on uptrend or downtrend but only profit booking, trend not changed
SL reversal zone (Safe entry ) : SL 23.1% and SL 25.5% is reversal zone if break then trend reverse and we can take reverse trade
Target : T1, T2, T3, T4 and .
Are our Target zone
Any Upside or downside level will activate only if break 1st level then 2nd will be active if break 2nd then 3rd will be active.
Total we have 7 important level which are support and resistance area
Until , 16% not break uptrend will continue if break then profit booking will start.
If break 25% then fresh downtrend will start then T1, T2,T3 will activate
1,3,5,10,15,20 minutes are short term levels.
30 minutes 60 minutes , 2 hours,3 hours, ... 1 day and 1 week chart positional and long term levels
Small Account Challenge in TradingWhy Small Account Challenges Are Popular
Several factors make small account challenges attractive to traders:
Low Financial Risk:
Trading with a small account reduces the exposure to catastrophic losses. This makes it ideal for beginners or those who want to learn without risking life-changing amounts.
Skill Development:
Success in trading is more about strategy and discipline than capital. A small account forces traders to refine their skills, including technical analysis, market timing, and psychological control.
Motivation:
Turning a small sum into a meaningful amount, even modestly, provides immense satisfaction and confidence.
Accessibility:
Many brokers now allow trading with minimal capital, often under $100, making this challenge feasible for almost anyone.
Key Challenges of Small Accounts
While small account trading has its benefits, it also comes with significant hurdles:
Limited Position Size:
Small accounts restrict the ability to diversify or take large positions. This limitation can make profits small and slow to accumulate.
High Impact of Fees and Commissions:
Brokerage fees, spreads, and slippage affect small accounts disproportionately. A single losing trade can wipe out a large portion of the account if fees are high.
Emotional Pressure:
Small accounts require precision. Every loss feels magnified, which can create emotional stress and lead to impulsive decisions.
Leverage Temptation:
Traders often turn to leverage to amplify returns. While leverage can increase gains, it also exponentially increases risk, potentially wiping out a small account in seconds.
Scaling Profits:
Compounding small profits into substantial growth is slower compared to larger accounts, testing patience and consistency.
Psychology of Small Account Trading
The mental aspect of trading a small account is crucial. Many traders fail not due to strategy flaws but psychological weaknesses.
Fear of Loss:
With limited capital, fear of losing even a small amount can paralyze decision-making or cause early exits from trades.
Overtrading:
Small accounts often tempt traders to overtrade, chasing every opportunity to “grow fast,” which usually leads to losses.
Discipline and Patience:
Successful small account traders develop strong discipline—sticking to strategies, following risk management rules, and avoiding emotional trading.
Mindset Shift:
Instead of seeking quick wins, the focus should be on consistent, small gains and learning from each trade.
Strategies for Small Account Success
To thrive with a small trading account, traders need robust strategies tailored for low capital:
1. Risk Management
Risk only 1–2% of the account per trade.
Avoid leverage unless necessary and manageable.
Use stop-loss orders to protect capital.
2. Focused Markets
Trade highly liquid assets to ensure tight spreads and easy entry/exit.
Examples: major forex pairs, popular stocks, ETFs, or index options.
3. Scalping and Short-Term Trades
Short-term trades can maximize small capital by exploiting small price movements.
Scalping requires focus and discipline but can be effective for small accounts.
4. Position Sizing
Use micro-lots or fractional shares if possible.
Avoid large positions that could risk the entire account on a single trade.
5. Learning and Record-Keeping
Maintain a trading journal to track strategies, outcomes, and mistakes.
Continuously refine your strategy based on performance and market conditions.
The Role of Leverage
Leverage is a double-edged sword for small accounts. While it allows traders to control larger positions with limited capital, it significantly increases risk.
Pros: Potential for higher returns, faster account growth.
Cons: Risk of complete account wipeout, emotional stress, and overtrading.
A conservative approach is to use leverage sparingly, ensuring losses are manageable.
Advantages of the Small Account Challenge
Skill Mastery: Small accounts force traders to master discipline, strategy, and risk management.
Reduced Financial Pressure: Losses are smaller, making it easier to learn without catastrophic consequences.
Foundation for Larger Accounts: Mastery of small account trading sets the stage for trading larger accounts confidently.
Psychological Resilience: Learning to control emotions in a small account builds mental toughness for the long term.
Common Mistakes to Avoid
Chasing Quick Profits: Avoid impulsive trades to grow the account too quickly.
Ignoring Risk Management: Never risk too much of your account in a single trade.
Overleveraging: High leverage may be tempting but is often disastrous.
Neglecting Education: Continuous learning is crucial; rely on strategy and analysis, not luck.
Trading Too Many Markets: Focus on one or two markets to gain expertise.
Examples of Small Account Challenges
Many traders have successfully turned small accounts into substantial portfolios by applying discipline and consistency:
A forex trader may start with $500, risking 1–2% per trade, and after a year of disciplined trading, grow the account to $5,000.
A stock trader using fractional shares might start with $1,000 and focus on swing trades, gradually increasing account size while managing risk carefully.
The key is consistency, risk management, and learning from every trade.
Practical Tips for Small Account Trading
Start with Education: Learn technical analysis, chart patterns, indicators, and market fundamentals.
Use Demo Accounts First: Test strategies without risking real money.
Set Realistic Goals: Aim for steady growth (e.g., 5–10% per month) instead of unrealistic gains.
Track Every Trade: Analyze winners and losers to refine strategy.
Avoid High-Fee Brokers: Fees can eat small accounts quickly, so choose low-cost brokers.
Control Emotions: Avoid revenge trading and stick to your trading plan.
Conclusion
The small account challenge is more than a test of financial skill—it’s a test of discipline, patience, and emotional intelligence. While growing a small trading account is difficult, it teaches invaluable lessons about risk management, trading psychology, and strategic thinking.
Success in small account trading doesn’t come from luck or high-risk gambles; it comes from consistent, disciplined efforts, a strong strategy, and a mindset focused on learning rather than immediate profit. Traders who master small accounts set themselves up for long-term success, eventually handling larger accounts with confidence and expertise.
In essence, a small account challenge is not just a trading exercise—it is a bootcamp for professional traders, shaping skills, mindset, and habits that last a lifetime.
Current Bull Market is GoldCurrently the Indian stock market is long time sideway correction phase, All equity index and equity Mutual fund is underperforming but One sectoor is Run by Bull Market that is the *Gold.
Gold is Now Full of the controlled by the Bull, If you are not invested in the Gold and 100% Invested in Equity the Gold Index in the important for the You. Now if you think market is goes up it is neccessory to stop Bull market in the Gold.

Gold upmove will continue until US shutdown settlement news comeGood upside move will continue, levels given on chart .
How My Harmonic pattern projection Indicator work is explained below :
Recent High or Low :
D-0% is our recent low or high
Profit booking zone ( Early / Risky entry) : D 13.2% -D 16.1 % is
range if break them profit booking start on uptrend or downtrend but only profit booking, trend not changed
SL reversal zone (Safe entry ) : SL 23.1% and SL 25.5% is reversal zone if break then trend reverse and we can take reverse trade
Target : T1, T2, T3, T4 and .
Are our Target zone
Any Upside or downside level will activate only if break 1st level then 2nd will be active if break 2nd then 3rd will be active.
Total we have 7 important level which are support and resistance area
Until , 16% not break uptrend will continue if break then profit booking will start.
If break 25% then fresh downtrend will start then T1, T2,T3 will activate
1,3,5,10,15,20 minutes are short term levels.
30 minutes 60 minutes , 2 hours,3 hours, ... 1 day and 1 week chart positional and long term levels
Market Swings, Inflation, and Interest Rates1. Market Swings: The Pulse of Financial Markets
Market swings, also known as market volatility, refer to the rapid and sometimes unpredictable fluctuations in asset prices. These swings can occur in stock markets, bond markets, commodities, or foreign exchange markets. They are driven by a combination of factors including economic data, geopolitical events, corporate earnings, investor sentiment, and macroeconomic policies.
Volatility is a natural part of financial markets. While minor fluctuations are expected, extreme swings often signal underlying instability or heightened uncertainty. For instance, a sudden drop in stock prices may be triggered by negative employment data, unexpected changes in central bank policies, or geopolitical tensions. Conversely, rapid upward swings can result from strong economic indicators, corporate profitability, or liquidity injections by central banks.
Understanding market swings requires recognizing that they are often a reflection of investor psychology as much as economic fundamentals. Fear and greed can amplify price movements, creating feedback loops that exacerbate market volatility.
2. Inflation: The Erosion of Purchasing Power
Inflation is the rate at which the general level of prices for goods and services rises, thereby eroding purchasing power. It is a critical macroeconomic variable because it directly impacts consumer behavior, corporate profitability, and investment decisions. Moderate inflation is considered healthy for the economy, as it encourages spending and investment. However, high inflation can destabilize markets, reduce real returns on investments, and create uncertainty about future economic conditions.
Inflation is measured using indices such as the Consumer Price Index (CPI) and the Producer Price Index (PPI). Persistent increases in these indices indicate that the cost of living is rising, which can lead to tighter monetary policy. For investors, rising inflation often leads to higher volatility in equities, bonds, and commodities. Certain sectors, like consumer staples and utilities, may perform relatively better during inflationary periods due to consistent demand, while growth-oriented sectors may suffer.
3. Interest Rates: The Cost of Money
Interest rates, determined primarily by central banks, represent the cost of borrowing money. They influence every aspect of the economy, from corporate investments to consumer spending. When central banks increase interest rates, borrowing becomes more expensive, which can slow economic activity. Conversely, lower interest rates encourage borrowing and investment but can also contribute to higher inflation.
Interest rates are closely tied to market swings and inflation. For example, when inflation rises unexpectedly, central banks may increase interest rates to cool down the economy. This can lead to sudden market adjustments, especially in interest-sensitive sectors such as real estate, banking, and technology. Conversely, during economic slowdowns, central banks often reduce interest rates to stimulate growth, which can drive equity markets higher.
4. The Interplay Between Market Swings, Inflation, and Interest Rates
The relationship between market swings, inflation, and interest rates is complex and cyclical. Inflation often drives central banks’ interest rate decisions, which in turn impact market volatility.
Inflation → Interest Rate Adjustment → Market Reaction: Rising inflation typically prompts central banks to increase interest rates to curb spending. This often results in market sell-offs, as higher rates increase borrowing costs for businesses and reduce consumer spending, impacting corporate profits.
Interest Rates → Market Liquidity → Market Swings: Lower interest rates generally increase liquidity in the market, encouraging investments in riskier assets like stocks and real estate. Conversely, higher interest rates can reduce liquidity, leading to increased volatility as investors reassess risk and reallocate assets.
Market Swings → Inflation Expectations → Policy Decisions: Significant market swings can influence inflation expectations. For instance, a sudden spike in commodity prices can heighten inflation fears, prompting central banks to intervene with policy adjustments.
5. Case Studies of Market Swings Influenced by Inflation and Interest Rates
The 1970s Stagflation: During the 1970s, the U.S. experienced high inflation combined with stagnant economic growth. Interest rates were raised to control inflation, leading to significant market volatility and prolonged economic uncertainty.
The 2008 Global Financial Crisis: Preceding the crisis, low-interest rates encouraged excessive borrowing and speculative investments. When the housing bubble burst, market swings were amplified, and inflationary pressures emerged briefly in certain sectors.
COVID-19 Pandemic Market Reactions: In 2020, global markets experienced extreme swings due to the pandemic. Central banks reduced interest rates to near-zero levels, injecting liquidity into markets. Inflation remained low initially but surged in 2021–2022, causing renewed volatility as central banks adjusted rates upward.
6. Sectoral Impact of Inflation and Interest Rate Changes
Different sectors respond uniquely to market swings driven by inflation and interest rates:
Technology and Growth Stocks: Highly sensitive to interest rate hikes because future earnings are discounted more heavily.
Consumer Staples and Utilities: Typically resilient during inflationary periods due to consistent demand.
Financials: Benefit from higher interest rates through improved net interest margins but may suffer if higher rates reduce loan demand.
Commodities: Often act as a hedge against inflation, but can experience volatility due to geopolitical risks and supply-demand imbalances.
7. Strategies for Investors Amid Market Swings
Investors can employ several strategies to navigate the intertwined effects of market swings, inflation, and interest rates:
Diversification: Spreading investments across sectors and asset classes reduces exposure to volatility.
Hedging: Using derivatives or inflation-protected securities to mitigate risks.
Monitoring Central Bank Signals: Paying close attention to monetary policy statements and inflation data to anticipate interest rate changes.
Value vs. Growth Balancing: Allocating between growth and value stocks based on interest rate and inflation trends.
Commodities and Real Assets: Incorporating gold, real estate, or commodities as a hedge against inflation.
8. Global Implications and Policy Considerations
The interplay of market swings, inflation, and interest rates is not confined to a single country. Global capital flows, trade dynamics, and foreign exchange markets amplify these effects across borders. For instance, interest rate hikes in the U.S. can lead to capital outflows from emerging markets, triggering currency depreciation and local market swings. Policymakers must balance inflation control with growth objectives, often navigating difficult trade-offs.
9. The Role of Technology and AI in Predicting Market Movements
Advances in technology, data analytics, and AI are helping investors and institutions better anticipate market swings. By analyzing inflation trends, interest rate projections, and historical market reactions, AI-driven models can provide probabilistic forecasts, aiding in more informed investment decisions. These tools, however, cannot eliminate risk entirely, especially during unprecedented shocks or black swan events.
10. Conclusion
Market swings, inflation, and interest rates are inseparable forces shaping the global financial landscape. Their interaction determines the rhythm of markets, influencing investment strategies, economic growth, and financial stability. For investors and policymakers, understanding these dynamics is crucial to navigating volatility and making strategic decisions. While the future is inherently uncertain, careful monitoring of inflationary trends, interest rate policies, and market signals can provide a roadmap for managing risk and capitalizing on opportunities in a complex economic environment.

XAUUSD : 06/10/25 - TP hit 1.Entry - NYSE session when FVG + P1 confirmed
2. MSS shift happend in 2 min during NY session
3. Entered during pullback
4. there are no High Resistance in either 4 hour or 1 hour but had one High resistance is there in 30 min TF , hence booked full at ATH
4. Closed full at 1:3
#ICT
Overall trend bullish hence looked for buy setups only

Advanced Hedging Techniques in Modern Financial Markets1. Introduction to Hedging
Hedging, at its core, is about reducing risk without necessarily eliminating profit opportunities. Businesses, investors, and financial institutions face multiple types of risks:
Market risk: Price fluctuations in equities, commodities, or currencies.
Interest rate risk: Changes in rates affecting bonds or loans.
Credit risk: Counterparty default in financial contracts.
Operational and systemic risk: Broader business or financial system risks.
Advanced hedging strategies aim not only to mitigate these risks but also to optimize cost efficiency, capital utilization, and portfolio resilience.
2. Basic Hedging vs Advanced Hedging
Before diving into advanced techniques, it is important to differentiate:
Basic Hedging: Simple instruments such as forward contracts, futures, or plain vanilla options are used. For example:
Buying a currency forward contract to lock in exchange rates.
Selling stock futures to protect against equity price decline.
Advanced Hedging: Complex strategies that combine multiple instruments, dynamic adjustments, quantitative models, or derivative overlays. These methods are suitable for institutional investors, large corporates, and hedge funds. Advanced hedging can involve:
Dynamic hedging using options “Greeks” (delta, gamma, vega, theta).
Cross-asset hedging using correlated instruments.
Volatility-based hedging using derivatives.
Multi-layered portfolio insurance techniques.
3. Advanced Hedging Techniques
3.1 Delta Hedging
Delta hedging is an options-based strategy to neutralize the price risk of an underlying asset.
Delta (Δ) measures how much an option’s price moves for a one-unit change in the underlying asset.
By holding a position in the underlying asset opposite to the delta of the option, traders can achieve delta neutrality, reducing directional risk.
Example:
If an investor holds a call option with a delta of 0.6 on 100 shares of a stock, the option position is equivalent to owning 60 shares. To hedge, the investor might short 60 shares, neutralizing exposure.
Advantages:
Protects against small price movements.
Can be dynamically adjusted for changing delta (“dynamic delta hedging”).
Challenges:
Requires frequent rebalancing.
Transaction costs can accumulate.
Gamma risk remains (sensitivity of delta to price changes).
3.2 Gamma and Vega Hedging
After delta, advanced hedgers consider gamma and vega:
Gamma (Γ): Measures the rate of change of delta concerning the underlying price. Gamma hedging ensures that the delta remains stable as the asset price fluctuates.
Vega (ν): Measures sensitivity to volatility. Vega hedging protects against market volatility swings.
Application:
Options traders often construct multi-leg positions (spreads, straddles, strangles) to hedge gamma and vega risks.
This is particularly useful in volatile markets where price swings and implied volatility can affect option premiums.
3.3 Cross-Hedging
When a perfect hedge instrument is unavailable, cross-hedging is used:
It relies on the correlation between two assets.
Example: Hedging oil price exposure with energy sector ETFs or related futures.
Considerations:
Requires statistical analysis of correlation coefficients.
Basis risk exists because correlations may not remain stable.
3.4 Currency and Interest Rate Hedging
For multinational firms, FX risk and interest rate risk are significant.
Currency Hedging Techniques:
Forward contracts: Lock exchange rates for future transactions.
Currency options: Protect against adverse moves while retaining upside.
Currency swaps: Exchange cash flows in different currencies over time.
Interest Rate Hedging:
Swaps: Exchange fixed-rate payments for floating-rate to manage interest rate exposure.
Caps and floors: Protect against rising or falling rates without eliminating potential gains.
Duration matching: Aligning asset and liability durations to neutralize rate sensitivity.
3.5 Volatility and Volatility Trading as Hedge
Advanced traders treat volatility itself as a tradable hedge:
Volatility Index Futures/Options (e.g., VIX): Hedging equity portfolios against sudden market swings.
Variance swaps: Enable direct exposure to volatility; gains offset portfolio losses in volatile markets.
Correlation trading: Using instruments where the correlation structure changes to protect portfolios.
3.6 Portfolio Insurance
Portfolio insurance techniques aim to cap downside while maintaining upside:
Protective Put Strategy:
Buy put options on an equity portfolio.
Losses are limited to the strike price, preserving potential gains.
CPPI (Constant Proportion Portfolio Insurance):
Dynamically adjusts exposure between risky and risk-free assets.
Ensures portfolio never falls below a pre-defined floor.
Option Overlay Strategies:
Use a combination of calls, puts, and spreads on existing holdings.
Provides flexibility, cost optimization, and risk control.
3.7 Commodity Hedging Techniques
Commodities have unique risks such as seasonal volatility, geopolitical shocks, and storage costs:
Basis Hedging: Hedging the difference between spot and futures prices.
Spread Hedging: Using one commodity contract to hedge another (e.g., Brent vs WTI crude).
Weather Derivatives: Protect against crop loss or energy demand fluctuations due to weather.
3.8 Dynamic Hedging Using Quantitative Models
Modern hedgers increasingly rely on quantitative models:
Stochastic modeling: Simulate multiple price paths to determine optimal hedge ratios.
Monte Carlo simulations: Assess the probability distribution of portfolio outcomes under various hedge strategies.
Machine learning: Predict volatility, correlation shifts, and optimal hedge rebalancing points.
These methods allow adaptive hedging, where strategies evolve as markets change.
3.9 Exotic Derivatives in Hedging
Exotic derivatives provide tailored risk mitigation:
Barrier options: Activate or deactivate when underlying hits certain levels.
Lookback options: Allow locking the best/worst prices historically.
Asian options: Average underlying prices reduce volatility risk in hedging.
Exotics are expensive but allow precise hedging in complex scenarios.
3.10 Hedging with ETFs and Index Products
For large portfolios, ETFs, index futures, and inverse ETFs provide broad exposure hedging:
Protect against sectoral or market-wide declines.
Low transaction cost and high liquidity.
Can be combined with options to create synthetic hedges.
3.11 Risk Parity and Multi-Asset Hedging
Advanced portfolios often apply risk parity principles:
Allocate capital based on risk contribution, not nominal allocation.
Use derivatives to hedge dominant risks while maintaining exposure to growth assets.
Example: Combine equity, bond, commodity, and FX derivatives to balance overall portfolio volatility.
4. Strategic Considerations in Advanced Hedging
Cost Efficiency: Hedging is not free; premiums, spreads, and transaction costs matter.
Dynamic Adjustment: Hedge ratios must evolve with market conditions.
Correlation and Basis Risk: Imperfect hedges can introduce unintended exposures.
Regulatory Compliance: Certain hedges may have accounting, tax, or reporting implications.
Liquidity Management: Highly illiquid instruments can increase hedging risk.
5. Case Studies in Advanced Hedging
5.1 Equity Portfolio Hedging
A $500 million equity portfolio uses delta-neutral options, volatility derivatives, and index futures to mitigate downside while retaining growth.
5.2 Commodity Exporter Hedging
A global oil producer uses cross-hedging, swaps, and weather derivatives to stabilize revenue across multiple markets.
5.3 Multinational Corporate FX Hedging
A tech giant uses currency swaps, forward contracts, and exotic options to manage exposure across 10+ currencies while minimizing hedging costs.
6. Benefits and Limitations of Advanced Hedging
Benefits
Risk reduction tailored to portfolio needs.
Preserves upside potential while limiting downside.
Enhances confidence for institutional and corporate planning.
Enables strategic investment in volatile environments.
Limitations
High complexity requiring expertise.
Costs can erode portfolio returns if overused.
Model and counterparty risk in derivative contracts.
Dynamic adjustments can be operationally intensive.
7. Future Trends in Hedging
AI-Driven Hedging: Machine learning models optimizing hedge ratios in real-time.
Cross-Asset and ESG Hedging: Incorporating climate risk and sustainability-linked instruments.
Blockchain and Tokenized Derivatives: Increasing transparency and accessibility for hedging instruments.
Integration with Risk Analytics: Hedging becomes a holistic portfolio management tool rather than a reactive measure.
8. Conclusion
Advanced hedging techniques are no longer optional for sophisticated investors and corporations—they are central to risk management in a volatile, interconnected world. By leveraging derivatives, dynamic models, exotic instruments, and cross-asset strategies, market participants can control downside risk, stabilize returns, and navigate complex financial landscapes efficiently. While advanced hedging requires expertise, costs, and constant vigilance, it remains a cornerstone of modern portfolio and corporate risk management.
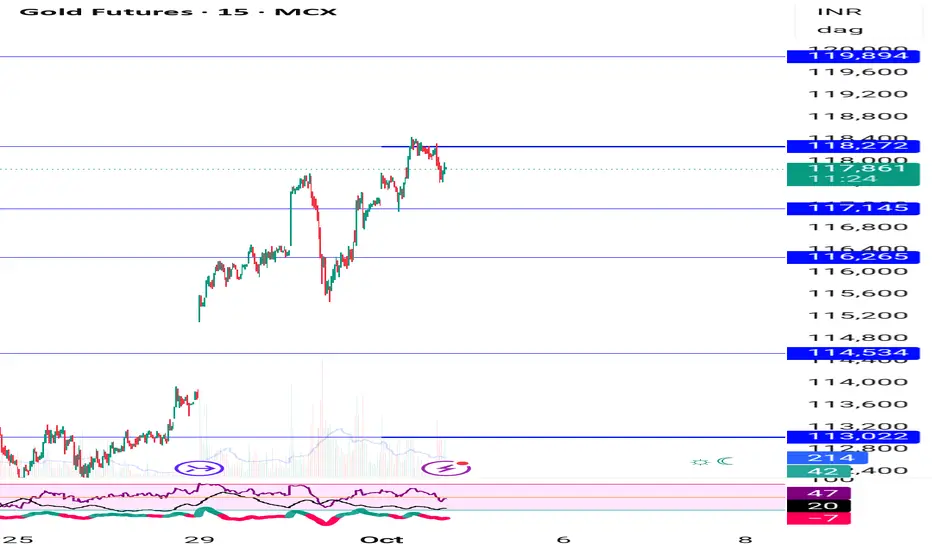
Gold holding buy from 116550 upside target 3910,3955,3990 comexGold mcx holding buy trade from 116550 , upside target 3910,3955,3990 on comex
How My Harmonic pattern projection Indicator work is explained below :
Recent High or Low :
D-0% is our recent low or high
Profit booking zone ( Early / Risky entry) : D 12.3% -D 16.1 % is
range if break them profit booking start on uptrend or downtrend but only profit booking, trend not changed
SL reversal zone (Safe entry ) : SL 23.1% and SL 25.5% is reversal zone if break then trend reverse and we can take reverse trade
Target : T1, T2, T3, T4 and .
Are our Target zone
Any Upside or downside level will activate only if break 1st level then 2nd will be active if break 2nd then 3rd will be active.
Total we have 7 important level which are support and resistance area
Until , 16% not break uptrend will continue if break then profit booking will start.
If break 25% then fresh downtrend will start then T1, T2,T3 will activate
1,3,5,10,15,20 minutes are short term levels.
30 minutes 60 minutes , 2 hours,3 hours, ... 1 day and 1 week chart positional and long term levels
Part 1 Ride The Big Moves1. Introduction to Options
An option is a financial contract that gives the buyer the right, but not the obligation, to buy or sell an underlying asset at a predetermined price, called the strike price, before or on a specified expiration date. Unlike stocks, options do not represent ownership in a company; instead, they are derivatives whose value is derived from the underlying asset (stocks, indices, commodities, or currencies).
There are two primary types of options:
Call Option: Grants the holder the right to buy the underlying asset at the strike price.
Put Option: Grants the holder the right to sell the underlying asset at the strike price.
Options can be American style (exercisable any time before expiration) or European style (exercisable only on the expiration date).
2. Key Terminology in Options Trading
To trade options effectively, you must understand the key terms:
Strike Price (Exercise Price): The price at which the underlying asset can be bought (call) or sold (put).
Premium: The cost of buying an option. Determined by factors like intrinsic value, time to expiration, volatility, and interest rates.
Expiration Date: The date on which the option contract becomes invalid.
In-the-Money (ITM): A call option is ITM if the stock price > strike price; a put is ITM if stock price < strike price.
Out-of-the-Money (OTM): A call option is OTM if the stock price < strike price; a put is OTM if stock price > strike price.
At-the-Money (ATM): The stock price is approximately equal to the strike price.
3. How Options Work
Options allow investors to control a larger number of shares with relatively small capital. Let’s look at an example:
Example:
Stock price of XYZ Ltd.: ₹1,000
Call option strike price: ₹1,050
Premium: ₹50
Expiration: 1 month
If the stock rises to ₹1,200, the call option holder can exercise the option, buy at ₹1,050, and sell at ₹1,200, making a profit of ₹150 per share (minus the premium of ₹50, net profit = ₹100).
If the stock stays below ₹1,050, the option expires worthless, and the loss is limited to the premium paid.
This limited-loss feature makes options attractive for hedging.
4. Participants in Options Market
Options trading involves different market participants with varying objectives:
Hedgers: Use options to protect their existing investments from adverse price movements. For example, a stock investor buys a put option to safeguard against a potential fall in stock price.
Speculators: Seek profit from price movements without owning the underlying asset. They take higher risk for potentially higher rewards.
Arbitrageurs: Exploit price discrepancies between options and the underlying assets to earn risk-free profits.
5. Option Pricing Models
Option pricing is critical for traders. The two most commonly used models are:
Black-Scholes Model (for European options):
It calculates the theoretical value of options using factors such as stock price, strike price, time to expiration, volatility, and risk-free interest rate.
Binomial Model:
Uses a step-by-step approach to evaluate options, useful for American options due to their early-exercise feature.
Factors Affecting Option Premiums:
Intrinsic Value: Difference between the underlying price and strike price.
Time Value: Additional value due to remaining time until expiration.
Volatility: Higher volatility increases premiums.
Interest Rates and Dividends: Can influence option pricing.

Gold mcx we are holding buy from 113700 ,1600 points profit runnWe are holding buy trade from 113700 from Friday closing , upside target 3855,3910 on comex
How My Harmonic pattern projection Indicator work is explained below :
Recent High or Low :
D-0% is our recent low or high
Profit booking zone ( Early / Risky entry) : D 12.3% -D 16.1 % is
range if break them profit booking start on uptrend or downtrend but only profit booking, trend not changed
SL reversal zone (Safe entry ) : SL 23.1% and SL 25.5% is reversal zone if break then trend reverse and we can take reverse trade
Target : T1, T2, T3, T4 and .
Are our Target zone
Any Upside or downside level will activate only if break 1st level then 2nd will be active if break 2nd then 3rd will be active.
Total we have 7 important level which are support and resistance area
Until , 16% not break uptrend will continue if break then profit booking will start.
If break 25% then fresh downtrend will start then T1, T2,T3 will activate
1,3,5,10,15,20 minutes are short term levels.
30 minutes 60 minutes , 2 hours,3 hours, ... 1 day and 1 week chart positional and long term levels

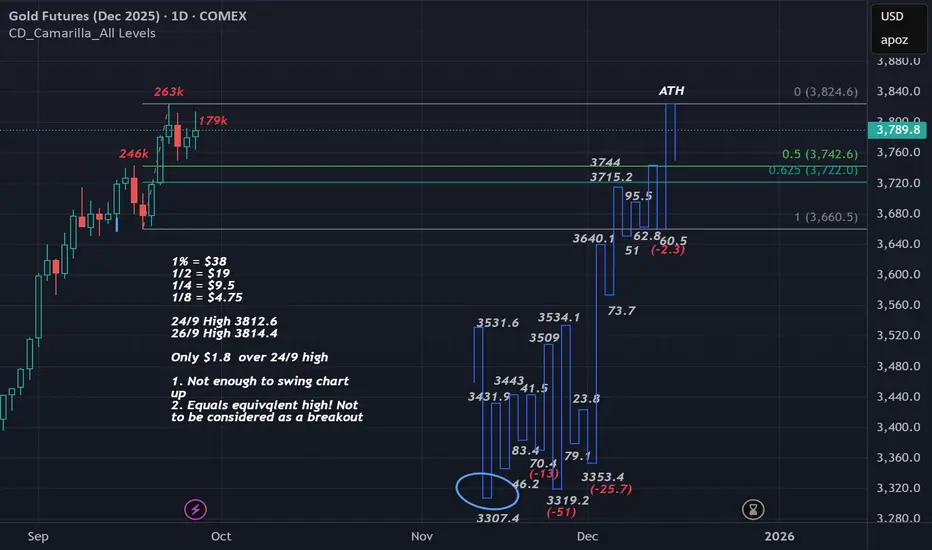
Gold Futures - Daily swing chart has not swung up23/9 High volume 262,918 sign of selling and high of 3824.6
Weekly swing : 200% of previous swing range = 3806.8 which equals $17.8 over resistance level.
Not even 1/2 % over resistance level.
The high volume and doing 200% of previous could be a sign sell off for a reaction to the 50%. We have not even tested the 50% of the daily swing ever lone the test of the weekly 50%.
Friday 26/9 High 3814.4 with lower volume and only $1.8 over the high of 24/9. Note 25/9 was an inside day so this day is ignored for our swing chart and we need to wait for a break of the 24th or see if it sells off.