NATURALGAS - EXPECTED LEVELS THIS WEEK (16 -20 OCT)Natural gas After falling 3.2% last week. Where pull back from 9 months high,
Crude oil expected range this week: 276.60- 263.60
Support at 263.60
Resistance at 276.50
Sell Below only 269.60
Natural Gas Mini Futures
Trade ideas

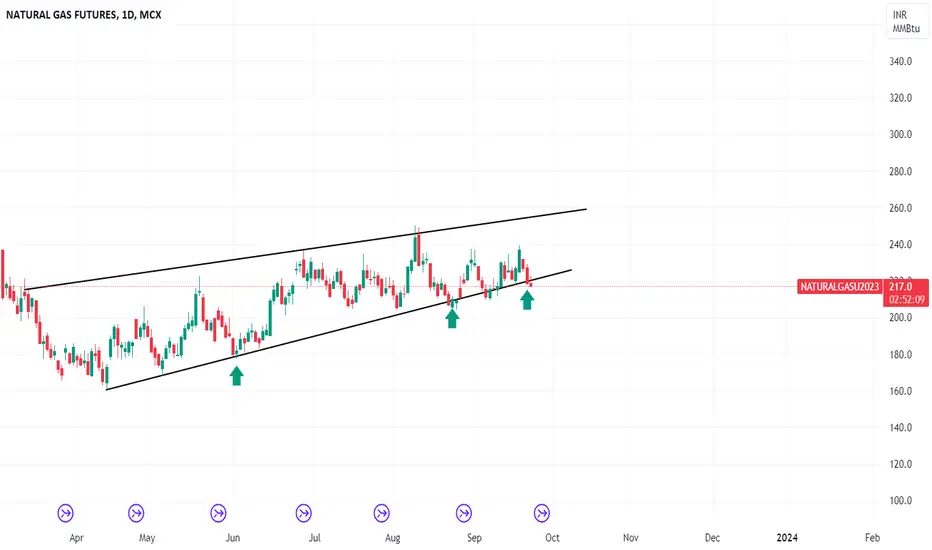
Bulls Will Take Control NaturalgasDear Followers,
I wanted to keep you informed about the latest developments in the MCX:NATURALGAS2! natural gas market. Recent trends indicate a potential Uptrend in natural gas prices. This presents a potential opportunity for a Long position.
Key Points: MCX:NATURALGAS1!
🔹 Natural gas prices have shown a consistent downward movement over the past weeks.
🔹 Supply levels have been relatively stable, while demand has experienced some fluctuations.
🔹 Experts suggest a short-term Bullish outlook for natural gas.
Action Plan:
Considering the above factors, it might be prudent to consider a Long position in the natural gas Sep Contracts.
Natural gas will try to face 1st Resistance Near 228-230 and If its break then Probably We Can See 245-250 level and if its break then it will test 260-270 level.
Buy Near 216-220 Stop Loss 208 Target 235,245,250
Investment Required - 70000
Maximum Loss - 10000
Profit Upto 42500
Risk Management:
As with any investment decision, there are inherent risks. Natural gas prices can be volatile, and sudden market shifts can impact your investment. Ensure you have a risk management plan in place.
Please note that market conditions can change rapidly. We recommend staying updated with real-time market data and consulting with a financial advisor before making any trading decisions.
Feel free to reach out to us if you have any questions or need further assistance.
Best regards,
Ajay Metha

NATURAL GAS DOWNSIDE MOVEMENTIf #NaturalGas breaks below its 276 support level, we can see further downside.

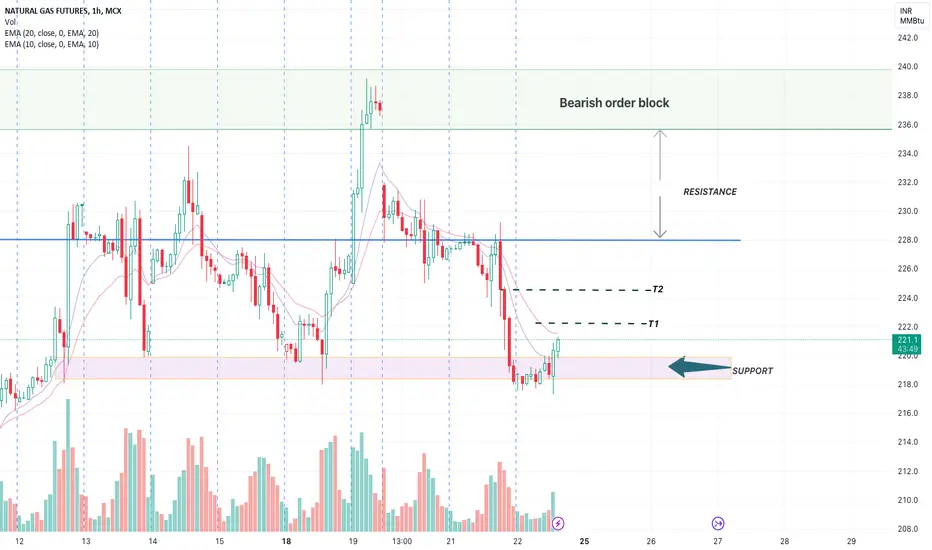
NATURAL GAS UPDATE (12 -13 OCT)Entry: Long if sustained above 286.5
Target: 294-300 zone
Stop loss: Below bearish order block (OB)
This analysis is based on the following factors:
The price has been trending upwards recently.
- There is a support level of 286.5.
- There is a resistance zone at 294-300.
- The trader is expecting the price to continue to move upwards if it sustains above 286.5. The trader is also expecting the price to pull back towards the bearish order block (OB) if it touches 286

natural gas update after hit 289 in mcxsell natural gas 281@mkt or come285 sl 290 cls base tgt 276--260+++ yes bear pattern occurred on daily chart sell on rise looks correction here

Naturalgas Full uptrendhi every one
natural gas is in the full uptrend so buy on dip
CE or future
Note : I am not sebi registered
risk as per your capacity

Natural Gas Important levels to watch! Natural Gas important levels to watch are as follows
#Support: 266.1
Sell below: 266 only on 15 minute candle closure below the level.
Target 1: 263
Target 2: 259
#Resistance: 270
Buy Above: 270 only on 15 minute candle closure Above the level.
Target 1: 272.5
Target 2: 276.5
=> # Remember each level will act as a support and resistance individually so there is a probability of reversal and a pullback on either side so its better to make an habit to book profits at each targets and re-enter again after a breakout from the same with a proper stoploss as per your own risk appetite.
=> # Please do your own research before initiating any trade. Always use stoploss in order to protect your capital.
=> #If you are Unable to trade properly and dissatisfied with your manual trading results due to psychological disadvantages or busy schedule or "Fear & Greed" emotions, then Algorithmic trading can be the most useful solution to overcome such problems. Kindly follow us and join us using details mentioned below the idea.
=> # Please refer our swing based support and resistance indicator if you find it useful give it a like.
=> # Follow us for more such information and educational ideas and Indicators. Give it a like if you appreciate the idea. Queries will be answered in comment section.
#Disclaimer: This is just a view and published here only for educational purpose, this should not be considered as a buy or sell signal. Trading in stock market may involve financial risk therefore, do your own research before taking any position.

natural gas stya abv 267 looks abv 280--300+++++ buy on dipsnatural gas stya abv 267 looks abv 280--300+++++ buy on dips with sl 251 yes spot abv 3$ buy on dipssss looking big breakout 3.30--3.50$+++

Awaiting a good impulseNatural gas has been in a consolidation for a long time in its year long support zone and is awaiting a good impulse move on either sides. Kindly add this to watchlist and see how the pattern turns out.

NATURAL GAS UPDATED CHART - 5th- 6th October By examining Naturalgas in the 4-hour frame, we can see that the price closed above (262 zone)bearish OB and also created a bullish candle. Expecting a flat or gap-up opening tomorrow.
TARGET -> 272- 275

#NATURALGASNATURAL Gas above 212 leads the way to 221 and then towards 245
Combustible after the levels Marked
Compression seen

view on natural gas ready for some more bearishness with sl of 225,
near to demand zone of 218 , if slipped below we could expect 200
NATURAL GAS - 22 SEP UPDATENatural gas sustained above the support zone mentioned targets will likely see a continuation of the uptrend, with potential for further upside.

Breakout or Breakdown SoonThe triangle pattern is set to ng and make a strong movement n next few days

natural gas move and levels of buy sellMCX:NATURALGAS1! ng is moving along with parallel channel currently near important buy level if breaks out of channel and sustains above fresh sell zone then ng can change direction once again.

Channel Break Out in NatGasNatural Gas is seen moving inside of a channel with upward slope and I also notice a downward sloping resistance trend line, from where the price is seen taking resistance.
Looking to short if price breaks down the channel for a target of 200.

Now Live : MCX Commodity Trading from TradingView.com with Dhan Dear TradingView community,
We love building for our users, investors & traders. One of the asks from early users of Dhan was about charting - we took that as a challenge and have continuously improved and built for our super traders.
Starting first with launching a dedicated Trade from Charts console with TradingView ( tv.dhan.co ) and then going further and introducing TradingView Connect with Broker where you can place orders directly from TradingView.com just by choosing Dhan as a broker on the Trading Panel. With that enabled for the first time in India, we now have more than 1,00,000 using Dhan to place orders on TradingView.com.
We enabled you to trade in Equities and Equity Futures via Dhan on TradingView. As always, our commitment to delivering incredible trading experience for India’s Super Traders remains unwavering.
Now to take Dhan’s TradingView experience even further we are introducing Commodity Futures trading directly on TradingView.com.
Best part? You can use all your favorite premium TradingView features to trade commodities with👇
Pine Editor
Community Script
Bar Replay
Multiple indicators
Multi Chart Layout
If you haven’t connected your Dhan account to TradingView yet, this is how you can do it:
Login to TradingView
Choose Dhan on the TradingView Panel
Place trade seamlessly
With this introduction, we are committed to providing you with a comprehensive trading experience right at your fingertips. Note that, Commodity Futures trading is made available across all TradingView platforms, which includes Web and Apps of TradingView.
Let us know your views on this and stay tuned for more updates.
Note: Access to premium features depends on the type of your TradingView subscription.
Happy Trading!
Naman

Natural gas🌟 buy above 224.50 stop 222 👇👇Tgt1 226
Tgt2 228
Tgt3- 230
Risky 232
Intraday wise shows updrend start
Above only 224.50

natural gas risky buyy mode 218.80 stop 212 tgt 223.50 next 232natural gas risky buy mode from here 218.80 stop 212 target 223.50 next 232
its only my view.. educational purpose only.. own research and trade

Natural Gas Looks good Positive divergence is seen on Natural gas.
Expecting a good upside move in Natural gas
Support 200
Resistance near 220

natural gas move predictionMCX:NATURALGAS1! move based on trendlline + support area on 45 min timeframe,
NG is currently facing rejection from 4 hr tf resistance level and moving towards trendline

