Natural gas start buy ner 405 -395 SL 385 target 445, 470, 510 Parameter Data Data
Asset Name Natural Gas Futures (MCX) (Dec 2025 Contract)
Price Movement 🟥 Sharp Negative Momentum (LTP \sim ₹404.00/MMBTU / -4.20\% change)
Current Trade 🟥 SHARP SELL / CORRECTION (Testing key demand zone)
SMC Structure 🟨 Correction Phase (Higher High structure challenged; pullba
Natural Gas Mini Futures
Sorry, this is only available to registered users
MCX provides data to our registered users only, so to get it you'll need to sign up for a TradingView account.
Related commodities

Natural we avoid buying in Friday upmove today fall done avoid Parameter Data Data
Asset Name Natural Gas MCX Futures (Dec 2025)
Last Traded Price (LTP) ₹448.30/mmBtu (Based on Image/Live Data Dec 8, 2025)
Price Movement (Day) 🔴 Highly Negative (-8.14%)
Current Trade 🔴 Strong Correction/Sell Active (Breakdown from highs)
Probability 🟡 Medium (55% for S1 test)
C
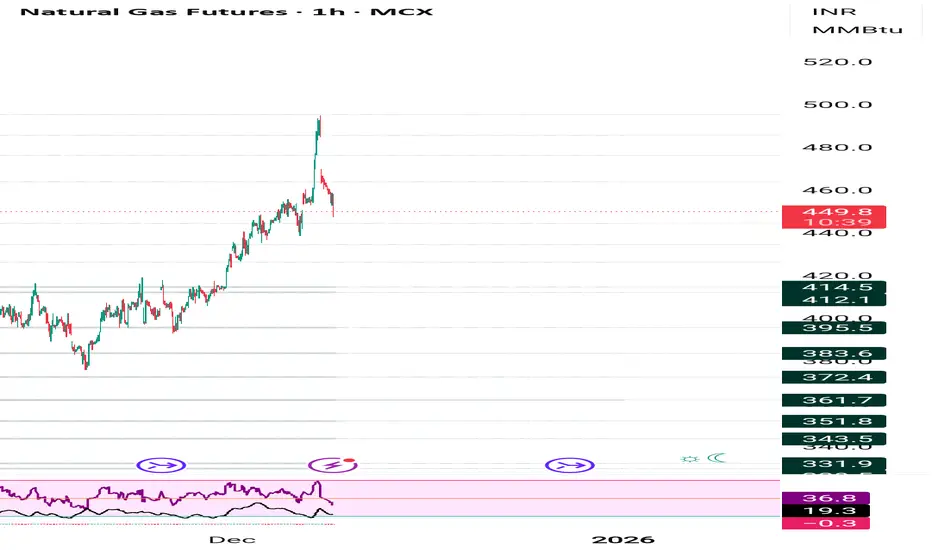
Time to play with NattyLook for buying opportunity today. I doubt it will come but if it comes to 407 it's a straight buying opportunity. Even at 408/404. Fib Retracement it will not break. One can trade with big quantities.

NG buy given but avoid suggested on comment when not sustain Parameter Data Data
Asset Name Natural Gas Futures (MCX)
Price Movement 🟥 Strong Bearish (₹371.1 / -2.62% from Prev. Close of ₹381.1)
Current Trade 🟥 SELL ON RALLIES (Short-term bearish trend confirmed)
SMC Structure 🟥 Bearish Order Flow (Breaking key support, potential Sell-side Liquidity Run)
Trap

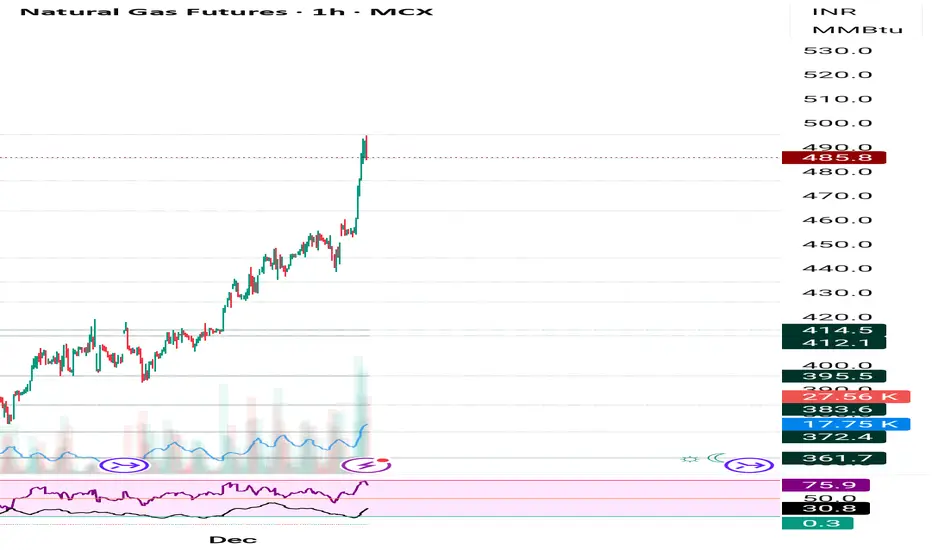
Natural gas AI tool data Analysis provided in description use itParameter Data
Asset Name Natural Gas MCX Futures (Dec 2025): ₹485.00/mmBtu (LTP: Dec 5, 2025 Close)
Price Movement Strong upside targeting and . Downside possible if is breached, targeting and .
Current Trade 🟩 BUY Active / T1: ₹495.00, T2: ₹520.00, T3: ₹545.00 / SL: ₹464.50
Risk Reward (
Pro Option Trading System1. Market Framework: Understanding Structure Before Strategy
Professionals never start with signals. They begin with market classification, because options behave differently under different environments.
A pro system starts by identifying:
Trend environment
Uptrend: bullish spreads, naked puts,
Part 8 Trading Master Class Rewards of Option Trading
Despite risks, options offer compelling advantages:
a) Limited Risk (for Buyers)
Option buyers know their maximum loss upfront—the premium paid.
b) High Return Potential
Small price movements in the underlying can result in substantial percentage gains.
c) Income Gene

Real Kowledge of Chart Pattern Key Principles for Chart Pattern Analysis
A. Trend Context
Patterns are more reliable when analyzed in the context of prevailing trends. For instance, reversal patterns in strong trends may fail without sufficient volume confirmation.
B. Volume Confirmation
Volume often provides confirmation for

Natural Gas Analysis in Daily TFNatural Gas completed in Leading Diagonal Pattern wave 1 cycle degree completed now in correction phase so don't go long immediately wait up to fib retrace 61.8% and wave ((4)) sweep then go long target Cycle degree wave 1 and 2 extension of 161.8 level may be reach in 2026 or 2027

natural gas crucial update after new high natural gas given corrective mode from high---now 2 scan possible here
1---ist buying range expect 432--415 as per chart structure looking good where can be again up side 452--470--490++ strong support looks 395@--390
2---- only if break 388 or close blw than trend change expect or chart structure w

See all ideas
Summarizing what the indicators are suggesting.
Neutral
SellBuy
Strong sellStrong buy
Strong sellSellNeutralBuyStrong buy
Neutral
SellBuy
Strong sellStrong buy
Strong sellSellNeutralBuyStrong buy
Neutral
SellBuy
Strong sellStrong buy
Strong sellSellNeutralBuyStrong buy
A representation of what an asset is worth today and what the market thinks it will be worth in the future.
Sorry, this is only available to registered users
MCX provides data to our registered users only, so to get it you'll need to sign up for a TradingView account.
Displays a symbol's price movements over previous years to identify recurring trends.
Frequently Asked Questions
Open interest is the number of contracts held by traders in active positions — they're not closed or expired. For Natural Gas Mini Futures this number is 27.81 K. You can use it to track a prevailing market trend and adjust your own strategy: declining open interest for Natural Gas Mini Futures shows that traders are closing their positions, which means a weakening trend.
Buying or selling futures contracts depends on many factors: season, underlying commodity, your own trading strategy. So mostly it's up to you, but if you look for some certain calculations to take into account, you can study technical analysis for Natural Gas Mini Futures. Today its technical rating is sell, but remember that market conditions change all the time, so it's always crucial to do your own research. See more of Natural Gas Mini Futures technicals for a more comprehensive analysis.