mcx natural gas brekaout updatemcx natural gas drag down 350 near@ after made high 490@ now some possibilities here on chart--
natural gas breakout point as per chart expert 365@ if sustain abv or close above than expect 385--400--430 after break out will see rock hard buy
if break structure 350@ than again dwn side 330--320 e
Sorry, this is only available to registered users
MCX provides data to our registered users only, so to get it you'll need to sign up for a TradingView account.
Related commodities

Natural gas still negative, AI tool report on description Parameter Data
Asset Name Natural Gas (NG) MCX Dec 2025 Futures
Price Movement 🟥 Strong Bearish Momentum (LTP: ₹353.50 | -0.76%)
Current Trade 🟥 SELL ON RISE (Resistance near ₹360-₹365)
SMC Structure 🟥 Bearish Break of Structure (BOS) on Daily TF
Trap/Liquidity Zones 🟥 Bullish Trap: ₹368.00 | 🟩 Liqu

Natural gas updated levels, if 395&400 break then uptrend startParameter Data Data
Asset Name Natural Gas Futures (MCX)
Price Movement 🟨 Technical Bounce/Mild Bullish (₹381.2 / +1.25% Live)
Current Trade 🟥 SELL ON RISE (Focus on short-term technical resistance)
SMC Structure 🟥 Bearish Order Flow (कीमतें 20-DEMA से नीचे हैं)
Trap/Liquidity Zones 🟥 Supply/Trap Zo

NG buy given but avoid suggested on comment when not sustain Parameter Data Data
Asset Name Natural Gas Futures (MCX)
Price Movement 🟥 Strong Bearish (₹371.1 / -2.62% from Prev. Close of ₹381.1)
Current Trade 🟥 SELL ON RALLIES (Short-term bearish trend confirmed)
SMC Structure 🟥 Bearish Order Flow (Breaking key support, potential Sell-side Liquidity Run)
Trap

Part 11 Trading Master ClassRole of Time and Volatility
Two critical forces dominate option trading:
Time Decay (Theta):
As expiry approaches, the time value of an option erodes. Option sellers often benefit from this decay, especially in sideways markets.
Implied Volatility (IV):
IV reflects market expectations of future p

natural gas crucial update after new high natural gas given corrective mode from high---now 2 scan possible here
1---ist buying range expect 432--415 as per chart structure looking good where can be again up side 452--470--490++ strong support looks 395@--390
2---- only if break 388 or close blw than trend change expect or chart structure w

Natural gas start buy ner 405 -395 SL 385 target 445, 470, 510 Parameter Data Data
Asset Name Natural Gas Futures (MCX) (Dec 2025 Contract)
Price Movement 🟥 Sharp Negative Momentum (LTP \sim ₹404.00/MMBTU / -4.20\% change)
Current Trade 🟥 SHARP SELL / CORRECTION (Testing key demand zone)
SMC Structure 🟨 Correction Phase (Higher High structure challenged; pullba

Time to play with NattyLook for buying opportunity today. I doubt it will come but if it comes to 407 it's a straight buying opportunity. Even at 408/404. Fib Retracement it will not break. One can trade with big quantities.

Natural we avoid buying in Friday upmove today fall done avoid Parameter Data Data
Asset Name Natural Gas MCX Futures (Dec 2025)
Last Traded Price (LTP) ₹448.30/mmBtu (Based on Image/Live Data Dec 8, 2025)
Price Movement (Day) 🔴 Highly Negative (-8.14%)
Current Trade 🔴 Strong Correction/Sell Active (Breakdown from highs)
Probability 🟡 Medium (55% for S1 test)
C
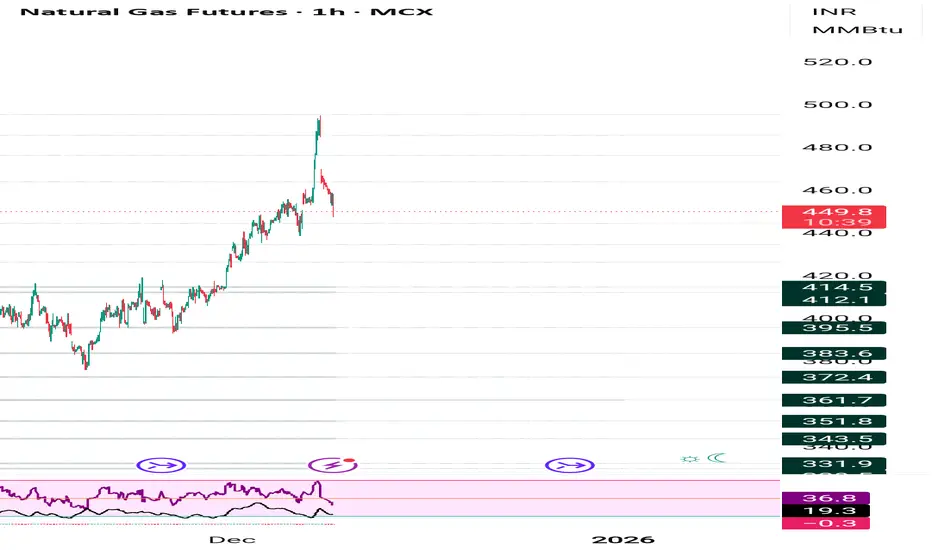
Chart Patterns What Are Chart Patterns?
Chart patterns are recognizable formations created by price movements on a chart. They develop over time and help traders identify trends, reversals, or continuation of trends. Chart patterns are usually formed by support and resistance levels, trendlines, and consolidation

See all ideas
A representation of what an asset is worth today and what the market thinks it will be worth in the future.
Sorry, this is only available to registered users
MCX provides data to our registered users only, so to get it you'll need to sign up for a TradingView account.
Displays a symbol's price movements over previous years to identify recurring trends.