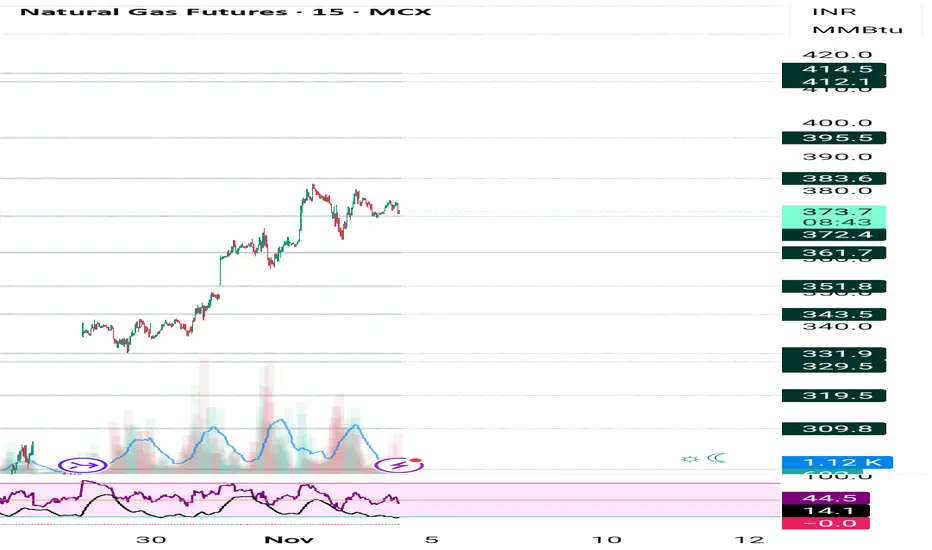
Holding sell trade on natural gas from 397 target 375-374🔑 Key Highlights (Locked Permanently)
- Supports/Resistances: 385 is the critical support; breach flips bias.
- Indicators: ADX >25, RSI 65, PCR 0.95 — all thresholds confirmed.
- Liquidity: VWAP 398 confirmed; turnover ₹7,980 Cr slightly below ₹8,000 Cr threshold ⚠.
- Volatility: IV 15.6%, RV
Sorry, this is only available to registered users
MCX provides data to our registered users only, so to get it you'll need to sign up for a TradingView account.
Contract highlights
Related commodities

Natural gas avoid buying at current price 345-340 best buy areaNatural gas avoid buying at current price levels given on chart .
How My Harmonic pattern projection Indicator work is explained below :
Recent High or Low :
D-0% is our recent low or high
Profit booking zone ( Early / Risky entry) : D 13.2% -D 16.1 % is
range if break them profit booking

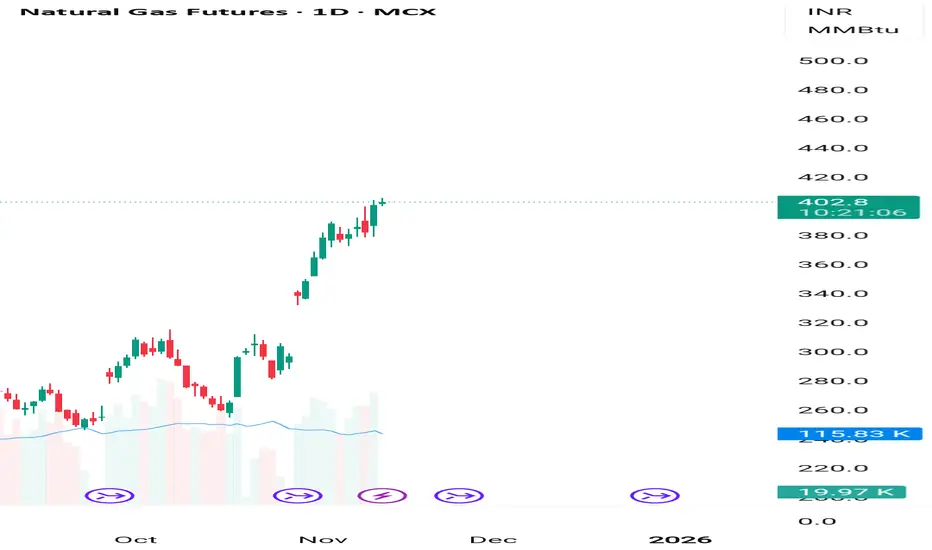
AITool showing Natural gas 395 until not break upmove continue 🔑 Key Highlights
- Price Action: Natural Gas is holding steady above ₹402, showing mild bullish momentum.
- Trend: Long Build‑Up (Price↑ + OI↑), suggesting fresh long positions.
- Supports: ₹399 / ₹395 / ₹389.
- Resistances: ₹406 / ₹412 / ₹420.
- Bias: Bullish continuation if ₹399 holds; cor
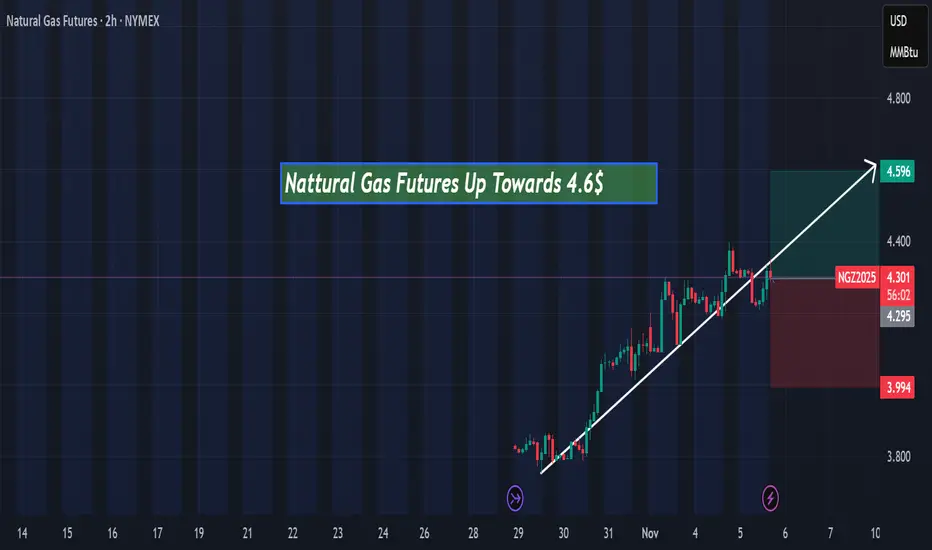
Natural Gas Futures Up towards 4.6$Hi everyone, today Natural Gas Futures is expected to rise toward $4.60 in the next few hours according to my technical analysis.
Naturalgas 395 to 405 range trade after breaking 🔑 Key Highlights
- Price Action: Natural Gas trading at ₹400, holding above ₹395 support.
- Trend: Active Long Build‑Up confirmed.
- Supports: ₹395 / ₹388 / ₹382.
- Resistances: ₹405 / ₹412 / ₹420.
- Bias: Bullish continuation if above ₹395; corrective pullback risk below ₹388.

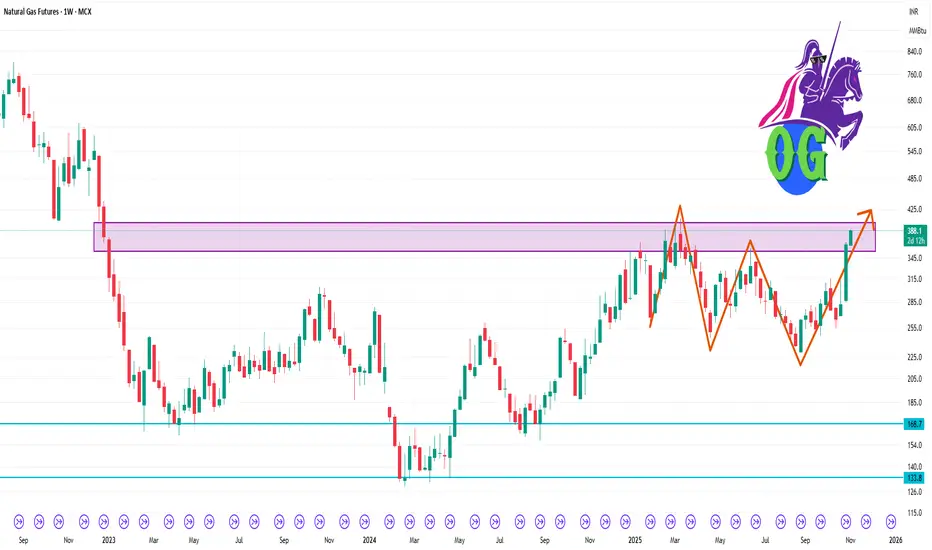
Natural Gas Futures 1 Week Time Frame 🎯 Key Levels
Support zone: ~ ₹ 270-285 per mmBtu — this appears to be a hinge demand zone based on recent pullbacks.
Intermediate support / pivot: ~ ₹ 295-310 — price has been oscillating near this zone.
Resistance zone: ~ ₹ 330-350 — breaking above this on a weekly close would shift structure mo
Prime area for reversalThere has been an explosive price surge that is not supported by corresponding volume, and the chart is currently near its seasonal highs. This move appears overextended, increasing the likelihood of a gap-filling correction in the near term. Traders should watch closely for signs of reversal, as in

Part 4 Learn Institutional TradingAdvantages of Option Trading
Leverage:
Options allow control over large quantities of an asset with a small investment (premium). This magnifies potential profits.
Limited Risk for Buyers:
When buying options, the maximum loss is limited to the premium paid.
Hedging Capability:
Options can offset

Geopolitical Energy TradingThe Intersection of Power, Politics, and Global Markets
Energy is the lifeblood of the global economy. Every modern industry—from manufacturing and transportation to technology and agriculture—relies on steady energy supplies. Yet, energy trading is not simply a matter of market forces like supply
Natural gas updated levels 350-345 support area avoid buy at cmpNatural gas avoid buying at current price 350-345 support area
How My Harmonic pattern projection Indicator work is explained below :
Recent High or Low :
D-0% is our recent low or high
Profit booking zone ( Early / Risky entry) : D 13.2% -D 16.1 % is
range if break them profit booking sta
See all ideas
A representation of what an asset is worth today and what the market thinks it will be worth in the future.
Sorry, this is only available to registered users
MCX provides data to our registered users only, so to get it you'll need to sign up for a TradingView account.
Displays a symbol's price movements over previous years to identify recurring trends.
Frequently Asked Questions
The nearest expiration date for Natural Gas Futures is Feb 23, 2021.
Traders prefer to sell futures contracts when they've already made money on the investment, but still have plenty of time left before the expiration date. Thus, many consider it a good option to sell Natural Gas Futures before Feb 23, 2021.