Natural Gas – Decoding the Breakout Beyond Data NoiseNatural Gas Futures – Absorbing the Bearish Data, Anticipating Winter Demand
By Chart Pathik | 31 October 2025
Market Overview
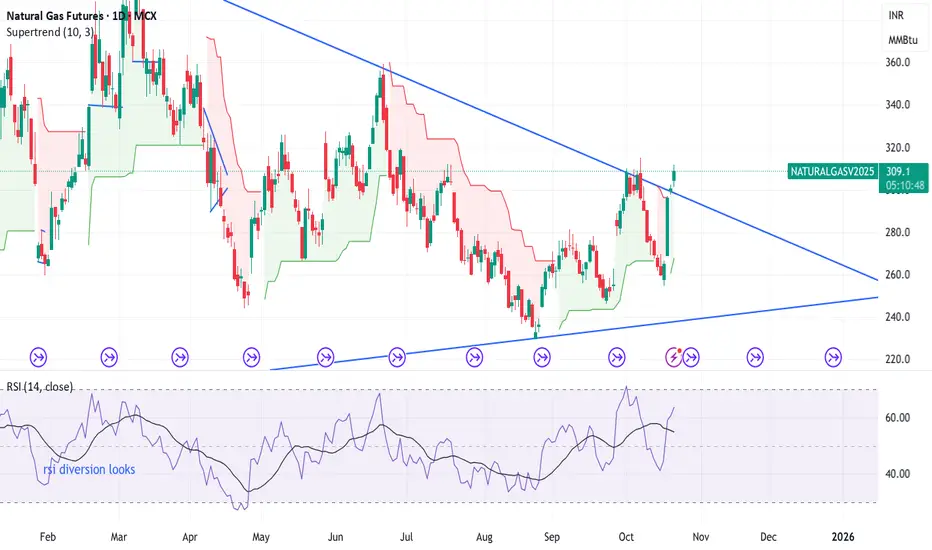
Natural Gas prices on MCX have sustained a strong upward trajectory this week, breaking out from a prolonged symmetrical triangle pattern. This price action came in despi
Sorry, this is only available to registered users
MCX provides data to our registered users only, so to get it you'll need to sign up for a TradingView account.
Contract highlights
Related commodities

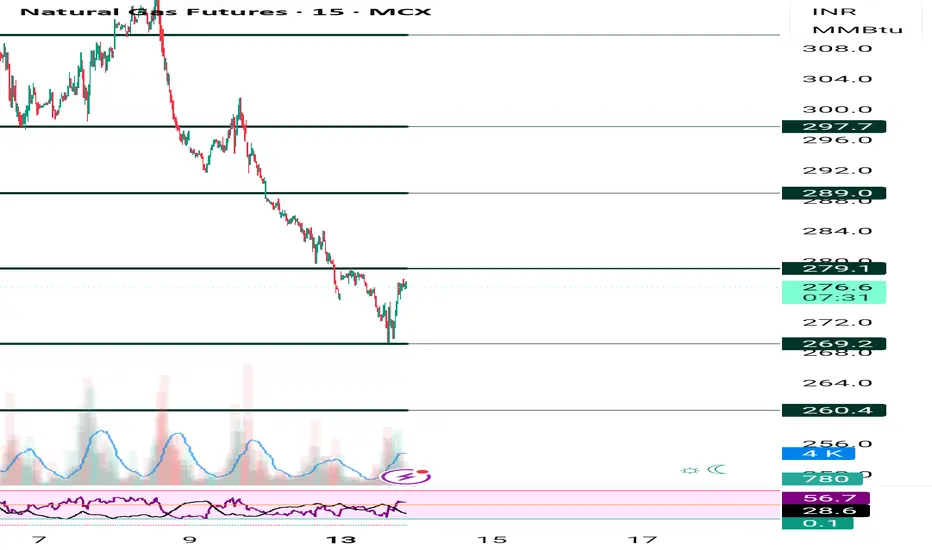
Testing Key Resistance Before Seasonal Up MovePrice is currently hovering near the top of the last resistance zone, while the rollover contract has opened slightly below it, signaling a pause after the recent rally.
If price closes below this level, a pullback toward the 3.56 support zone is likely — a healthy retest before the anticipated Nove

LONG NATURAL GAS FOR A TARGET OF 400 RSNatural Gas futures are trading around ₹280, and I remain bullish in the short to medium term. The price action suggests a likely pullback toward ₹270, which I see as a healthy correction before the next strong upside move.
Technically, Natural Gas recently broke out of a consolidation range (₹265–

Naturalgas buy given at 265 booked at 310 ,275-270 possible Natural gas buy recommended ner 265 , we booked profit at 310 , more fall possible from cmp 275-270
How My Harmonic pattern projection Indicator work is explained below :
Recent High or Low :
D-0% is our recent low or high
Profit booking zone ( Early / Risky entry) : D 13.2% -D 16.1 % is

natural mcx update after triangle breakout mcx natural gas triangle breakout ------- on daily chart seen clear break triangle pattern or now looks prices up side till 330--345--360++++ very soon here .
trading ideas---- aggressive trader can buy with closing base sl 298 or let see where lvl to move
Part 12 Trading Master ClassBenefits and Risks of Option Trading
Option trading offers numerous benefits—flexibility, hedging ability, leverage, and strategic variety. Traders can profit in any market direction or even from sideways movements. Yet, risks are equally significant. Buyers risk losing the entire premium, while op

Natural gas maximum downside done start buy on dip near low Natural gas start buying on dip near recent low SL 155- upside 280-295, 310
How My Harmonic pattern projection Indicator work is explained below :
Recent High or Low :
D-0% is our recent low or high
Profit booking zone ( Early / Risky entry) : D 13.2% -D 16.1 % is
range if break them prof

Divergence Secrets Option Premium Components
The option premium (price) has two parts:
Intrinsic Value: The actual value if exercised now (difference between stock price and strike price).
Time Value: The extra amount traders pay for the potential of future movement before expiry.
As expiry approaches, time value


Natural gas as said yesterday more fall pending, bounce come Natural gas as said yesterday more fall possible 269 near come the. Bounce from support, start buying on dip near 270 -268
How My Harmonic pattern projection Indicator work is explained below :
Recent High or Low :
D-0% is our recent low or high
Profit booking zone ( Early / Risky entry) :
See all ideas
A representation of what an asset is worth today and what the market thinks it will be worth in the future.
Sorry, this is only available to registered users
MCX provides data to our registered users only, so to get it you'll need to sign up for a TradingView account.
Displays a symbol's price movements over previous years to identify recurring trends.
Frequently Asked Questions
The nearest expiration date for Natural Gas Futures is Aug 26, 2020.
Traders prefer to sell futures contracts when they've already made money on the investment, but still have plenty of time left before the expiration date. Thus, many consider it a good option to sell Natural Gas Futures before Aug 26, 2020.